Project Management Jobs in the UK excluding London

Project Management
UK > UK excluding London

The table below provides summary statistics for permanent job vacancies advertised in the UK excluding London requiring Project Management skills. It includes a benchmarking guide to the annual salaries offered in vacancies that cited Project Management over the 6 months leading up to 20 January 2025, comparing them to the same period in the previous two years.

6 months to
20 Jan 2025
Same period 2024 Same period 2023
Rank 9 24 24
Rank change year-on-year +15 0 +9
Permanent jobs citing Project Management 4,428 3,125 5,418
As % of all permanent jobs advertised in the UK excluding London 9.68% 7.66% 9.06%
As % of the Processes & Methodologies category 10.62% 8.64% 9.51%
Number of salaries quoted 2,099 2,037 2,632
10th Percentile £36,250 £32,500 £35,269
25th Percentile £45,628 £41,250 £42,500
Median annual salary (50th Percentile) £55,000 £52,500 £53,853
Median % change year-on-year +4.76% -2.51% +3.56%
75th Percentile £63,750 £63,750 £65,000
90th Percentile £75,000 £75,000 £75,000
UK median annual salary £56,500 £57,500 £59,525
% change year-on-year -1.74% -3.40% +8.23%

All Process and Methodology Skills
UK excluding London

Project Management falls under the Processes and Methodologies category. For comparison with the information above, the following table provides summary statistics for all permanent job vacancies requiring process or methodology skills in the UK excluding London.

Permanent vacancies with a requirement for process or methodology skills 41,684 36,160 56,957
As % of all permanent jobs advertised in the UK excluding London 91.12% 88.64% 95.26%
Number of salaries quoted 16,648 25,475 32,386
10th Percentile £32,500 £27,500 £30,500
25th Percentile £41,361 £37,500 £40,000
Median annual salary (50th Percentile) £55,000 £50,000 £55,000
Median % change year-on-year +10.00% -9.09% +10.00%
75th Percentile £68,114 £65,000 £70,000
90th Percentile £81,250 £80,000 £84,000
UK median annual salary £60,000 £57,500 £62,500
% change year-on-year +4.35% -8.00% +4.17%

Project Management
Job Vacancy Trend in the UK excluding London

Job postings citing Project Management as a proportion of all IT jobs advertised in the UK excluding London.
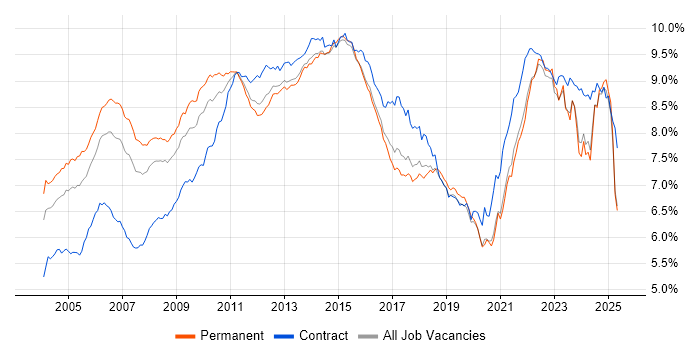
Job vacancy trend for Project Management in the UK excluding London

Project Management
Salary Trend in the UK excluding London

3-month moving average salary quoted in jobs citing Project Management in the UK excluding London.

Salary trend for Project Management in the UK excluding London

Project Management
Salary Histogram in the UK excluding London

Salary distribution for jobs citing Project Management in the UK excluding London over the 6 months to 20 January 2025.

Salary histogram for Project Management in the UK excluding London

Project Management
Job Locations in the UK excluding London

The table below looks at the demand and provides a guide to the median salaries quoted in IT jobs citing Project Management within the UK excluding London region over the 6 months to 20 January 2025. The 'Rank Change' column provides an indication of the change in demand within each location based on the same 6 month period last year.

Location Rank Change
on Same Period
Last Year
Matching
Permanent
IT Job Ads
Median Salary
Past 6 Months
Median Salary
% Change
on Same Period
Last Year
Live
Jobs
North of England +16 1,487 £55,000 - 366
North West +20 1,082 £55,500 +0.91% 240
Midlands +8 943 £55,000 +3.77% 198
South East +2 872 £57,670 +9.85% 257
West Midlands +1 490 £57,500 +4.55% 128
East Midlands +15 437 £52,000 +4.02% 70
South West +5 382 £52,000 +4.00% 127
East of England 0 304 £50,000 -13.04% 131
Scotland +37 276 £54,043 +12.59% 73
Yorkshire +5 268 £55,000 - 95
North East +6 136 £57,000 +8.57% 35
Wales +12 121 £50,000 +15.77% 23
Northern Ireland +8 36 £50,000 -13.04% 32
Channel Islands - 7 £50,000 -
Isle of Man - 3 £43,000 -
Project Management
UK

Project Management
Co-occurring Skills and Capabilities in the UK excluding London by Category

The follow tables expand on the table above by listing co-occurrences grouped by category. The same employment type, locality and period is covered with up to 20 co-occurrences shown in each of the following categories:

Application Platforms
1 186 (4.20%) SharePoint
2 67 (1.51%) Confluence
3 57 (1.29%) CMS
4 43 (0.97%) WordPress
5 36 (0.81%) Microsoft Exchange
6 21 (0.47%) Kentico
7 11 (0.25%) Apache
7 11 (0.25%) Umbraco
8 9 (0.20%) ArcGIS
8 9 (0.20%) SAS
9 8 (0.18%) Apache Spark
9 8 (0.18%) OpenStack
9 8 (0.18%) Sitecore CMS
9 8 (0.18%) Sitefinity
10 7 (0.16%) nginx
11 6 (0.14%) CloudStack
12 3 (0.068%) Adobe Experience Manager
12 3 (0.068%) Apache Solr
12 3 (0.068%) Skype for Business
13 2 (0.045%) Drupal
Applications
1 328 (7.41%) Microsoft Office
2 255 (5.76%) Microsoft Excel
3 191 (4.31%) Microsoft Project
4 124 (2.80%) Microsoft PowerPoint
5 67 (1.51%) Simulink
6 41 (0.93%) AutoCAD
7 28 (0.63%) Trello
8 25 (0.56%) MS Visio
9 14 (0.32%) Spreadsheet
10 7 (0.16%) Revit
11 5 (0.11%) Camtasia
12 4 (0.090%) SketchUp
13 3 (0.068%) Productboard
14 2 (0.045%) Acrobat
14 2 (0.045%) Photoshop
15 1 (0.023%) Adobe Illustrator
15 1 (0.023%) FrameMaker
15 1 (0.023%) InDesign
15 1 (0.023%) SOLIDWORKS
15 1 (0.023%) Windchill
Business Applications
1 73 (1.65%) Teamcenter
2 31 (0.70%) Shopify
3 29 (0.65%) NetSuite
3 29 (0.65%) SAP S/4HANA
4 25 (0.56%) Dynamics CRM
5 15 (0.34%) Maximo
6 11 (0.25%) HFM
6 11 (0.25%) Oracle ERP
7 10 (0.23%) Oracle EBS
8 9 (0.20%) Oracle Retail
9 5 (0.11%) Infor LN
9 5 (0.11%) Magento
9 5 (0.11%) Payment Gateway
9 5 (0.11%) Primavera
9 5 (0.11%) SAP HR
9 5 (0.11%) SAP MDG
10 4 (0.090%) Changepoint
10 4 (0.090%) Dynamics AX
10 4 (0.090%) Dynamics NAV
10 4 (0.090%) Oracle EBS R12
Cloud Services
1 295 (6.66%) Azure
2 204 (4.61%) Microsoft 365
3 157 (3.55%) SaaS
4 142 (3.21%) Power Platform
5 126 (2.85%) AWS
6 82 (1.85%) Azure DevOps
7 76 (1.72%) GitHub
8 43 (0.97%) Dynamics 365
9 34 (0.77%) Entra ID
10 33 (0.75%) Power Automate
11 32 (0.72%) IaaS
12 29 (0.65%) GCP
12 29 (0.65%) Slack
13 28 (0.63%) PaaS
13 28 (0.63%) PowerApps
13 28 (0.63%) Zapier
14 21 (0.47%) Cloud Computing
14 21 (0.47%) Mimecast
15 19 (0.43%) Smartsheet
16 17 (0.38%) GitHub Actions
Communications & Networking
1 36 (0.81%) Firewall
2 34 (0.77%) DNS
3 31 (0.70%) DHCP
4 29 (0.65%) TCP/IP
5 26 (0.59%) Network Security
6 25 (0.56%) WAN
7 23 (0.52%) VPN
8 17 (0.38%) Internet
8 17 (0.38%) Intranet
8 17 (0.38%) VLAN
9 15 (0.34%) VoIP
10 14 (0.32%) LAN
11 13 (0.29%) Wireless
12 11 (0.25%) Wi-Fi
13 10 (0.23%) DMZ
13 10 (0.23%) HTTP
13 10 (0.23%) VSAT
14 7 (0.16%) Ethernet
15 6 (0.14%) Intrusion Detection
15 6 (0.14%) Unified Communications
Database & Business Intelligence
1 165 (3.73%) SQL Server
2 83 (1.87%) Power BI
3 57 (1.29%) SQL Server Reporting Services
4 48 (1.08%) Azure SQL Database
5 42 (0.95%) MySQL
6 27 (0.61%) Big Data
7 25 (0.56%) Electronic Patient Records
8 24 (0.54%) DTS
9 22 (0.50%) Data Warehouse
10 15 (0.34%) Tableau
11 14 (0.32%) Relational Database
12 13 (0.29%) SQL Server Integration Services
13 9 (0.20%) PostgreSQL
14 8 (0.18%) BusinessObjects
14 8 (0.18%) Snowflake Schema
15 7 (0.16%) NoSQL
16 5 (0.11%) Crystal Reports
16 5 (0.11%) GIS
16 5 (0.11%) MS Access
16 5 (0.11%) Oracle Reports
Development Applications
1 209 (4.72%) JIRA
2 90 (2.03%) Git
3 70 (1.58%) Rational DOORS
4 36 (0.81%) Visual Studio
5 30 (0.68%) Bitbucket
6 15 (0.34%) SonarQube
7 11 (0.25%) GitLab
8 9 (0.20%) Jenkins
9 7 (0.16%) Cucumber
9 7 (0.16%) Cypress.io
10 6 (0.14%) Artifactory
11 5 (0.11%) LabVIEW
11 5 (0.11%) Rational Rhapsody
12 4 (0.090%) LSMW
12 4 (0.090%) Rational Statemate
12 4 (0.090%) Subversion
12 4 (0.090%) Visual Studio Code
13 2 (0.045%) JIRA Agile
13 2 (0.045%) Postman
13 2 (0.045%) Selenium
General
1 1,714 (38.71%) Social Skills
2 1,484 (33.51%) Finance
3 562 (12.69%) Analytical Skills
4 435 (9.82%) Manufacturing
5 248 (5.60%) Organisational Skills
6 207 (4.67%) Public Sector
7 205 (4.63%) Marketing
8 192 (4.34%) Legal
8 192 (4.34%) Retail
9 178 (4.02%) Inclusion and Diversity
10 141 (3.18%) Law
11 127 (2.87%) Influencing Skills
12 122 (2.76%) Electronics
13 121 (2.73%) Aerospace
14 118 (2.66%) Presentation Skills
15 96 (2.17%) Banking
16 91 (2.06%) Telecoms
17 47 (1.06%) Local Government
18 46 (1.04%) Military
19 41 (0.93%) Automotive
Job Titles
1 1,991 (44.96%) Project Manager
2 634 (14.32%) Senior
3 442 (9.98%) Senior Manager
4 380 (8.58%) Senior Project Manager
5 295 (6.66%) Lead
6 290 (6.55%) Analyst
7 221 (4.99%) IT Manager
8 214 (4.83%) Delivery Project Manager
9 176 (3.97%) Developer
10 122 (2.76%) IT Project Manager
11 108 (2.44%) Principal Engineer
12 107 (2.42%) Consultant
13 106 (2.39%) Product Manager
14 105 (2.37%) Development Manager
15 97 (2.19%) Delivery Manager
15 97 (2.19%) Systems Engineer
16 91 (2.06%) Junior
17 83 (1.87%) Technical Manager
18 76 (1.72%) Security Engineer
19 74 (1.67%) Audit Manager
Libraries, Frameworks & Software Standards
1 135 (3.05%) .NET
2 113 (2.55%) HTML
3 101 (2.28%) CSS
4 80 (1.81%) .NET Framework
5 65 (1.47%) React
6 59 (1.33%) ASP.NET
6 59 (1.33%) XML
7 50 (1.13%) .NET Core
8 49 (1.11%) HTML5
9 37 (0.84%) JSON
10 32 (0.72%) Entity Framework
11 29 (0.65%) CSS3
12 27 (0.61%) ASP.NET Core
12 27 (0.61%) Laravel
13 26 (0.59%) Sass
14 25 (0.56%) LESS
15 18 (0.41%) AngularJS
15 18 (0.41%) Razor View Engine
16 16 (0.36%) ARM Templates
17 15 (0.34%) Azure Blueprints
Miscellaneous
1 375 (8.47%) Driving Licence
2 339 (7.66%) Management Information System
3 133 (3.00%) FMCG
4 128 (2.89%) Self-Motivation
5 86 (1.94%) Onboarding
6 69 (1.56%) Product Ownership
7 53 (1.20%) Credit Risk
7 53 (1.20%) PMI
8 49 (1.11%) Renewable Energy
9 38 (0.86%) Analytical Mindset
9 38 (0.86%) Data Centre
10 35 (0.79%) Enterprise Software
10 35 (0.79%) Virtual Team
11 34 (0.77%) Mobile App
12 33 (0.75%) Life Science
13 31 (0.70%) Social Media
14 25 (0.56%) Legacy Systems
15 19 (0.43%) Algorithms
15 19 (0.43%) IoT
16 17 (0.38%) Embedded Systems
Operating Systems
1 189 (4.27%) Windows
2 94 (2.12%) Linux
3 85 (1.92%) Windows Server
4 24 (0.54%) Windows Vista
5 20 (0.45%) CentOS
6 14 (0.32%) Unix
7 11 (0.25%) Android
8 10 (0.23%) Apple iOS
9 9 (0.20%) Windows 10
10 7 (0.16%) Ubuntu
11 6 (0.14%) Windows Server 2016
11 6 (0.14%) Windows Server 2019
12 4 (0.090%) Mac OS
13 3 (0.068%) Mac OS X
14 2 (0.045%) AIX
14 2 (0.045%) Debian
14 2 (0.045%) Oracle Linux
14 2 (0.045%) SUSE
15 1 (0.023%) Solaris
15 1 (0.023%) Windows Server 2012
Processes & Methodologies
1 955 (21.57%) Project Delivery
2 864 (19.51%) Problem-Solving
3 718 (16.21%) Agile
4 713 (16.10%) Risk Management
5 694 (15.67%) Stakeholder Management
6 630 (14.23%) PRINCE2
7 501 (11.31%) Continuous Improvement
8 321 (7.25%) Business Case
9 312 (7.05%) Mentoring
10 294 (6.64%) Coaching
11 278 (6.28%) Change Management
12 267 (6.03%) Computer Science
13 266 (6.01%) Budget Management
14 255 (5.76%) ERP
15 238 (5.37%) ITIL
16 235 (5.31%) Cybersecurity
17 223 (5.04%) Decision-Making
18 215 (4.86%) Collaborative Working
19 210 (4.74%) CRM
20 206 (4.65%) Roadmaps
Programming Languages
1 248 (5.60%) SQL
2 139 (3.14%) Python
3 106 (2.39%) C#
4 100 (2.26%) JavaScript
5 85 (1.92%) Java
6 79 (1.78%) PHP
7 70 (1.58%) C
8 67 (1.51%) MATLAB
9 66 (1.49%) C++
10 65 (1.47%) PowerShell
11 34 (0.77%) TypeScript
12 33 (0.75%) T-SQL
13 32 (0.72%) Bash
14 27 (0.61%) Objective-C
15 18 (0.41%) VBA
16 13 (0.29%) VB
17 11 (0.25%) PL/SQL
17 11 (0.25%) Ruby
18 10 (0.23%) Go
19 9 (0.20%) Perl
Qualifications
1 1,357 (30.65%) Degree
2 344 (7.77%) BPSS Clearance
3 191 (4.31%) PMP
4 169 (3.82%) PMI Certification
5 168 (3.79%) Security Cleared
6 166 (3.75%) HNC
7 107 (2.42%) Computer Science Degree
8 94 (2.12%) CISSP
9 86 (1.94%) SC Cleared
10 79 (1.78%) CISM
11 68 (1.54%) CESG Certified Professional
12 65 (1.47%) DBS Check
13 64 (1.45%) PRINCE2 Certification
14 61 (1.38%) HND
15 56 (1.26%) Microsoft Certification
16 55 (1.24%) ACCA
17 50 (1.13%) MRICS
18 48 (1.08%) Master's Degree
19 43 (0.97%) APMP
20 33 (0.75%) PRINCE2 Practitioner
Quality Assurance & Compliance
1 296 (6.68%) QA
2 248 (5.60%) NEBOSH
3 230 (5.19%) PMO
4 124 (2.80%) ISO/IEC 27001
5 92 (2.08%) NIST
6 71 (1.60%) IFRS
7 68 (1.54%) JSP 440
7 68 (1.54%) RMADS
7 68 (1.54%) SLA
8 62 (1.40%) GAAP
9 44 (0.99%) Data Quality
9 44 (0.99%) GDPR
10 42 (0.95%) Accessibility
11 20 (0.45%) P3O
12 18 (0.41%) Cyber Essentials
13 16 (0.36%) Sarbanes-Oxley
14 15 (0.34%) NCSC
15 13 (0.29%) Cyber Essentials PLUS
16 12 (0.27%) ISO 9001
17 11 (0.25%) PCI DSS
System Software
1 89 (2.01%) Active Directory
2 47 (1.06%) Hyper-V
3 40 (0.90%) VMware Infrastructure
4 35 (0.79%) Docker
5 13 (0.29%) Firmware
6 11 (0.25%) vSphere
7 7 (0.16%) Virtual Desktop
8 6 (0.14%) Embedded Firmware
8 6 (0.14%) pfSense
8 6 (0.14%) Virtual Machines
9 3 (0.068%) DFS Replication
9 3 (0.068%) Terminal Server
9 3 (0.068%) VMware ESXi
10 2 (0.045%) KVM
10 2 (0.045%) Postfix
10 2 (0.045%) Sendmail
10 2 (0.045%) Virtual Servers
11 1 (0.023%) Microsoft Virtual Server
Systems Management
1 41 (0.93%) Kubernetes
2 38 (0.86%) Terraform
3 32 (0.72%) Ansible
4 29 (0.65%) Microsoft Intune
5 12 (0.27%) Single Sign-On
6 11 (0.25%) Autotask
7 9 (0.20%) Puppet
8 8 (0.18%) SCCM
9 6 (0.14%) Argo
9 6 (0.14%) Grafana
10 5 (0.11%) Nagios
11 4 (0.090%) ZABBIX
12 3 (0.068%) EMC NetWorker
12 3 (0.068%) FortiGate
12 3 (0.068%) vCenter Server
13 2 (0.045%) Nessus
13 2 (0.045%) WSUS
14 1 (0.023%) BMC PATROL
14 1 (0.023%) Jamf Pro
14 1 (0.023%) PaperCut
Vendors
1 762 (17.21%) Microsoft
2 158 (3.57%) SAP
3 121 (2.73%) NEC
4 86 (1.94%) IBM
5 66 (1.49%) Oracle
6 50 (1.13%) VMware
7 43 (0.97%) Cisco
8 38 (0.86%) Google
9 34 (0.77%) Salesforce
10 33 (0.75%) WooCommerce
11 27 (0.61%) Xamarin
12 26 (0.59%) Atlassian
13 20 (0.45%) ServiceNow
14 19 (0.43%) Meraki
14 19 (0.43%) Progress
14 19 (0.43%) SolarWinds
14 19 (0.43%) Veeam
15 17 (0.38%) Siemens
16 15 (0.34%) Splunk
17 14 (0.32%) Epicor