Continuous Improvement Jobs in the UK excluding London

Continual Improvement
UK > UK excluding London

The table below provides summary statistics for permanent job vacancies advertised in the UK excluding London requiring Continuous Improvement skills. It includes a benchmarking guide to the annual salaries offered in vacancies that cited Continuous Improvement over the 6 months leading up to 17 June 2025, comparing them to the same period in the previous two years.

6 months to
17 Jun 2025
Same period 2024 Same period 2023
Rank 20 29 63
Rank change year-on-year +9 +34 -18
Permanent jobs citing Continuous Improvement 3,204 4,672 2,683
As % of all permanent jobs advertised in the UK excluding London 8.05% 5.76% 4.91%
As % of the Processes & Methodologies category 8.82% 7.16% 5.14%
Number of salaries quoted 1,493 2,340 1,597
10th Percentile £30,000 £31,250 £30,500
25th Percentile £37,574 £40,000 £37,250
Median annual salary (50th Percentile) £51,887 £52,500 £52,991
Median % change year-on-year -1.17% -0.93% -3.65%
75th Percentile £70,641 £67,500 £68,750
90th Percentile £85,000 £82,500 £84,056
UK median annual salary £56,000 £57,500 £60,000
% change year-on-year -2.61% -4.17% -

All Process and Methodology Skills
UK excluding London

Continuous Improvement falls under the Processes and Methodologies category. For comparison with the information above, the following table provides summary statistics for all permanent job vacancies requiring process or methodology skills in the UK excluding London.

Permanent vacancies with a requirement for process or methodology skills 36,338 65,258 52,150
As % of all permanent jobs advertised in the UK excluding London 91.30% 80.42% 95.51%
Number of salaries quoted 17,737 44,090 28,180
10th Percentile £25,950 £27,500 £30,500
25th Percentile £35,000 £36,250 £40,000
Median annual salary (50th Percentile) £50,055 £50,000 £55,000
Median % change year-on-year +0.11% -9.09% +4.76%
75th Percentile £65,000 £65,000 £70,000
90th Percentile £77,500 £77,500 £81,250
UK median annual salary £55,000 £55,000 £60,800
% change year-on-year - -9.54% +1.33%

Continuous Improvement
Job Vacancy Trend in the UK excluding London

Job postings citing Continuous Improvement as a proportion of all IT jobs advertised in the UK excluding London.
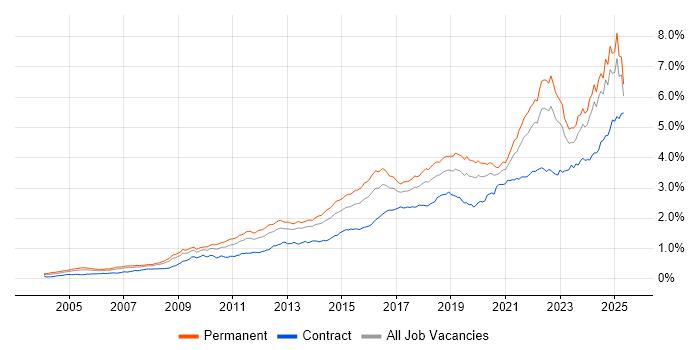
Job vacancy trend for Continuous Improvement in the UK excluding London

Continuous Improvement
Salary Trend in the UK excluding London

3-month moving average salary quoted in jobs citing Continuous Improvement in the UK excluding London.

Salary trend for Continuous Improvement in the UK excluding London

Continuous Improvement
Salary Histogram in the UK excluding London

Salary distribution for jobs citing Continuous Improvement in the UK excluding London over the 6 months to 17 June 2025.

Salary histogram for Continuous Improvement in the UK excluding London

Continuous Improvement
Job Locations in the UK excluding London

The table below looks at the demand and provides a guide to the median salaries quoted in IT jobs citing Continuous Improvement within the UK excluding London region over the 6 months to 17 June 2025. The 'Rank Change' column provides an indication of the change in demand within each location based on the same 6 month period last year.

Location Rank Change
on Same Period
Last Year
Matching
Permanent
IT Job Ads
Median Salary
Past 6 Months
Median Salary
% Change
on Same Period
Last Year
Live
Jobs
North of England +5 970 £51,564 -1.78% 5,230
South East +34 927 £55,000 +4.76% 5,317
Yorkshire +26 478 £55,000 -8.33% 2,004
North West -11 448 £51,564 +0.96% 2,761
Midlands -14 390 £45,000 -14.29% 3,649
Scotland -5 302 £50,445 -6.58% 1,391
South West +13 260 £55,485 +5.90% 2,397
East of England +12 246 £42,500 -22.73% 2,875
West Midlands -24 220 £50,000 -6.54% 2,086
East Midlands -5 166 £40,000 -15.79% 1,546
Wales -2 73 £60,000 +14.29% 674
North East -6 44 £51,000 +13.33% 481
Northern Ireland +32 43 £87,500 +45.83% 406
Channel Islands - 4 £80,000 -
South Coast - 1 £59,000 -
Continuous Improvement
UK

Continuous Improvement
Co-occurring Skills and Capabilities in the UK excluding London by Category

The follow tables expand on the table above by listing co-occurrences grouped by category. The same employment type, locality and period is covered with up to 20 co-occurrences shown in each of the following categories:

Application Platforms
1 182 (5.68%) Confluence
2 75 (2.34%) SharePoint
3 44 (1.37%) Microsoft Exchange
4 16 (0.50%) Apache Spark
5 15 (0.47%) Apache
5 15 (0.47%) Appian
6 14 (0.44%) CMS
7 11 (0.34%) IIS
7 11 (0.34%) OpenEdge
8 8 (0.25%) nginx
8 8 (0.25%) Oracle Workflow
9 7 (0.22%) WordPress
10 6 (0.19%) Apache Solr
11 4 (0.12%) Camunda
11 4 (0.12%) SAS
11 4 (0.12%) Tomcat
12 2 (0.062%) Adobe Experience Manager
12 2 (0.062%) ArcGIS
12 2 (0.062%) BizTalk Server
12 2 (0.062%) MTS
Applications
1 139 (4.34%) Simulink
2 129 (4.03%) Microsoft Excel
3 99 (3.09%) Microsoft Office
4 34 (1.06%) Microsoft Project
5 25 (0.78%) Microsoft PowerPoint
6 20 (0.62%) Trello
7 8 (0.25%) MS Visio
7 8 (0.25%) Spreadsheet
8 7 (0.22%) AutoCAD
9 3 (0.094%) Acrobat
9 3 (0.094%) Chatbot
9 3 (0.094%) Photoshop
10 2 (0.062%) Adobe Captivate
10 2 (0.062%) Productboard
11 1 (0.031%) MicroStation
11 1 (0.031%) Oracle Smart View
Business Applications
1 138 (4.31%) Teamcenter
2 33 (1.03%) SAP S/4HANA
3 21 (0.66%) Dynamics CRM
4 12 (0.37%) Oracle EBS
5 11 (0.34%) Oracle ERP
6 9 (0.28%) NetSuite
7 8 (0.25%) SAP WM
8 7 (0.22%) Remedy ITSM
9 6 (0.19%) Infor CloudSuite
9 6 (0.19%) Infor CloudSuite Industrial (formerly SyteLine)
9 6 (0.19%) SAP EWM
10 4 (0.12%) Dynamics AX
10 4 (0.12%) Maximo
10 4 (0.12%) SAP BPC
11 3 (0.094%) Infor M3
11 3 (0.094%) Primavera
11 3 (0.094%) Sage 200
11 3 (0.094%) Sage X3
11 3 (0.094%) SAP GRC
11 3 (0.094%) Unit4 Business World
Cloud Services
1 508 (15.86%) Azure
2 407 (12.70%) AWS
3 225 (7.02%) GCP
4 176 (5.49%) Microsoft 365
5 113 (3.53%) SaaS
6 89 (2.78%) Power Platform
7 56 (1.75%) Entra ID
8 50 (1.56%) Serverless
9 42 (1.31%) AWS Lambda
10 39 (1.22%) Dynamics 365
11 38 (1.19%) Cloud Computing
12 37 (1.15%) Azure DevOps
13 35 (1.09%) OCI
14 31 (0.97%) GitHub
14 31 (0.97%) Power Automate
15 29 (0.91%) PowerApps
16 22 (0.69%) Salesforce Sales Cloud
17 20 (0.62%) Amazon CloudWatch
18 19 (0.59%) Boomi
18 19 (0.59%) OneDrive
Communications & Networking
1 104 (3.25%) Firewall
2 50 (1.56%) WAN
3 45 (1.40%) VPN
4 41 (1.28%) LAN
4 41 (1.28%) Network Security
5 33 (1.03%) TCP/IP
6 30 (0.94%) VLAN
7 28 (0.87%) SD-WAN
8 26 (0.81%) Internet
9 21 (0.66%) Intrusion Detection
10 19 (0.59%) DNS
10 19 (0.59%) Wi-Fi
11 17 (0.53%) SAN
12 16 (0.50%) OSPF
13 14 (0.44%) BGP
14 13 (0.41%) Wireless
15 12 (0.37%) MPLS
16 11 (0.34%) NAS
17 10 (0.31%) Intranet
18 9 (0.28%) DHCP
Database & Business Intelligence
1 250 (7.80%) SQL Server
2 71 (2.22%) Power BI
3 60 (1.87%) MySQL
4 48 (1.50%) NoSQL
5 37 (1.15%) Big Data
6 25 (0.78%) Data Warehouse
7 24 (0.75%) Metadata
8 23 (0.72%) PostgreSQL
8 23 (0.72%) Relational Database
9 22 (0.69%) MongoDB
10 20 (0.62%) Data Lake
10 20 (0.62%) Tableau
11 19 (0.59%) Oracle Reports
12 13 (0.41%) Apache Cassandra
13 12 (0.37%) Amazon Athena
13 12 (0.37%) SQL Server Reporting Services
14 11 (0.34%) Azure SQL Database
15 10 (0.31%) Data Hub
16 9 (0.28%) Elasticsearch
16 9 (0.28%) RDBMS
Development Applications
1 275 (8.58%) JIRA
2 176 (5.49%) GitLab
3 164 (5.12%) Selenium
4 161 (5.02%) Maven
5 159 (4.96%) Rational DOORS
6 157 (4.90%) Cucumber
6 157 (4.90%) Sonatype Nexus
7 156 (4.87%) Bitbucket
7 156 (4.87%) SonarQube
8 33 (1.03%) Git
9 16 (0.50%) Jenkins
10 15 (0.47%) JUnit
11 11 (0.34%) Cypress.io
11 11 (0.34%) webpack
12 8 (0.25%) Vite
13 6 (0.19%) Oracle Forms
14 5 (0.16%) Octopus Deploy
14 5 (0.16%) TeamCity
15 3 (0.094%) Karma Test Runner
15 3 (0.094%) SQL Server Management Studio (SSMS)
General
1 1,552 (48.44%) Social Skills
2 1,134 (35.39%) Finance
3 467 (14.58%) Manufacturing
4 449 (14.01%) Marketing
5 401 (12.52%) Electronics
6 397 (12.39%) Analytical Skills
7 370 (11.55%) Inclusion and Diversity
8 297 (9.27%) Banking
9 258 (8.05%) Presentation Skills
10 256 (7.99%) Law
11 170 (5.31%) Aerospace
12 155 (4.84%) Legal
13 116 (3.62%) Public Sector
14 105 (3.28%) Retail
15 87 (2.72%) Organisational Skills
16 37 (1.15%) Advertising
16 37 (1.15%) Automotive
17 35 (1.09%) Local Government
18 29 (0.91%) Telecoms
19 24 (0.75%) Back Office
Job Titles
1 333 (10.39%) Lead
2 277 (8.65%) Software Engineer
3 248 (7.74%) Analyst
4 242 (7.55%) Systems Engineer
5 222 (6.93%) Systems Manager
6 213 (6.65%) Resource Manager
7 212 (6.62%) Senior
8 190 (5.93%) Developer
9 171 (5.34%) Architect
10 160 (4.99%) Junior
10 160 (4.99%) Technical Manager
11 141 (4.40%) Help Desk Manager
12 138 (4.31%) Junior Systems Engineer
13 121 (3.78%) Product Manager
14 101 (3.15%) Products Support Manager
15 100 (3.12%) Support Manager
16 95 (2.97%) Software Architect
17 87 (2.72%) Automation Engineer
17 87 (2.72%) Support Engineer
18 70 (2.18%) Senior Manager
Libraries, Frameworks & Software Standards
1 245 (7.65%) React
2 237 (7.40%) CSS
3 219 (6.84%) Spring
4 205 (6.40%) HTML
5 203 (6.34%) Spring Boot
6 197 (6.15%) Kafka
7 172 (5.37%) Hibernate
8 165 (5.15%) Redux
9 163 (5.09%) JPA
10 133 (4.15%) .NET
11 129 (4.03%) Middleware
12 58 (1.81%) REST
13 45 (1.40%) AngularJS
14 44 (1.37%) ASP.NET
15 37 (1.15%) jQuery
16 36 (1.12%) RESTful
17 33 (1.03%) SOAP
18 28 (0.87%) .NET Core
18 28 (0.87%) Web Services
19 23 (0.72%) Lightning Web Components
Miscellaneous
1 297 (9.27%) Product Ownership
2 219 (6.84%) Management Information System
3 191 (5.96%) Enterprise Software
4 110 (3.43%) FMCG
5 97 (3.03%) Algorithms
6 84 (2.62%) Operational Technology
7 77 (2.40%) Driving Licence
8 73 (2.28%) Manufacturing Execution System
9 63 (1.97%) Self-Motivation
10 59 (1.84%) Social Media
11 56 (1.75%) Onboarding
12 55 (1.72%) Data Centre
13 43 (1.34%) e-Learning
14 39 (1.22%) Cloud Native
15 33 (1.03%) Public Cloud
16 32 (1.00%) Hybrid Cloud
17 31 (0.97%) Data Protection Act
18 30 (0.94%) Team-Oriented Environment
19 29 (0.91%) Distributed Systems
20 25 (0.78%) Private Cloud
Operating Systems
1 199 (6.21%) Windows
2 56 (1.75%) Linux
3 43 (1.34%) Windows Server
4 31 (0.97%) Windows 10
5 25 (0.78%) Windows Vista
6 20 (0.62%) Mac OS
7 9 (0.28%) Apple iOS
8 8 (0.25%) Android
9 7 (0.22%) Windows Server 2019
10 6 (0.19%) Windows Server 2016
11 5 (0.16%) CentOS
11 5 (0.16%) Rocky
11 5 (0.16%) Ubuntu
12 1 (0.031%) AIX
12 1 (0.031%) VMS
12 1 (0.031%) Windows Server 2012
Processes & Methodologies
1 942 (29.40%) Agile
2 897 (28.00%) Problem-Solving
3 482 (15.04%) DevOps
3 482 (15.04%) Project Management
4 433 (13.51%) Analytics
5 428 (13.36%) Computer Science
6 420 (13.11%) SDLC
7 406 (12.67%) CI/CD
8 401 (12.52%) Mathematics
9 389 (12.14%) Mentoring
10 381 (11.89%) Software Engineering
11 377 (11.77%) Physics
12 366 (11.42%) ERP
13 358 (11.17%) Data Management
14 326 (10.17%) Stakeholder Management
15 302 (9.43%) Decision-Making
16 265 (8.27%) Change Management
16 265 (8.27%) ITIL
17 263 (8.21%) Coaching
18 258 (8.05%) UML
Programming Languages
1 379 (11.83%) SQL
2 351 (10.96%) Java
3 266 (8.30%) JavaScript
4 146 (4.56%) C#
5 140 (4.37%) MATLAB
6 126 (3.93%) Python
7 55 (1.72%) TypeScript
8 53 (1.65%) C++
9 47 (1.47%) PHP
10 36 (1.12%) PowerShell
11 32 (1.00%) C
12 22 (0.69%) Apex Code
13 16 (0.50%) R
14 15 (0.47%) Progress 4GL
15 14 (0.44%) Ada
16 12 (0.37%) PL/SQL
16 12 (0.37%) VBA
17 10 (0.31%) Embedded C
18 8 (0.25%) Shell Script
18 8 (0.25%) VB
Qualifications
1 1,078 (33.65%) Degree
2 366 (11.42%) BPSS Clearance
3 229 (7.15%) Computer Science Degree
4 130 (4.06%) Security Cleared
5 117 (3.65%) Chartered Engineer
6 97 (3.03%) HNC
7 86 (2.68%) DBS Check
8 84 (2.62%) Master's Degree
9 77 (2.40%) CISSP
10 75 (2.34%) SC Cleared
11 59 (1.84%) PMI Certification
12 55 (1.72%) CISM
13 43 (1.34%) PMP
14 39 (1.22%) CRISC
15 36 (1.12%) Microsoft Certification
16 31 (0.97%) Six Sigma Green Belt
17 30 (0.94%) Six Sigma Black Belt
18 28 (0.87%) Cisco Certification
19 27 (0.84%) ACCA
19 27 (0.84%) DV Cleared
Quality Assurance & Compliance
1 264 (8.24%) QA
2 106 (3.31%) SLA
3 104 (3.25%) Data Quality
4 95 (2.97%) ISO/IEC 12207
5 78 (2.43%) ISO/IEC 27001
6 65 (2.03%) GDPR
7 51 (1.59%) Accessibility
8 44 (1.37%) NIST
9 42 (1.31%) ISO 9001
10 38 (1.19%) Sarbanes-Oxley
11 29 (0.91%) COBIT
12 28 (0.87%) Actionable Recommendations
13 26 (0.81%) PCI DSS
14 24 (0.75%) SOC 2
15 23 (0.72%) PMO
16 15 (0.47%) GMP
16 15 (0.47%) NCSC
17 12 (0.37%) GRC
18 11 (0.34%) ITGC
19 10 (0.31%) GLP
System Software
1 212 (6.62%) Docker
2 92 (2.87%) Active Directory
3 51 (1.59%) VMware Infrastructure
4 23 (0.72%) Virtual Machines
5 16 (0.50%) Firmware
6 12 (0.37%) Hyper-V
7 11 (0.34%) Virtual Desktop
8 4 (0.12%) Embedded Firmware
9 2 (0.062%) VMware ESXi
10 1 (0.031%) Snort
Systems Management
1 229 (7.15%) Kubernetes
2 48 (1.50%) Terraform
3 34 (1.06%) Ansible
4 32 (1.00%) Microsoft Intune
5 24 (0.75%) Grafana
6 20 (0.62%) Prometheus
7 7 (0.22%) SCCM
8 6 (0.19%) FortiGate
9 4 (0.12%) Puppet
9 4 (0.12%) QRadar
10 3 (0.094%) Progress Chef
11 2 (0.062%) Kibana
11 2 (0.062%) Nessus
11 2 (0.062%) NetBackup
11 2 (0.062%) RSA Archer
11 2 (0.062%) Salt
11 2 (0.062%) vCenter Server
12 1 (0.031%) CASB
12 1 (0.031%) Computer Emergency Response Teams
12 1 (0.031%) Jamf Pro
Vendors
1 442 (13.80%) Microsoft
2 195 (6.09%) IBM
3 156 (4.87%) Solace
4 133 (4.15%) Oracle
5 117 (3.65%) SAP
6 87 (2.72%) Salesforce
7 67 (2.09%) Cisco
7 67 (2.09%) Rockwell
7 67 (2.09%) Siemens
8 65 (2.03%) ServiceNow
9 62 (1.94%) Google
9 62 (1.94%) VMware
10 29 (0.91%) Sun
11 24 (0.75%) Databricks
11 24 (0.75%) Red Hat
11 24 (0.75%) Salesforce Marketing Cloud
12 21 (0.66%) Qualys
13 19 (0.59%) Facebook
13 19 (0.59%) Splunk
14 18 (0.56%) MuleSoft