Junior Jobs in the UK excluding London

Junior
UK > UK excluding London

The median Junior salary in the UK excluding London is £40,101 per year, according to job vacancies posted during the 6 months leading to 31 May 2025.

The table below provides salary benchmarking and summary statistics, comparing them to the same period in the previous two years.

6 months to
31 May 2025
Same period 2024 Same period 2023
Rank 230 179 261
Rank change year-on-year -51 +82 -58
Permanent jobs requiring a Junior 511 1,128 786
As % of all permanent jobs advertised in the UK excluding London 1.29% 1.51% 1.37%
As % of the Job Titles category 1.43% 1.59% 1.54%
Number of salaries quoted 405 914 553
10th Percentile £24,850 £22,500 £22,750
25th Percentile £28,000 £24,000 £26,250
Median annual salary (50th Percentile) £40,101 £30,000 £33,624
Median % change year-on-year +33.67% -10.78% +3.46%
75th Percentile £42,627 £35,000 £41,000
90th Percentile £50,000 £43,750 £48,750
UK median annual salary £40,101 £30,000 £35,000
% change year-on-year +33.67% -14.29% -

All Permanent IT Job Vacancies
UK excluding London

For comparison with the information above, the following table provides summary statistics for all permanent IT job vacancies in the UK excluding London. Most job vacancies include a discernible job title that can be normalized. As such, the figures in the second row provide an indication of the number of permanent jobs in our overall sample.

Permanent vacancies in the UK excluding London with a recognized job title 35,806 71,101 51,023
% of permanent jobs with a recognized job title 90.22% 94.94% 89.01%
Number of salaries quoted 18,138 50,103 29,550
10th Percentile £26,250 £26,750 £29,750
25th Percentile £36,750 £35,000 £38,750
Median annual salary (50th Percentile) £51,000 £50,000 £53,500
Median % change year-on-year +2.00% -6.54% +6.49%
75th Percentile £65,000 £63,750 £68,750
90th Percentile £77,500 £76,250 £81,250
UK median annual salary £55,000 £52,500 £60,000
% change year-on-year +4.76% -12.50% -

Junior
Job Vacancy Trend in the UK excluding London

Job postings that featured Junior in the job title as a proportion of all IT jobs advertised in the UK excluding London.
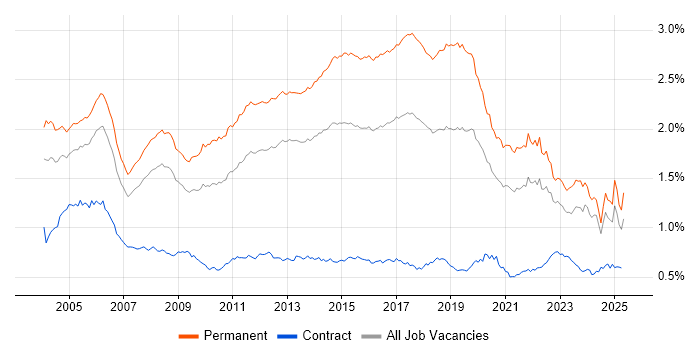
Job vacancy trend for Junior in the UK excluding London

Junior
Salary Trend in the UK excluding London

3-month moving average salary quoted in jobs citing Junior in the UK excluding London.

Salary trend for Junior in the UK excluding London

Junior
Salary Histogram in the UK excluding London

Salary distribution for jobs citing Junior in the UK excluding London over the 6 months to 31 May 2025.

Salary histogram for Junior in the UK excluding London

Junior
Job Locations in the UK excluding London

The table below looks at the demand and provides a guide to the median salaries quoted in IT jobs citing Junior within the UK excluding London region over the 6 months to 31 May 2025. The 'Rank Change' column provides an indication of the change in demand within each location based on the same 6 month period last year.

Location Rank Change
on Same Period
Last Year
Matching
Permanent
IT Job Ads
Median Salary
Past 6 Months
Median Salary
% Change
on Same Period
Last Year
Live
Jobs
South East -38 143 £33,500 +11.67% 105
North of England -70 103 £40,101 +43.22% 130
South West +53 74 £35,000 +16.67% 40
East of England +20 72 £32,500 +15.04% 43
North West -86 60 £45,000 +63.64% 74
Midlands -58 56 £35,000 +29.63% 80
Scotland +92 51 £40,101 +33.67% 28
Yorkshire +21 38 £40,050 +33.50% 34
East Midlands +12 37 £36,000 +35.85% 35
West Midlands -43 19 £32,500 +20.37% 44
Wales +29 12 £40,101 +23.39% 8
North East +40 5 £28,500 +3.64% 23
Junior
UK

Junior Skill Set
Top 30 Co-occurring Skills and Capabilities in the UK excluding London

For the 6 months to 31 May 2025, Junior job roles required the following skills and capabilities in order of popularity. The figures indicate the absolute number co-occurrences and as a proportion of all permanent job ads across the UK excluding London region featuring Junior in the job title.

1 278 (54.40%) Social Skills
2 237 (46.38%) Degree
3 213 (41.68%) Problem-Solving
4 173 (33.86%) Computer Science
5 171 (33.46%) Mathematics
5 171 (33.46%) Physics
6 160 (31.31%) BPSS Clearance
6 160 (31.31%) UML
7 157 (30.72%) Project Management
8 155 (30.33%) Continuous Improvement
9 148 (28.96%) Electronics
10 140 (27.40%) PLM
10 140 (27.40%) Creative Problem-Solving
11 138 (27.01%) Model-Based Systems Engineering
11 138 (27.01%) Systems Engineering
11 138 (27.01%) Teamcenter
11 138 (27.01%) Aerospace
11 138 (27.01%) SysML
11 138 (27.01%) MATLAB
11 138 (27.01%) Simulink
11 138 (27.01%) IBM
11 138 (27.01%) Rational DOORS
12 77 (15.07%) Microsoft
12 77 (15.07%) SQL
13 66 (12.92%) HTML
14 65 (12.72%) JavaScript
15 64 (12.52%) CSS
16 60 (11.74%) Software Engineering
17 55 (10.76%) Java
18 54 (10.57%) C#

Junior Skill Set
Co-occurring Skills and Capabilities in the UK excluding London by Category

The follow tables expand on the table above by listing co-occurrences grouped by category. The same employment type, locality and period is covered with up to 20 co-occurrences shown in each of the following categories:

Application Platforms
1 22 (4.31%) Apache
2 6 (1.17%) Confluence
3 4 (0.78%) Microsoft Exchange
4 2 (0.39%) Apache Spark
4 2 (0.39%) CMS
4 2 (0.39%) SharePoint
5 1 (0.20%) IIS
5 1 (0.20%) Moodle
5 1 (0.20%) NServiceBus
5 1 (0.20%) Totara
5 1 (0.20%) Umbraco
5 1 (0.20%) WordPress
Applications
1 138 (27.01%) Simulink
2 38 (7.44%) Microsoft Excel
3 37 (7.24%) Microsoft Office
4 18 (3.52%) Microsoft PowerPoint
5 4 (0.78%) Adobe XD
6 3 (0.59%) Photoshop
6 3 (0.59%) Sketch
7 1 (0.20%) Adobe Creative Suite
7 1 (0.20%) Adobe Illustrator
7 1 (0.20%) Chatbot
7 1 (0.20%) Elementor
7 1 (0.20%) InDesign
7 1 (0.20%) MS Visio
7 1 (0.20%) Spreadsheet
Business Applications
1 138 (27.01%) Teamcenter
2 3 (0.59%) Shopify
3 1 (0.20%) SAP Business One
Cloud Services
1 46 (9.00%) Azure
2 35 (6.85%) AWS
3 28 (5.48%) Power Platform
4 27 (5.28%) Microsoft 365
5 12 (2.35%) SaaS
6 5 (0.98%) Figma
7 3 (0.59%) Nutanix
8 2 (0.39%) Asana
8 2 (0.39%) AWS CloudFormation
8 2 (0.39%) AWS IoT
8 2 (0.39%) Entra ID
8 2 (0.39%) GCP
9 1 (0.20%) Amazon EC2
9 1 (0.20%) Boomi
9 1 (0.20%) Cloud Computing
9 1 (0.20%) GitHub
9 1 (0.20%) iPaaS
9 1 (0.20%) Mimecast
9 1 (0.20%) PaaS
9 1 (0.20%) Sage Pay
Communications & Networking
1 32 (6.26%) Firewall
1 32 (6.26%) WAN
2 26 (5.09%) LAN
3 12 (2.35%) TCP/IP
4 10 (1.96%) DNS
4 10 (1.96%) VPN
5 6 (1.17%) MPLS
6 5 (0.98%) Unified Communications
7 4 (0.78%) DHCP
7 4 (0.78%) Internet
7 4 (0.78%) Network Security
7 4 (0.78%) VLAN
7 4 (0.78%) Wireless
8 3 (0.59%) VoIP
8 3 (0.59%) Wi-Fi
9 2 (0.39%) Broadband
9 2 (0.39%) LoRaWAN
10 1 (0.20%) HTTP
10 1 (0.20%) PBX
10 1 (0.20%) SSL
Database & Business Intelligence
1 28 (5.48%) Power BI
2 21 (4.11%) MySQL
3 19 (3.72%) Data Mining
4 18 (3.52%) BusinessObjects
5 11 (2.15%) SQL Server
6 7 (1.37%) Big Data
7 5 (0.98%) NoSQL
8 4 (0.78%) MongoDB
9 2 (0.39%) Elasticsearch
9 2 (0.39%) PostgreSQL
9 2 (0.39%) Tableau
9 2 (0.39%) TimescaleDB
10 1 (0.20%) Apache Cassandra
10 1 (0.20%) FileMaker
10 1 (0.20%) Metadata
10 1 (0.20%) Power Query
10 1 (0.20%) PowerPivot
10 1 (0.20%) Redis
10 1 (0.20%) Relational Database
10 1 (0.20%) Scylla
Development Applications
1 138 (27.01%) Rational DOORS
2 27 (5.28%) Git
3 22 (4.31%) Eclipse
3 22 (4.31%) Eclipse RCP
4 13 (2.54%) JIRA
5 3 (0.59%) JUnit
6 2 (0.39%) GitLab
6 2 (0.39%) Postman
6 2 (0.39%) Vite
6 2 (0.39%) webpack
7 1 (0.20%) Bitbucket
7 1 (0.20%) Burp Suite
7 1 (0.20%) Cypress.io
7 1 (0.20%) Fiddler
7 1 (0.20%) IDA Disassembler
7 1 (0.20%) Jenkins
7 1 (0.20%) Metasploit
7 1 (0.20%) NUnit
7 1 (0.20%) Visual Studio
7 1 (0.20%) YouTrack
General
1 278 (54.40%) Social Skills
2 148 (28.96%) Electronics
3 138 (27.01%) Aerospace
4 43 (8.41%) Analytical Skills
5 35 (6.85%) Retail
6 25 (4.89%) Presentation Skills
7 20 (3.91%) Finance
8 18 (3.52%) Law
9 16 (3.13%) Organisational Skills
10 13 (2.54%) Marketing
11 6 (1.17%) Telecoms
12 5 (0.98%) Inclusion and Diversity
12 5 (0.98%) Legal
13 4 (0.78%) Automotive
13 4 (0.78%) Manufacturing
14 3 (0.59%) Games
15 2 (0.39%) Advertising
15 2 (0.39%) Aviation
15 2 (0.39%) Cantonese Language
15 2 (0.39%) Mandarin Language
Libraries, Frameworks & Software Standards
1 66 (12.92%) HTML
2 64 (12.52%) CSS
3 27 (5.28%) Node.js
4 23 (4.50%) Middleware
5 22 (4.31%) JSP
6 20 (3.91%) .NET
7 19 (3.72%) RESTful
8 18 (3.52%) React
9 14 (2.74%) Laravel
10 13 (2.54%) REST
11 9 (1.76%) CakePHP
11 9 (1.76%) Web Services
12 8 (1.57%) .NET Framework
13 7 (1.37%) LAMP
14 6 (1.17%) AngularJS
14 6 (1.17%) ASP.NET
15 5 (0.98%) HTML5
15 5 (0.98%) J2EE
15 5 (0.98%) jQuery
15 5 (0.98%) SOAP
Miscellaneous
1 21 (4.11%) Driving Licence
2 20 (3.91%) Data Structures
3 11 (2.15%) Self-Motivation
4 9 (1.76%) Embedded Systems
5 6 (1.17%) Mobile App
5 6 (1.17%) Private Cloud
5 6 (1.17%) Renewable Energy
6 5 (0.98%) Legacy Systems
6 5 (0.98%) Onboarding
6 5 (0.98%) Product Ownership
7 4 (0.78%) Analytical Mindset
7 4 (0.78%) Video Editing
8 3 (0.59%) Animation
8 3 (0.59%) Data Centre
8 3 (0.59%) IoT
9 2 (0.39%) Management Information System
9 2 (0.39%) NHS
9 2 (0.39%) Robotics
9 2 (0.39%) Social Media
9 2 (0.39%) Tandem
Operating Systems
1 49 (9.59%) Windows
2 48 (9.39%) Linux
3 9 (1.76%) Windows Server
4 4 (0.78%) Mac OS
4 4 (0.78%) SUSE
4 4 (0.78%) SUSE Linux Enterprise Server
5 2 (0.39%) Android
5 2 (0.39%) VMS
5 2 (0.39%) Windows 10
6 1 (0.20%) Apple iOS
6 1 (0.20%) Rocky
6 1 (0.20%) Windows 7
6 1 (0.20%) Windows 8
Processes & Methodologies
1 213 (41.68%) Problem-Solving
2 173 (33.86%) Computer Science
3 171 (33.46%) Mathematics
3 171 (33.46%) Physics
4 160 (31.31%) UML
5 157 (30.72%) Project Management
6 155 (30.33%) Continuous Improvement
7 140 (27.40%) Creative Problem-Solving
7 140 (27.40%) PLM
8 138 (27.01%) Model-Based Systems Engineering
8 138 (27.01%) SysML
8 138 (27.01%) Systems Engineering
9 60 (11.74%) Software Engineering
10 51 (9.98%) Customer Experience
11 50 (9.78%) Customer Service
11 50 (9.78%) Mentoring
12 34 (6.65%) Agile
13 32 (6.26%) Business Intelligence
14 31 (6.07%) Analytics
14 31 (6.07%) SDLC
Programming Languages
1 138 (27.01%) MATLAB
2 77 (15.07%) SQL
3 65 (12.72%) JavaScript
4 55 (10.76%) Java
5 54 (10.57%) C#
6 53 (10.37%) Python
7 31 (6.07%) PHP
8 22 (4.31%) Ada
8 22 (4.31%) Rust
9 20 (3.91%) TypeScript
10 18 (3.52%) VBA
11 15 (2.94%) C
12 12 (2.35%) C++
13 7 (1.37%) Bash
14 3 (0.59%) Clojure
14 3 (0.59%) Groovy
15 2 (0.39%) Shell Script
16 1 (0.20%) Embedded C
16 1 (0.20%) R
16 1 (0.20%) T-SQL
Qualifications
1 237 (46.38%) Degree
2 160 (31.31%) BPSS Clearance
3 27 (5.28%) CCNA
3 27 (5.28%) Cisco Certification
4 26 (5.09%) JNCIA
5 22 (4.31%) Computer Science Degree
6 15 (2.94%) Security Cleared
7 8 (1.57%) SC Cleared
8 5 (0.98%) A+ Certification
8 5 (0.98%) Network+ Certification
9 4 (0.78%) ISTQB
10 2 (0.39%) CompTIA Security+
10 2 (0.39%) DBS Check
10 2 (0.39%) ISTQB Foundation Certification
10 2 (0.39%) Microsoft Certification
11 1 (0.20%) AWS Certification
11 1 (0.20%) CISSP
11 1 (0.20%) DV Cleared
11 1 (0.20%) NVQ Level 3
11 1 (0.20%) OSCP
Quality Assurance & Compliance
1 9 (1.76%) Accessibility
2 8 (1.57%) QA
3 3 (0.59%) Data Quality
3 3 (0.59%) SLA
4 1 (0.20%) ISO 13485
4 1 (0.20%) ISO 9001
4 1 (0.20%) NCSC
4 1 (0.20%) NIST
4 1 (0.20%) NIST 800
4 1 (0.20%) P3O
4 1 (0.20%) PMO
System Software
1 19 (3.72%) Active Directory
2 16 (3.13%) Docker
3 14 (2.74%) VMware Infrastructure
4 7 (1.37%) Hyper-V
5 4 (0.78%) NFS
6 3 (0.59%) Firmware
7 2 (0.39%) Virtual Machines
8 1 (0.20%) Virtual Desktop
8 1 (0.20%) Virtual Servers
Systems Management
1 8 (1.57%) Kubernetes
2 7 (1.37%) Terraform
3 6 (1.17%) Proxmox
4 2 (0.39%) Ansible
4 2 (0.39%) Microsoft Intune
4 2 (0.39%) Puppet
4 2 (0.39%) Salt
5 1 (0.20%) Grafana
5 1 (0.20%) Graylog
5 1 (0.20%) Nessus
5 1 (0.20%) Rancher
Vendors
1 138 (27.01%) IBM
2 77 (15.07%) Microsoft
3 34 (6.65%) Cisco
4 26 (5.09%) Juniper
5 22 (4.31%) Aruba
5 22 (4.31%) Fortinet
6 21 (4.11%) Palo Alto
7 18 (3.52%) Facebook
8 15 (2.94%) YouTube
9 14 (2.74%) VMware
10 12 (2.35%) SAP
11 7 (1.37%) Adobe
12 5 (0.98%) ServiceNow
13 4 (0.78%) Google
13 4 (0.78%) Twitter
13 4 (0.78%) Ubiquiti
14 3 (0.59%) Salesforce
15 2 (0.39%) Meraki
15 2 (0.39%) Splunk
16 1 (0.20%) MuleSoft