Artificial Intelligence Jobs in the UK excluding London

Artificial Intelligence (AI)
UK > UK excluding London

The table below provides summary statistics for permanent job vacancies advertised in the UK excluding London requiring Artificial Intelligence skills. It includes a benchmarking guide to the annual salaries offered in vacancies that cited Artificial Intelligence over the 6 months leading up to 16 July 2025, comparing them to the same period in the previous two years.

6 months to
16 Jul 2025
Same period 2024 Same period 2023
Rank 18 50 164
Rank change year-on-year +32 +114 -50
Permanent jobs citing Artificial Intelligence 3,535 3,200 1,056
As % of all permanent jobs advertised in the UK excluding London 8.18% 4.26% 2.08%
As % of the Processes & Methodologies category 9.32% 5.29% 2.18%
Number of salaries quoted 829 1,229 570
10th Percentile £25,000 £37,500 £42,500
25th Percentile £36,250 £46,250 £50,000
Median annual salary (50th Percentile) £63,876 £62,500 £67,500
Median % change year-on-year +2.20% -7.41% +12.50%
75th Percentile £75,000 £85,000 £87,500
90th Percentile £95,000 £95,000 £97,500
UK median annual salary £66,295 £70,000 £75,000
% change year-on-year -5.29% -6.67% +7.14%

All Process and Methodology Skills
UK excluding London

Artificial Intelligence falls under the Processes and Methodologies category. For comparison with the information above, the following table provides summary statistics for all permanent job vacancies requiring process or methodology skills in the UK excluding London.

Permanent vacancies with a requirement for process or methodology skills 37,921 60,453 48,550
As % of all permanent jobs advertised in the UK excluding London 87.79% 80.49% 95.70%
Number of salaries quoted 19,528 40,416 27,929
10th Percentile £25,750 £27,500 £30,500
25th Percentile £32,951 £36,250 £40,000
Median annual salary (50th Percentile) £50,000 £50,000 £55,000
Median % change year-on-year - -9.09% +4.76%
75th Percentile £65,000 £65,000 £70,000
90th Percentile £78,750 £78,750 £81,250
UK median annual salary £55,000 £55,000 £60,249
% change year-on-year - -8.71% +0.42%

Artificial Intelligence
Job Vacancy Trend in the UK excluding London

Job postings citing Artificial Intelligence as a proportion of all IT jobs advertised in the UK excluding London.
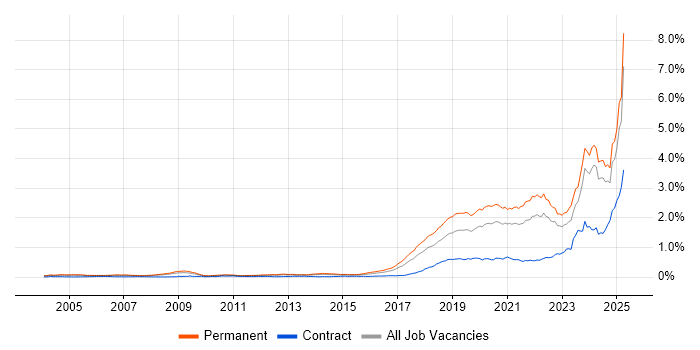
Job vacancy trend for Artificial Intelligence in the UK excluding London

Artificial Intelligence
Salary Trend in the UK excluding London

3-month moving average salary quoted in jobs citing Artificial Intelligence in the UK excluding London.

Salary trend for Artificial Intelligence in the UK excluding London

Artificial Intelligence
Salary Histogram in the UK excluding London

Salary distribution for jobs citing Artificial Intelligence in the UK excluding London over the 6 months to 16 July 2025.

Salary histogram for Artificial Intelligence in the UK excluding London

Artificial Intelligence
Job Locations in the UK excluding London

The table below looks at the demand and provides a guide to the median salaries quoted in IT jobs citing Artificial Intelligence within the UK excluding London region over the 6 months to 16 July 2025. The 'Rank Change' column provides an indication of the change in demand within each location based on the same 6 month period last year.

Location Rank Change
on Same Period
Last Year
Matching
Permanent
IT Job Ads
Median Salary
Past 6 Months
Median Salary
% Change
on Same Period
Last Year
Live
Jobs
North of England +56 893 £54,285 -3.93% 537
South East +23 886 £45,000 -30.77% 1,409
Midlands +95 720 £60,000 +2.21% 261
Yorkshire +83 404 £25,625 -62.04% 145
North West +11 404 £57,500 +4.55% 330
West Midlands +106 381 £60,000 - 162
East of England +97 360 £66,212 -11.72% 307
Scotland -2 353 £65,000 - 146
East Midlands +73 336 £62,500 +31.58% 96
South West +70 285 £60,000 - 243
North East +88 84 £31,500 -39.89% 66
Wales -2 32 £55,000 -18.52% 48
Northern Ireland +8 7 £87,500 +2.94% 50
Channel Islands -2 3 £80,000 +31.15%
Isle of Man +13 1 - -
Artificial Intelligence
UK

Artificial Intelligence
Co-occurring Skills and Capabilities in the UK excluding London by Category

The follow tables expand on the table above by listing co-occurrences grouped by category. The same employment type, locality and period is covered with up to 20 co-occurrences shown in each of the following categories:

Application Platforms
1 61 (1.73%) Apache Spark
2 27 (0.76%) CMS
3 23 (0.65%) Jupyter
4 21 (0.59%) SharePoint
5 17 (0.48%) Apache
6 16 (0.45%) Confluence
7 13 (0.37%) Microsoft Exchange
8 10 (0.28%) Apache Airflow
9 8 (0.23%) Camunda
9 8 (0.23%) Oracle Workflow
10 7 (0.20%) WordPress
11 6 (0.17%) Apache Solr
12 5 (0.14%) OpenStack
13 4 (0.11%) Tomcat
13 4 (0.11%) Umbraco
14 3 (0.085%) EPiServer
14 3 (0.085%) Kentico
14 3 (0.085%) SAS
15 2 (0.057%) Kinematics
15 2 (0.057%) Skype for Business
Applications
1 950 (26.87%) Chatbot
2 26 (0.74%) Microsoft Excel
3 23 (0.65%) Microsoft Office
4 9 (0.25%) Adobe Premiere
4 9 (0.25%) Photoshop
5 5 (0.14%) Adobe After Effects
5 5 (0.14%) Adobe Creative Suite
5 5 (0.14%) Microsoft PowerPoint
6 4 (0.11%) Simulink
7 3 (0.085%) MS Visio
8 2 (0.057%) S-PLUS
9 1 (0.028%) Spreadsheet
9 1 (0.028%) Trello
9 1 (0.028%) Weka
Business Applications
1 17 (0.48%) Dynamics AX
2 4 (0.11%) Dynamics CRM
3 3 (0.085%) Payment Gateway
4 2 (0.057%) Shopify
5 1 (0.028%) Dynamics NAV
5 1 (0.028%) Magento
5 1 (0.028%) NetSuite
5 1 (0.028%) Oracle ERP
5 1 (0.028%) Salesforce CRM
5 1 (0.028%) SAP S/4HANA
5 1 (0.028%) Sparx Enterprise Architect
5 1 (0.028%) TrackWise
Cloud Services
1 308 (8.71%) Azure
2 285 (8.06%) AWS
3 123 (3.48%) Power Platform
4 114 (3.22%) GCP
5 65 (1.84%) SaaS
6 63 (1.78%) Azure DevOps
7 56 (1.58%) Amazon S3
7 56 (1.58%) Microsoft 365
7 56 (1.58%) Serverless
8 47 (1.33%) Vertex AI
9 45 (1.27%) AWS Lambda
10 40 (1.13%) Azure AI
11 31 (0.88%) Power Automate
12 30 (0.85%) Azure Monitor
12 30 (0.85%) Entra ID
13 29 (0.82%) AWS Step Functions
14 28 (0.79%) GitHub
15 26 (0.74%) Snowflake
16 25 (0.71%) Azure Synapse Analytics
17 24 (0.68%) Amazon EKS
Communications & Networking
1 148 (4.19%) Broadband
2 35 (0.99%) Firewall
3 30 (0.85%) DNS
4 22 (0.62%) SD-WAN
5 18 (0.51%) WAN
6 17 (0.48%) VPN
7 15 (0.42%) Network Security
7 15 (0.42%) Unified Communications
8 14 (0.40%) DHCP
8 14 (0.40%) TCP/IP
9 6 (0.17%) SAN
9 6 (0.17%) Wi-Fi
10 5 (0.14%) Internet
10 5 (0.14%) VoIP
11 4 (0.11%) VLAN
12 3 (0.085%) HTTP
12 3 (0.085%) MQTT
12 3 (0.085%) PuTTY
13 2 (0.057%) 5G
13 2 (0.057%) Skype
Database & Business Intelligence
1 116 (3.28%) Big Data
2 109 (3.08%) Power BI
3 61 (1.73%) NoSQL
4 59 (1.67%) SQL Server
5 56 (1.58%) MySQL
6 47 (1.33%) Metadata
7 46 (1.30%) Data Warehouse
7 46 (1.30%) PostgreSQL
8 44 (1.24%) DynamoDB
9 41 (1.16%) Elasticsearch
10 40 (1.13%) Data Mining
11 38 (1.07%) MongoDB
12 35 (0.99%) Tableau
13 34 (0.96%) Data Lake
14 23 (0.65%) Spark SQL
15 22 (0.62%) Hadoop
16 21 (0.59%) Relational Database
17 19 (0.54%) Delta Lake
18 17 (0.48%) Redis
19 15 (0.42%) BigQuery
Development Applications
1 110 (3.11%) JIRA
2 82 (2.32%) Git
3 23 (0.65%) MLflow
4 20 (0.57%) Jenkins
5 14 (0.40%) JUnit
6 13 (0.37%) Selenium
7 10 (0.28%) Cypress.io
8 9 (0.25%) Maven
9 7 (0.20%) GitLab
10 5 (0.14%) Gradle
10 5 (0.14%) Octopus Deploy
11 4 (0.11%) Locust
11 4 (0.11%) Postman
11 4 (0.11%) SoapUI
12 3 (0.085%) Subversion
12 3 (0.085%) TeamCity
13 2 (0.057%) JMeter
13 2 (0.057%) Robot Framework
13 2 (0.057%) Vite
13 2 (0.057%) webpack
General
1 853 (24.13%) Retail
2 787 (22.26%) Manufacturing
3 745 (21.07%) Analytical Skills
4 589 (16.66%) Social Skills
5 543 (15.36%) Finance
6 394 (11.15%) Inclusion and Diversity
7 359 (10.16%) Law
8 285 (8.06%) Marketing
9 201 (5.69%) Banking
10 192 (5.43%) Dutch Language
10 192 (5.43%) Finnish Language
10 192 (5.43%) Norwegian Language
11 131 (3.71%) Public Sector
12 103 (2.91%) Legal
13 94 (2.66%) Games
14 55 (1.56%) Telecoms
15 48 (1.36%) Catalan Language
16 46 (1.30%) Advertising
17 29 (0.82%) Organisational Skills
18 24 (0.68%) Presentation Skills
Job Titles
1 1,619 (45.80%) Trainer
2 423 (11.97%) Senior
3 234 (6.62%) Software Engineer
4 225 (6.36%) Lead
5 219 (6.20%) Developer
6 113 (3.20%) Java Engineer
7 94 (2.66%) Architect
8 92 (2.60%) Sales Executive
9 74 (2.09%) Java Software Engineer
10 71 (2.01%) Analyst
11 68 (1.92%) Embedded Engineer
12 66 (1.87%) Senior Manager
13 65 (1.84%) Release Engineer
14 64 (1.81%) Innovation Manager
15 63 (1.78%) Data Scientist
16 59 (1.67%) Senior Developer
17 53 (1.50%) Graduate
18 51 (1.44%) DevOps Engineer
19 46 (1.30%) Graduate Sales Executive
20 42 (1.19%) Python Engineer
Libraries, Frameworks & Software Standards
1 190 (5.37%) HTML
2 123 (3.48%) React
3 97 (2.74%) Spring
4 89 (2.52%) GraphQL
5 66 (1.87%) Middleware
5 66 (1.87%) PyTorch
5 66 (1.87%) Unity (Game Engine)
6 65 (1.84%) TensorFlow
6 65 (1.84%) WebGL
7 60 (1.70%) Software Packaging
8 57 (1.61%) Kafka
9 56 (1.58%) Node.js
10 51 (1.44%) Spring Boot
11 48 (1.36%) scikit-learn
12 44 (1.24%) REST
13 40 (1.13%) .NET
14 37 (1.05%) NumPy
14 37 (1.05%) PySpark
15 35 (0.99%) RESTful
16 32 (0.91%) Keras
Miscellaneous
1 799 (22.60%) Robotics
2 199 (5.63%) Algorithms
3 111 (3.14%) Hybrid Cloud
4 84 (2.38%) Data Centre
5 83 (2.35%) Management Information System
6 69 (1.95%) Animation
7 68 (1.92%) Embedded Systems
8 67 (1.90%) e-Learning
9 64 (1.81%) Cloud Native
10 46 (1.30%) Cyberattack
11 43 (1.22%) Onboarding
12 42 (1.19%) Digital Media
13 39 (1.10%) Blockchain
14 38 (1.07%) Molecular Biology
15 33 (0.93%) Marketing Technology
16 32 (0.91%) Social Media
17 31 (0.88%) Legacy Systems
18 30 (0.85%) AI Agents
18 30 (0.85%) Linux Command Line
19 28 (0.79%) Product Ownership
Operating Systems
1 60 (1.70%) Windows
2 45 (1.27%) Linux
3 33 (0.93%) Windows Server
4 30 (0.85%) Unix
5 24 (0.68%) Android
5 24 (0.68%) Apple iOS
6 10 (0.28%) Mac OS
7 6 (0.17%) Windows Server 2019
8 3 (0.085%) Red Hat Enterprise Linux
9 2 (0.057%) VMS
9 2 (0.057%) Windows Server 2003
10 1 (0.028%) OpenVMS
10 1 (0.028%) Robot Operating System
10 1 (0.028%) Ubuntu
Processes & Methodologies
1 1,338 (37.85%) Machine Learning
2 1,126 (31.85%) Problem-Solving
3 951 (26.90%) Conversational UI
4 888 (25.12%) Generative AI
5 870 (24.61%) LLM
6 720 (20.37%) Red Team
7 629 (17.79%) Data Privacy
8 613 (17.34%) Agile
9 491 (13.89%) Analytics
10 436 (12.33%) Software Engineering
11 426 (12.05%) Chemistry
12 413 (11.68%) Mathematics
13 346 (9.79%) Computer Science
14 339 (9.59%) Decision-Making
15 333 (9.42%) CI/CD
15 333 (9.42%) Roadmaps
16 304 (8.60%) Continuous Improvement
17 274 (7.75%) Data Science
18 260 (7.36%) Mentoring
19 228 (6.45%) DevOps
Programming Languages
1 482 (13.64%) Python
2 406 (11.49%) SQL
3 313 (8.85%) JavaScript
4 285 (8.06%) Java
5 231 (6.53%) C#
6 181 (5.12%) C++
7 125 (3.54%) TypeScript
8 72 (2.04%) R
9 65 (1.84%) HLSL
10 60 (1.70%) PHP
11 58 (1.64%) C
12 55 (1.56%) Rust
13 54 (1.53%) MATLAB
14 50 (1.41%) Ruby
15 48 (1.36%) Dart
15 48 (1.36%) PowerShell
16 25 (0.71%) Bash
17 24 (0.68%) Bicep
18 23 (0.65%) T-SQL
19 16 (0.45%) Go
Qualifications
1 2,043 (57.79%) Degree
2 731 (20.68%) Master's Degree
3 690 (19.52%) PhD
4 126 (3.56%) Computer Science Degree
4 126 (3.56%) Security Cleared
5 87 (2.46%) DV Cleared
6 45 (1.27%) SC Cleared
7 39 (1.10%) DBS Check
8 34 (0.96%) AWS Certification
9 31 (0.88%) Azure Certification
10 24 (0.68%) Numerate Degree
11 17 (0.48%) CISA
11 17 (0.48%) ISACA
12 13 (0.37%) Microsoft Certification
13 8 (0.23%) MBA
14 6 (0.17%) CBAP
14 6 (0.17%) TOGAF Certification
15 5 (0.14%) ACCA
16 4 (0.11%) CIMA
16 4 (0.11%) MCAD
Quality Assurance & Compliance
1 61 (1.73%) Data Quality
2 45 (1.27%) GDPR
3 39 (1.10%) ITGC
4 33 (0.93%) QA
5 32 (0.91%) Accessibility
6 22 (0.62%) ISO/IEC 27001
7 12 (0.34%) California Consumer Privacy Act
8 9 (0.25%) Actionable Recommendations
9 8 (0.23%) NIST
10 7 (0.20%) Cyber Essentials
11 6 (0.17%) Cyber Essentials PLUS
12 5 (0.14%) SOC 2
13 4 (0.11%) GRC
13 4 (0.11%) SLA
14 3 (0.085%) GxP
14 3 (0.085%) PMBOK
14 3 (0.085%) Sarbanes-Oxley
15 2 (0.057%) COBIT
15 2 (0.057%) P3O
15 2 (0.057%) PMO
System Software
1 112 (3.17%) Docker
2 16 (0.45%) Virtual Machines
2 16 (0.45%) VMware Infrastructure
3 15 (0.42%) Active Directory
4 12 (0.34%) HDFS
5 7 (0.20%) VMware ESXi
6 6 (0.17%) Hyper-V
7 3 (0.085%) Apache Flume
7 3 (0.085%) Firmware
8 1 (0.028%) Terminal Server
8 1 (0.028%) Virtual Desktop
8 1 (0.028%) Xen
Systems Management
1 123 (3.48%) Kubernetes
2 64 (1.81%) Terraform
3 29 (0.82%) Grafana
4 21 (0.59%) Kubeflow
5 20 (0.57%) Prometheus
6 16 (0.45%) Ansible
7 14 (0.40%) Single Sign-On
8 12 (0.34%) Microsoft Intune
9 6 (0.17%) Active Directory Federation Services
9 6 (0.17%) ArcSight ESM
9 6 (0.17%) QRadar
10 4 (0.11%) ITRS Geneos
10 4 (0.11%) Netcool
10 4 (0.11%) Netcool/OMNIbus
10 4 (0.11%) SCOM
10 4 (0.11%) Tivoli
11 3 (0.085%) Kibana
11 3 (0.085%) logstash
11 3 (0.085%) Oozie
11 3 (0.085%) SmoothWall
Vendors
1 911 (25.77%) PayPal
2 853 (24.13%) Google
3 806 (22.80%) Databricks
4 747 (21.13%) Adobe
5 254 (7.19%) Microsoft
6 88 (2.49%) Oracle
7 84 (2.38%) IBM
8 80 (2.26%) Cisco
9 77 (2.18%) Red Hat
10 55 (1.56%) OpenAI
11 50 (1.41%) Dell
12 33 (0.93%) Splunk
13 31 (0.88%) SAP
14 24 (0.68%) ServiceNow
15 23 (0.65%) VMware
16 22 (0.62%) Apple
17 20 (0.57%) Dynatrace
18 17 (0.48%) Foundry
19 16 (0.45%) Salesforce
20 14 (0.40%) Meraki