Onboarding Jobs in the UK excluding London

Onboarding
UK > UK excluding London

The table below looks at the prevalence of the term Onboarding in permanent job vacancies in the UK excluding London. Included is a benchmarking guide to the salaries offered in vacancies that cited Onboarding over the 6 months leading up to 18 May 2025, comparing them to the same period in the previous two years.

6 months to
18 May 2025
Same period 2024 Same period 2023
Rank 256 177 236
Rank change year-on-year -79 +59 +27
Permanent jobs citing Onboarding 448 1,133 869
As % of all permanent jobs advertised in the UK excluding London 1.12% 1.58% 1.47%
As % of the Miscellaneous category 3.34% 4.69% 3.49%
Number of salaries quoted 331 594 370
10th Percentile £25,500 £27,000 £31,250
25th Percentile £28,500 £31,250 £40,000
Median annual salary (50th Percentile) £37,500 £40,400 £55,000
Median % change year-on-year -7.18% -26.55% +10.00%
75th Percentile £56,250 £60,000 £71,250
90th Percentile £70,000 £73,750 £81,250
UK median annual salary £52,500 £50,000 £65,000
% change year-on-year +5.00% -23.08% +8.33%

All Generic Skills
UK excluding London

Onboarding falls under the General and Transferable Skills category. For comparison with the information above, the following table provides summary statistics for all permanent job vacancies requiring generic IT skills in the UK excluding London.

Permanent vacancies with a requirement for generic IT skills 13,411 24,153 24,928
As % of all permanent jobs advertised in the UK excluding London 33.64% 33.77% 42.24%
Number of salaries quoted 6,122 15,207 11,097
10th Percentile £28,800 £26,250 £31,250
25th Percentile £37,500 £35,000 £40,250
Median annual salary (50th Percentile) £54,975 £50,000 £55,000
Median % change year-on-year +9.95% -9.09% +4.76%
75th Percentile £67,500 £65,000 £70,000
90th Percentile £80,000 £80,000 £85,000
UK median annual salary £60,000 £55,000 £65,000
% change year-on-year +9.09% -15.38% +4.00%

Onboarding
Job Vacancy Trend in the UK excluding London

Job postings citing Onboarding as a proportion of all IT jobs advertised in the UK excluding London.
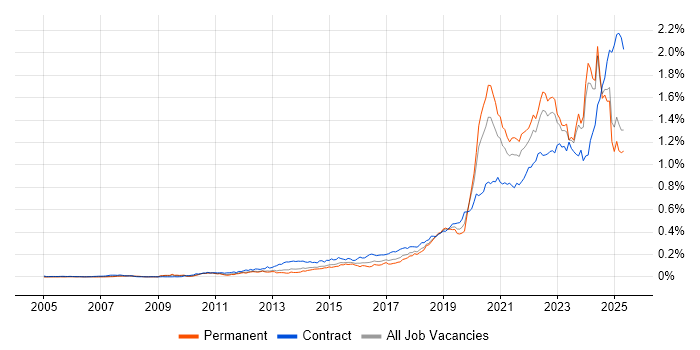
Job vacancy trend for Onboarding in the UK excluding London

Onboarding
Salary Trend in the UK excluding London

3-month moving average salary quoted in jobs citing Onboarding in the UK excluding London.

Salary trend for Onboarding in the UK excluding London

Onboarding
Salary Histogram in the UK excluding London

Salary distribution for jobs citing Onboarding in the UK excluding London over the 6 months to 18 May 2025.

Salary histogram for Onboarding in the UK excluding London

Onboarding
Job Locations in the UK excluding London

The table below looks at the demand and provides a guide to the median salaries quoted in IT jobs citing Onboarding within the UK excluding London region over the 6 months to 18 May 2025. The 'Rank Change' column provides an indication of the change in demand within each location based on the same 6 month period last year.

Location Rank Change
on Same Period
Last Year
Matching
Permanent
IT Job Ads
Median Salary
Past 6 Months
Median Salary
% Change
on Same Period
Last Year
Live
Jobs
Midlands -36 133 £45,000 +13.92% 213
South East +8 125 £37,500 -9.53% 461
North of England -29 97 £35,750 -20.56% 328
West Midlands -50 74 £50,000 +11.11% 120
East Midlands +12 59 £31,750 -5.22% 85
North West -47 48 £37,500 -13.72% 178
Yorkshire +34 44 £35,000 -41.67% 101
South West +52 42 £40,000 -8.05% 171
East of England 0 26 £47,500 +6.15% 130
Scotland -39 24 £32,500 -36.59% 102
Wales +11 9 £65,000 +73.33% 41
North East +29 5 £70,000 +55.56% 55
Northern Ireland +33 1 - - 25
Onboarding
UK

Onboarding
Co-occurring Skills and Capabilities in the UK excluding London by Category

The follow tables expand on the table above by listing co-occurrences grouped by category. The same employment type, locality and period is covered with up to 20 co-occurrences shown in each of the following categories:

Application Platforms
1 37 (8.26%) Microsoft Exchange
2 36 (8.04%) SharePoint
3 10 (2.23%) Confluence
4 6 (1.34%) Apache
4 6 (1.34%) IIS
5 4 (0.89%) Jupyter
6 3 (0.67%) WordPress
7 2 (0.45%) Apache Spark
7 2 (0.45%) CMS
8 1 (0.22%) SharePoint Server
Applications
1 45 (10.04%) Microsoft Office
2 31 (6.92%) Microsoft Excel
3 11 (2.46%) Chatbot
4 3 (0.67%) Adobe XD
4 3 (0.67%) Microsoft PowerPoint
4 3 (0.67%) Spreadsheet
5 2 (0.45%) Adobe Creative Suite
5 2 (0.45%) Adobe Illustrator
5 2 (0.45%) Photoshop
6 1 (0.22%) Adobe After Effects
6 1 (0.22%) Adobe Premiere
6 1 (0.22%) Blender
6 1 (0.22%) CINEMA 4D
6 1 (0.22%) InDesign
6 1 (0.22%) Microsoft Project
6 1 (0.22%) Sketch
Business Applications
1 10 (2.23%) TrackWise
2 5 (1.12%) Magento
2 5 (1.12%) Shopify
3 4 (0.89%) Markit EDM
3 4 (0.89%) SAP HR
4 2 (0.45%) Dynamics CRM
4 2 (0.45%) SAP S/4HANA
5 1 (0.22%) Academy Revenues and Benefits
5 1 (0.22%) Fidessa
5 1 (0.22%) NetSuite
5 1 (0.22%) Sage 200
5 1 (0.22%) SAP Business One
Cloud Services
1 104 (23.21%) Microsoft 365
2 79 (17.63%) Azure
3 59 (13.17%) SaaS
4 26 (5.80%) Entra ID
5 24 (5.36%) AWS
6 18 (4.02%) OCI
7 16 (3.57%) Azure DevOps
8 14 (3.13%) OneDrive
9 13 (2.90%) GitHub
10 12 (2.68%) Power Platform
11 11 (2.46%) GitHub Actions
12 10 (2.23%) Veeva
13 8 (1.79%) IaaS
14 7 (1.56%) Canva
14 7 (1.56%) Mimecast
14 7 (1.56%) PaaS
14 7 (1.56%) Power Automate
15 5 (1.12%) BigCommerce
15 5 (1.12%) Salesforce Service Cloud
16 4 (0.89%) Boomi
Communications & Networking
1 54 (12.05%) Firewall
2 27 (6.03%) WAN
3 25 (5.58%) LAN
4 21 (4.69%) VPN
5 18 (4.02%) DNS
6 13 (2.90%) VoIP
7 11 (2.46%) DHCP
8 9 (2.01%) Intranet
8 9 (2.01%) TCP/IP
9 8 (1.79%) Internet
10 7 (1.56%) IP Telephony
11 5 (1.12%) VLAN
12 4 (0.89%) Broadband
12 4 (0.89%) Network Security
12 4 (0.89%) Wi-Fi
12 4 (0.89%) Wireless
13 2 (0.45%) 5G
13 2 (0.45%) SAN
13 2 (0.45%) SD-WAN
14 1 (0.22%) FIX Connectivity
Database & Business Intelligence
1 22 (4.91%) SQL Server
2 11 (2.46%) Amazon RDS
3 7 (1.56%) Power BI
3 7 (1.56%) Tableau
4 6 (1.34%) Oracle Reports
4 6 (1.34%) Relational Database
5 4 (0.89%) Data Lake
5 4 (0.89%) Dremio
5 4 (0.89%) PostgreSQL
5 4 (0.89%) Redis
6 2 (0.45%) Data Warehouse
6 2 (0.45%) Hadoop
6 2 (0.45%) NoSQL
7 1 (0.22%) Big Data
7 1 (0.22%) BusinessObjects
7 1 (0.22%) MongoDB
7 1 (0.22%) MySQL
Development Applications
1 19 (4.24%) JIRA
2 11 (2.46%) SonarQube
3 6 (1.34%) Git
3 6 (1.34%) Postman
4 5 (1.12%) Selenium
5 3 (0.67%) GitLab
6 2 (0.45%) Cypress.io
7 1 (0.22%) Bitbucket
7 1 (0.22%) IntelliJ
7 1 (0.22%) Jenkins
7 1 (0.22%) JMeter
7 1 (0.22%) Maven
7 1 (0.22%) Sonatype Nexus
7 1 (0.22%) TestComplete
General
1 226 (50.45%) Social Skills
2 76 (16.96%) Finance
3 35 (7.81%) Retail
4 34 (7.59%) Analytical Skills
5 29 (6.47%) Organisational Skills
6 23 (5.13%) Marketing
7 22 (4.91%) Public Sector
8 20 (4.46%) Inclusion and Diversity
8 20 (4.46%) Law
9 16 (3.57%) Local Government
9 16 (3.57%) Manufacturing
10 15 (3.35%) Back Office
10 15 (3.35%) Banking
11 11 (2.46%) Telecoms
12 10 (2.23%) Legal
12 10 (2.23%) Pharmaceutical
13 9 (2.01%) Financial Institution
14 7 (1.56%) Billing
14 7 (1.56%) Presentation Skills
15 5 (1.12%) Documentation Skills
Job Titles
1 60 (13.39%) Analyst
2 44 (9.82%) IT Support
2 44 (9.82%) Senior
3 40 (8.93%) Support Engineer
4 27 (6.03%) Consultant
5 25 (5.58%) Lead
6 24 (5.36%) Developer
7 23 (5.13%) Technical Support
8 21 (4.69%) 2nd Line Support
9 20 (4.46%) IT Manager
10 17 (3.79%) 1st Line Support
10 17 (3.79%) Senior Analyst
11 16 (3.57%) Support Analyst
12 14 (3.13%) Service Manager
12 14 (3.13%) Support Technician
13 13 (2.90%) Cloud Specialist
13 13 (2.90%) IT Analyst
14 12 (2.68%) 2nd/3rd Line Support
14 12 (2.68%) 3rd Line Engineer
14 12 (2.68%) Oracle Specialist
Libraries, Frameworks & Software Standards
1 25 (5.58%) .NET
2 13 (2.90%) Node.js
3 12 (2.68%) RESTful
4 8 (1.79%) HTML
4 8 (1.79%) React
5 7 (1.56%) ARM Templates
5 7 (1.56%) ASP.NET
5 7 (1.56%) Azure Blueprints
6 6 (1.34%) AngularJS
7 5 (1.12%) CodeIgniter
7 5 (1.12%) EDI
7 5 (1.12%) Laravel
8 4 (0.89%) Django
8 4 (0.89%) Flask
8 4 (0.89%) JSON
8 4 (0.89%) OAuth
8 4 (0.89%) pytest
8 4 (0.89%) SailPoint
8 4 (0.89%) SQLAlchemy
8 4 (0.89%) WebSockets
Miscellaneous
1 31 (6.92%) Self-Motivation
2 24 (5.36%) Driving Licence
3 22 (4.91%) Management Information System
4 12 (2.68%) Data Centre
5 9 (2.01%) Client/Server
5 9 (2.01%) FMCG
6 8 (1.79%) Robotics
6 8 (1.79%) Social Media
7 7 (1.56%) EPoS
8 6 (1.34%) Graphic Design
8 6 (1.34%) Hybrid Cloud
9 5 (1.12%) CMDB
9 5 (1.12%) Equities
10 4 (0.89%) PMI
10 4 (0.89%) Reference Data
11 3 (0.67%) NHS
11 3 (0.67%) Video Conferencing
12 2 (0.45%) Data Protection Act
12 2 (0.45%) e-Learning
12 2 (0.45%) Life Science
Operating Systems
1 92 (20.54%) Windows
2 44 (9.82%) Windows Server
3 22 (4.91%) Mac OS
4 21 (4.69%) Windows Server 2016
5 16 (3.57%) Windows Server 2019
6 12 (2.68%) Android
6 12 (2.68%) Windows 10
7 8 (1.79%) Apple iOS
7 8 (1.79%) Linux
8 1 (0.22%) Unix
Processes & Methodologies
1 115 (25.67%) Problem-Solving
2 104 (23.21%) Client Onboarding
3 80 (17.86%) Customer Service
4 65 (14.51%) Project Management
5 56 (12.50%) CRM
6 51 (11.38%) Continuous Improvement
6 51 (11.38%) ITIL
7 50 (11.16%) Mentoring
8 47 (10.49%) Project Delivery
9 45 (10.04%) Agile
10 40 (8.93%) Cybersecurity
11 33 (7.37%) Change Management
12 32 (7.14%) ITSM
13 31 (6.92%) Stakeholder Management
14 30 (6.70%) DevOps
15 28 (6.25%) Artificial Intelligence
16 27 (6.03%) Customer Experience
17 26 (5.80%) Asset Management
18 23 (5.13%) B2B
19 21 (4.69%) Service Delivery
Programming Languages
1 41 (9.15%) SQL
2 34 (7.59%) PowerShell
3 27 (6.03%) C#
4 26 (5.80%) Python
5 23 (5.13%) JavaScript
6 10 (2.23%) PHP
7 7 (1.56%) VB.NET
8 6 (1.34%) Bash
9 5 (1.12%) TypeScript
10 3 (0.67%) C++
11 2 (0.45%) Java
11 2 (0.45%) MATLAB
11 2 (0.45%) VB
12 1 (0.22%) Bicep
12 1 (0.22%) C
12 1 (0.22%) Go
12 1 (0.22%) R
12 1 (0.22%) VBA
12 1 (0.22%) VBScript
Qualifications
1 53 (11.83%) Degree
2 32 (7.14%) Security Cleared
3 15 (3.35%) Microsoft Certification
4 14 (3.13%) BPSS Clearance
5 11 (2.46%) DBS Check
5 11 (2.46%) SC Cleared
6 10 (2.23%) Computer Science Degree
7 7 (1.56%) PMI Certification
8 5 (1.12%) MCP
9 4 (0.89%) Azure Certification
9 4 (0.89%) ITIL Certification
9 4 (0.89%) MCSA
9 4 (0.89%) PMP
10 3 (0.67%) A+ Certification
10 3 (0.67%) AWS Certification
10 3 (0.67%) Network+ Certification
11 2 (0.45%) CIPD
11 2 (0.45%) CISSP
11 2 (0.45%) DV Cleared
11 2 (0.45%) Master's Degree
Quality Assurance & Compliance
1 32 (7.14%) QA
2 21 (4.69%) SLA
3 15 (3.35%) GDPR
4 10 (2.23%) GMP
4 10 (2.23%) ISO/IEC 27001
5 8 (1.79%) NCSC
6 6 (1.34%) Accessibility
6 6 (1.34%) Cyber Essentials
7 5 (1.12%) Data Quality
7 5 (1.12%) PMO
8 3 (0.67%) GRC
9 2 (0.45%) NIST
9 2 (0.45%) PCI DSS
10 1 (0.22%) Actionable Recommendations
10 1 (0.22%) Government Security Classifications
10 1 (0.22%) WCAG
System Software
1 62 (13.84%) Active Directory
2 46 (10.27%) VMware Infrastructure
3 26 (5.80%) Hyper-V
4 14 (3.13%) XenApp
5 12 (2.68%) Docker
6 6 (1.34%) Virtual Desktop
7 5 (1.12%) Terminal Services
8 1 (0.22%) BitLocker
8 1 (0.22%) Microsoft App-V
8 1 (0.22%) Virtual Machines
Systems Management
1 36 (8.04%) Microsoft Intune
2 14 (3.13%) Kubernetes
3 10 (2.23%) Terraform
4 7 (1.56%) Ansible
5 5 (1.12%) SCCM
5 5 (1.12%) ZABBIX
6 4 (0.89%) Grafana
6 4 (0.89%) Prometheus
7 3 (0.67%) Autotask
8 1 (0.22%) Active Directory Federation Services
8 1 (0.22%) Backup Exec
8 1 (0.22%) CSIRT
8 1 (0.22%) NetBackup
8 1 (0.22%) WMI
8 1 (0.22%) WSUS
Vendors
1 146 (32.59%) Microsoft
2 46 (10.27%) VMware
3 25 (5.58%) Oracle
4 24 (5.36%) Cisco
5 23 (5.13%) Citrix
5 23 (5.13%) SAP
6 20 (4.46%) SonicWALL
7 19 (4.24%) Meraki
8 15 (3.35%) Dell
9 14 (3.13%) CheckPoint
10 11 (2.46%) ServiceNow
10 11 (2.46%) Veeam
11 10 (2.23%) Apple
12 9 (2.01%) Salesforce
13 7 (1.56%) UiPath
14 6 (1.34%) Infor
15 5 (1.12%) Bloomberg
15 5 (1.12%) OpenAI
16 4 (0.89%) Instagram
16 4 (0.89%) Okta