Banking Jobs in the City of London

Banking
Central London > City of London

The table below looks at the prevalence of the term Banking in permanent job vacancies in the City of London. Included is a benchmarking guide to the salaries offered in vacancies that cited Banking over the 6 months leading up to 4 June 2025, comparing them to the same period in the previous two years.

6 months to
4 Jun 2025
Same period 2024 Same period 2023
Rank 39 41 30
Rank change year-on-year +2 -11 +9
Permanent jobs citing Banking 129 181 359
As % of all permanent jobs advertised in the City of London 6.64% 5.43% 8.00%
As % of the General category 9.40% 8.87% 12.20%
Number of salaries quoted 105 160 315
10th Percentile £46,000 £55,000 £50,000
25th Percentile £65,000 £66,250 £64,375
Median annual salary (50th Percentile) £92,500 £85,000 £87,500
Median % change year-on-year +8.82% -2.86% +2.94%
75th Percentile £117,750 £106,500 £115,000
90th Percentile £147,250 £126,500 £132,750
Central London median annual salary £87,500 £85,000 £87,500
% change year-on-year +2.94% -2.86% +2.94%

All General Skills
City of London

Banking falls under the General Skills category. For comparison with the information above, the following table provides summary statistics for all permanent job vacancies requiring common skills in the City of London.

Permanent vacancies with a requirement for common skills 1,373 2,041 2,943
As % of all permanent jobs advertised in the City of London 70.70% 61.22% 65.62%
Number of salaries quoted 970 1,566 2,386
10th Percentile £41,250 £41,250 £42,000
25th Percentile £52,500 £52,500 £53,875
Median annual salary (50th Percentile) £70,000 £72,500 £75,000
Median % change year-on-year -3.45% -3.33% +3.45%
75th Percentile £95,000 £93,750 £100,000
90th Percentile £122,500 £112,500 £120,000
Central London median annual salary £72,500 £70,000 £73,105
% change year-on-year +3.57% -4.25% +0.83%

Banking
Job Vacancy Trend in the City of London

Job postings citing Banking as a proportion of all IT jobs advertised in the City of London.
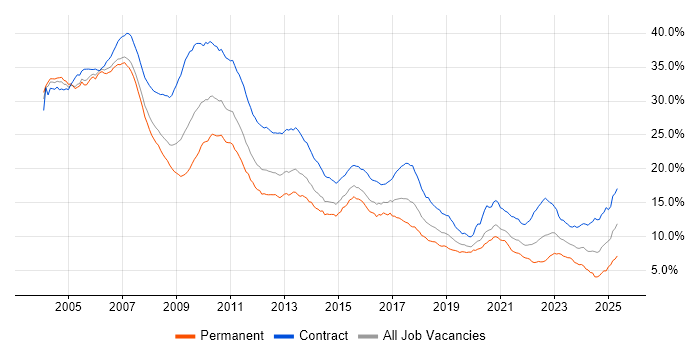
Job vacancy trend for Banking in the City of London

Banking
Salary Trend in the City of London

3-month moving average salary quoted in jobs citing Banking in the City of London.

Salary trend for Banking in the City of London

Banking
Salary Histogram in the City of London

Salary distribution for jobs citing Banking in the City of London over the 6 months to 4 June 2025.

Salary histogram for Banking in the City of London

Banking
Co-occurring Skills and Capabilities in the City of London by Category

The follow tables expand on the table above by listing co-occurrences grouped by category. The same employment type, locality and period is covered with up to 20 co-occurrences shown in each of the following categories:

Application Platforms
1 6 (4.65%) SharePoint
2 4 (3.10%) Microsoft Exchange
3 2 (1.55%) nginx
3 2 (1.55%) Tomcat
4 1 (0.78%) Confluence
4 1 (0.78%) SAS
Applications
1 7 (5.43%) Microsoft Office
2 5 (3.88%) Microsoft Excel
3 2 (1.55%) Microsoft PowerPoint
4 1 (0.78%) Chatbot
Business Applications
1 6 (4.65%) Orchestrade
2 4 (3.10%) Adaptiv
2 4 (3.10%) SimCorp Dimension
3 3 (2.33%) Fidessa
4 2 (1.55%) Dynamics CRM
4 2 (1.55%) Payment Gateway
Cloud Services
1 27 (20.93%) AWS
2 20 (15.50%) Azure
3 10 (7.75%) Serverless
4 7 (5.43%) Microsoft 365
4 7 (5.43%) Power Platform
5 6 (4.65%) Amazon S3
5 6 (4.65%) AWS Lambda
5 6 (4.65%) AWS Step Functions
5 6 (4.65%) GCP
6 5 (3.88%) Amazon ECS
6 5 (3.88%) GitHub
7 4 (3.10%) Amazon Kinesis
7 4 (3.10%) Cloud Computing
7 4 (3.10%) Microsoft Purview
8 3 (2.33%) Copilot Studio
8 3 (2.33%) Microsoft Copilot
8 3 (2.33%) PaaS
9 2 (1.55%) Amazon SQS
9 2 (1.55%) Entra ID
9 2 (1.55%) Virtual Private Cloud
Communications & Networking
1 5 (3.88%) Multicast
2 4 (3.10%) Firewall
3 3 (2.33%) NetScaler
3 3 (2.33%) Network Security
3 3 (2.33%) VPN
4 2 (1.55%) DNS
4 2 (1.55%) Telnet
4 2 (1.55%) VLAN
5 1 (0.78%) SAN
5 1 (0.78%) Wi-Fi
Database & Business Intelligence
1 11 (8.53%) Relational Database
2 8 (6.20%) SQL Server
3 6 (4.65%) Power BI
4 5 (3.88%) MySQL
4 5 (3.88%) RDBMS
5 4 (3.10%) Tableau
6 3 (2.33%) ClickHouse
6 3 (2.33%) Data Lake
6 3 (2.33%) Data Warehouse
6 3 (2.33%) Semantic Layer
7 2 (1.55%) Crystal Reports
7 2 (1.55%) DynamoDB
7 2 (1.55%) OLAP
7 2 (1.55%) OLTP
7 2 (1.55%) PostgreSQL
7 2 (1.55%) Redis
8 1 (0.78%) Delta Lake
8 1 (0.78%) Elasticsearch
8 1 (0.78%) NonStop SQL
8 1 (0.78%) Tableau Desktop
Development Applications
1 14 (10.85%) Git
2 10 (7.75%) JIRA
3 4 (3.10%) Selenium
4 3 (2.33%) Atlassian Bamboo
4 3 (2.33%) Cypress.io
4 3 (2.33%) Jenkins
5 2 (1.55%) Artifactory
5 2 (1.55%) GitLab
5 2 (1.55%) JUnit
5 2 (1.55%) Octopus Deploy
5 2 (1.55%) Visual Studio
6 1 (0.78%) Gradle
6 1 (0.78%) Postman
6 1 (0.78%) Team Foundation Server
General
1 97 (75.19%) Finance
2 46 (35.66%) Social Skills
3 33 (25.58%) Investment Banking
4 23 (17.83%) Analytical Skills
5 18 (13.95%) Front Office
6 12 (9.30%) Inclusion and Diversity
7 9 (6.98%) Financial Institution
7 9 (6.98%) Retail
8 3 (2.33%) French Language
8 3 (2.33%) Law
8 3 (2.33%) Wholesale Banking
9 2 (1.55%) Advertising
9 2 (1.55%) Back Office
9 2 (1.55%) Local Government
9 2 (1.55%) Marketing
9 2 (1.55%) Organisational Skills
9 2 (1.55%) Presentation Skills
10 1 (0.78%) Electronics
10 1 (0.78%) Games
10 1 (0.78%) Publishing
Job Titles
1 36 (27.91%) Developer
2 24 (18.60%) Senior
3 21 (16.28%) Analyst
4 14 (10.85%) Lead
4 14 (10.85%) Senior Developer
5 11 (8.53%) C# Developer
6 10 (7.75%) Python Developer
6 10 (7.75%) Software Engineer
6 10 (7.75%) Support Analyst
7 9 (6.98%) AWS Developer
7 9 (6.98%) Banking Analyst
8 8 (6.20%) .NET Developer
8 8 (6.20%) Applications Support
9 7 (5.43%) Applications Support Analyst
9 7 (5.43%) Software Developer
10 6 (4.65%) Business Analyst
10 6 (4.65%) Platform Engineer
10 6 (4.65%) React Developer
11 5 (3.88%) Head of Engineering
11 5 (3.88%) Java Developer
Libraries, Frameworks & Software Standards
1 17 (13.18%) FIX Protocol
2 13 (10.08%) .NET
3 8 (6.20%) Middleware
3 8 (6.20%) Web Services
4 7 (5.43%) Node.js
5 6 (4.65%) Django
5 6 (4.65%) Flask
5 6 (4.65%) REST
6 5 (3.88%) GraphQL
6 5 (3.88%) React
7 3 (2.33%) .NET Core
7 3 (2.33%) Boost C++ Libraries
7 3 (2.33%) Kafka
7 3 (2.33%) pytest
8 2 (1.55%) AWS CDK
8 2 (1.55%) FastAPI
8 2 (1.55%) gRPC
8 2 (1.55%) LEMP Stack
8 2 (1.55%) WebSockets
8 2 (1.55%) YAML
Miscellaneous
1 13 (10.08%) Foreign Exchange (FX)
2 12 (9.30%) Cloud Native
3 11 (8.53%) Fixed Income
4 9 (6.98%) Self-Motivation
5 7 (5.43%) Derivative
6 6 (4.65%) Equities
6 6 (4.65%) Greenfield Project
6 6 (4.65%) Legacy Systems
6 6 (4.65%) Market Risk
7 4 (3.10%) Credit Risk
7 4 (3.10%) Hedge funds
7 4 (3.10%) Onboarding
8 3 (2.33%) Algorithms
8 3 (2.33%) Analytical Mindset
8 3 (2.33%) Product Ownership
8 3 (2.33%) Reference Data
8 3 (2.33%) Video Conferencing
9 2 (1.55%) Distributed Systems
9 2 (1.55%) Hybrid Cloud
9 2 (1.55%) Public Cloud
Operating Systems
1 27 (20.93%) Linux
2 13 (10.08%) Unix
3 11 (8.53%) Windows
4 8 (6.20%) Red Hat Enterprise Linux
5 5 (3.88%) Windows Server
6 4 (3.10%) CentOS
6 4 (3.10%) Rocky
7 3 (2.33%) Windows Server 2016
8 2 (1.55%) Ubuntu
Processes & Methodologies
1 44 (34.11%) Agile
2 34 (26.36%) Problem-Solving
3 28 (21.71%) DevOps
4 22 (17.05%) Project Management
4 22 (17.05%) Risk Management
5 20 (15.50%) CI/CD
6 17 (13.18%) Software Engineering
7 16 (12.40%) Mentoring
7 16 (12.40%) Microservices
8 15 (11.63%) Analytics
8 15 (11.63%) Data Management
8 15 (11.63%) Machine Learning
9 14 (10.85%) Investment Management
10 12 (9.30%) Stakeholder Management
10 12 (9.30%) Technology Strategy
11 11 (8.53%) Continuous Improvement
11 11 (8.53%) Data Science
11 11 (8.53%) Infrastructure as Code
11 11 (8.53%) Low Latency
11 11 (8.53%) Platform Engineering
Programming Languages
1 43 (33.33%) Python
2 37 (28.68%) SQL
3 32 (24.81%) Java
4 18 (13.95%) C#
5 17 (13.18%) Bash
6 14 (10.85%) C++
7 11 (8.53%) PowerShell
8 9 (6.98%) JavaScript
9 7 (5.43%) TypeScript
10 4 (3.10%) Rust
11 3 (2.33%) Go
11 3 (2.33%) T-SQL
11 3 (2.33%) VBA
12 2 (1.55%) PL/SQL
12 2 (1.55%) Ruby
12 2 (1.55%) Search Processing Language
13 1 (0.78%) COBOL
13 1 (0.78%) Perl
13 1 (0.78%) Scala
Qualifications
1 17 (13.18%) Degree
2 8 (6.20%) CFA
2 8 (6.20%) PMI Certification
2 8 (6.20%) PMP
3 5 (3.88%) ITIL Certification
4 4 (3.10%) Azure Certification
4 4 (3.10%) RHCSA
5 3 (2.33%) Cisco Certification
5 3 (2.33%) Computer Science Degree
5 3 (2.33%) Microsoft Certification
6 2 (1.55%) (ISC)2 CCSP
6 2 (1.55%) AWS Certification
6 2 (1.55%) CCSP
6 2 (1.55%) CISM
6 2 (1.55%) CISSP
6 2 (1.55%) Master's Degree
7 1 (0.78%) CCNA
Quality Assurance & Compliance
1 12 (9.30%) QA
2 6 (4.65%) Data Quality
3 3 (2.33%) GDPR
4 2 (1.55%) ISO/IEC 27001
4 2 (1.55%) NIST
4 2 (1.55%) PCI DSS
4 2 (1.55%) SLA
5 1 (0.78%) MiFID
5 1 (0.78%) PSD2
System Software
1 8 (6.20%) Docker
2 6 (4.65%) VMware Infrastructure
3 5 (3.88%) VMware ESXi
4 3 (2.33%) Active Directory
4 3 (2.33%) Hyper-V
5 2 (1.55%) Firmware
Systems Management
1 13 (10.08%) Ansible
2 8 (6.20%) Grafana
2 8 (6.20%) Kubernetes
3 7 (5.43%) Nagios
3 7 (5.43%) Single Sign-On
4 5 (3.88%) Terraform
5 3 (2.33%) Microsoft Intune
5 3 (2.33%) Prometheus
5 3 (2.33%) SCCM
5 3 (2.33%) vCenter Server
6 2 (1.55%) Progress Chef
6 2 (1.55%) Red Hat Satellite
6 2 (1.55%) SCOM
Vendors
1 19 (14.73%) Microsoft
2 9 (6.98%) Murex
2 9 (6.98%) Red Hat
3 8 (6.20%) VMware
4 6 (4.65%) SolarWinds
5 5 (3.88%) Oracle
6 4 (3.10%) Alteryx
6 4 (3.10%) Cisco
6 4 (3.10%) Databricks
6 4 (3.10%) FIS
6 4 (3.10%) Salesforce
6 4 (3.10%) SimCorp
7 3 (2.33%) Anaplan
7 3 (2.33%) Bloomberg
7 3 (2.33%) FactSet
7 3 (2.33%) Fortinet
7 3 (2.33%) Mitel
7 3 (2.33%) NetApp
7 3 (2.33%) Refinitiv
7 3 (2.33%) Splunk