JIRA Jobs in the City of London

Atlassian JIRA
Central London > City of London

The following table provides summary statistics for permanent job vacancies advertised in the City of London with a requirement for JIRA skills. Included is a benchmarking guide to the salaries offered in vacancies that have cited JIRA over the 6 months to 26 April 2024 with a comparison to the same period in the previous 2 years.

6 months to
26 Apr 2024
Same period 2023 Same period 2022
Rank 84 77 47
Rank change year-on-year -7 -30 +69
Permanent jobs citing JIRA 103 186 410
As % of all permanent jobs advertised in the City of London 3.06% 3.89% 5.82%
As % of the Development Applications category 19.81% 19.06% 26.85%
Number of salaries quoted 81 162 348
10th Percentile £46,250 £47,500 £37,500
25th Percentile £55,000 £55,000 £54,688
Median annual salary (50th Percentile) £75,000 £73,750 £70,000
Median % change year-on-year +1.69% +5.36% +3.70%
75th Percentile £87,500 £101,250 £87,500
90th Percentile £93,750 £121,750 £107,500
Central London median annual salary £73,750 £73,750 £70,000
% change year-on-year - +5.36% +3.70%

All Development Application Skills
City of London

JIRA is in the Development Applications category. The following table is for comparison with the above and provides summary statistics for all permanent job vacancies advertised in the City of London with a requirement for development application skills.

Permanent vacancies with a requirement for development application skills 520 976 1,527
As % of all permanent jobs advertised in the City of London 15.43% 20.41% 21.68%
Number of salaries quoted 404 883 1,325
10th Percentile £47,875 £51,250 £48,750
25th Percentile £62,500 £63,750 £60,000
Median annual salary (50th Percentile) £85,000 £80,000 £72,500
Median % change year-on-year +6.25% +10.34% -
75th Percentile £102,500 £100,000 £93,750
90th Percentile £115,000 £108,750 £103,750
Central London median annual salary £82,500 £80,000 £72,500
% change year-on-year +3.13% +10.34% -

JIRA
Job Vacancy Trend in the City of London

Job postings citing JIRA as a proportion of all IT jobs advertised in the City of London.
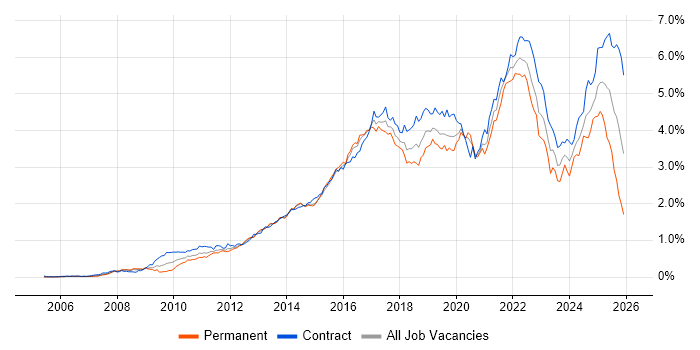
Job vacancy trend for JIRA in the City of London

JIRA
Salary Trend in the City of London

3-month moving average salary quoted in jobs citing JIRA in the City of London.

Salary trend for JIRA in the City of London

JIRA
Salary Histogram in the City of London

Salary distribution for jobs citing JIRA in the City of London over the 6 months to 26 April 2024.

Salary histogram for JIRA in the City of London

JIRA
Job Locations in the City of London

The table below looks at the demand and provides a guide to the median salaries quoted in IT jobs citing JIRA within the City of London region over the 6 months to 26 April 2024. The 'Rank Change' column provides an indication of the change in demand within each location based on the same 6 month period last year.

Location Rank Change
on Same Period
Last Year
Matching
Permanent
IT Job Ads
Median Salary
Past 6 Months
Median Salary
% Change
on Same Period
Last Year
Live
Jobs
London Bridge +24 1 £72,500 -
JIRA
Central London

JIRA
Co-occurring Skills and Capabilities in the City of London by Category

The follow tables expand on the table above by listing co-occurrences grouped by category. The same employment type, locality and period is covered with up to 20 co-occurrences shown in each of the following categories:

Application Platforms
1 27 (26.21%) Confluence
2 18 (17.48%) Microsoft Exchange
3 12 (11.65%) CMS
4 5 (4.85%) SharePoint
5 1 (0.97%) Apache Airflow
5 1 (0.97%) Apache Spark
5 1 (0.97%) Site Server
Applications
1 8 (7.77%) Photoshop
2 5 (4.85%) Microsoft Office
3 4 (3.88%) MS Visio
4 2 (1.94%) Trello
5 1 (0.97%) Microsoft Project
5 1 (0.97%) Notion
Business Applications
1 12 (11.65%) SDL Web 8
2 2 (1.94%) Magento
Cloud Services
1 42 (40.78%) Azure
2 22 (21.36%) Microsoft 365
3 21 (20.39%) Entra ID
4 16 (15.53%) AWS
5 13 (12.62%) Azure DevOps
6 8 (7.77%) Adobe Creative Cloud
6 8 (7.77%) NuGet
7 7 (6.80%) GitHub
8 5 (4.85%) Miro
8 5 (4.85%) Serverless
9 4 (3.88%) AWS Lambda
9 4 (3.88%) OpenShift
10 3 (2.91%) ClickUp
10 3 (2.91%) Slack
11 2 (1.94%) Asana
11 2 (1.94%) BrowserStack
11 2 (1.94%) GCP
11 2 (1.94%) SaaS
12 1 (0.97%) OneDrive
12 1 (0.97%) Salesforce Commerce Cloud
Communications & Networking
1 3 (2.91%) TCP/IP
2 1 (0.97%) DNS
2 1 (0.97%) Firewall
2 1 (0.97%) FTP
2 1 (0.97%) SSL
Database & Business Intelligence
1 21 (20.39%) SQL Server
2 5 (4.85%) NoSQL
3 4 (3.88%) Big Data
3 4 (3.88%) MongoDB
4 3 (2.91%) PostgreSQL
5 2 (1.94%) Data Vault
5 2 (1.94%) Delta Lake
5 2 (1.94%) Elasticsearch
6 1 (0.97%) Apache Hive
6 1 (0.97%) Data Lake
6 1 (0.97%) Data Mart
6 1 (0.97%) Metadata
Development Applications
1 23 (22.33%) Git
2 14 (13.59%) TeamCity
3 12 (11.65%) Moq
3 12 (11.65%) NUnit
4 9 (8.74%) SpecFlow
5 8 (7.77%) git-flow
5 8 (7.77%) Octopus Deploy
5 8 (7.77%) Sourcetree
5 8 (7.77%) Visual Studio
6 6 (5.83%) GitLab
7 5 (4.85%) Jenkins
8 4 (3.88%) Artifactory
9 3 (2.91%) Cucumber
9 3 (2.91%) Snyk
10 2 (1.94%) Appium
10 2 (1.94%) Bitbucket
10 2 (1.94%) Postman
10 2 (1.94%) Zephyr
11 1 (0.97%) SoapUI
11 1 (0.97%) WebDriver
General
1 43 (41.75%) Social Skills
2 25 (24.27%) Finance
3 19 (18.45%) Banking
4 15 (14.56%) Marketing
5 11 (10.68%) Retail Banking
6 8 (7.77%) Analytical Skills
7 3 (2.91%) Advertising
8 2 (1.94%) Front Office
9 1 (0.97%) Back Office
9 1 (0.97%) Financial Institution
9 1 (0.97%) German Language
9 1 (0.97%) Influencing Skills
9 1 (0.97%) Legal
9 1 (0.97%) Organisational Skills
9 1 (0.97%) Police
9 1 (0.97%) Presentation Skills
Job Titles
1 28 (27.18%) Developer
2 26 (25.24%) Lead
3 20 (19.42%) Full Stack Developer
4 15 (14.56%) C# Developer
4 15 (14.56%) Full-Stack C# Developer
4 15 (14.56%) Senior
5 10 (9.71%) Senior Developer
5 10 (9.71%) Team Leader
6 8 (7.77%) React Developer
6 8 (7.77%) Senior C# Developer
6 8 (7.77%) Senior Full Stack Developer
6 8 (7.77%) Service Desk Team Leader
7 7 (6.80%) .NET Developer
7 7 (6.80%) Analyst
7 7 (6.80%) C# .NET Developer
7 7 (6.80%) Full Stack .NET Developer
7 7 (6.80%) Infrastructure Manager
8 6 (5.83%) Angular Developer
9 5 (4.85%) Business Analyst
10 4 (3.88%) Consultant
Libraries, Frameworks & Software Standards
1 26 (25.24%) RESTful
2 21 (20.39%) .NET
3 19 (18.45%) .NET Framework
3 19 (18.45%) ASP.NET
3 19 (18.45%) CSS
3 19 (18.45%) Entity Framework
3 19 (18.45%) HTML
3 19 (18.45%) jQuery
3 19 (18.45%) React
4 13 (12.62%) SOAP
5 12 (11.65%) ASP.NET MVC
5 12 (11.65%) ASP.NET MVC 5
5 12 (11.65%) Semantic HTML
5 12 (11.65%) Web Services
6 11 (10.68%) Node.js
7 9 (8.74%) GraphQL
8 8 (7.77%) Autofac
8 8 (7.77%) Code First Entity Framework
8 8 (7.77%) Ninject
8 8 (7.77%) XML
Miscellaneous
1 18 (17.48%) Clustering
2 12 (11.65%) Legacy Code
3 10 (9.71%) Greenfield Project
4 5 (4.85%) Product Ownership
5 3 (2.91%) Public Cloud
5 3 (2.91%) Self-Motivation
6 2 (1.94%) Data Centre
6 2 (1.94%) Data Structures
6 2 (1.94%) Fixed Income
6 2 (1.94%) Onboarding
6 2 (1.94%) Reinsurance
7 1 (0.97%) Derivative
7 1 (0.97%) Equities
7 1 (0.97%) Foreign Exchange (FX)
7 1 (0.97%) iPad
7 1 (0.97%) iPhone
7 1 (0.97%) Legacy Applications
7 1 (0.97%) Smartphone
7 1 (0.97%) Social Media
7 1 (0.97%) Wiki
Operating Systems
1 29 (28.16%) Windows
2 19 (18.45%) Windows Server
3 9 (8.74%) Linux
4 2 (1.94%) Android
4 2 (1.94%) Apple iOS
4 2 (1.94%) Debian
4 2 (1.94%) Ubuntu
4 2 (1.94%) Unix
4 2 (1.94%) Windows 10
5 1 (0.97%) Mac OS
5 1 (0.97%) Red Hat Enterprise Linux
5 1 (0.97%) Windows Server 2012
5 1 (0.97%) Windows Server 2016
5 1 (0.97%) Windows Server 2019
Processes & Methodologies
1 52 (50.49%) Agile
2 36 (34.95%) DevOps
3 31 (30.10%) Scrum
4 26 (25.24%) Continuous Improvement
5 23 (22.33%) Backlog Management
6 21 (20.39%) Performance Management
6 21 (20.39%) Problem-Solving
7 20 (19.42%) Full Stack Development
7 20 (19.42%) Information Security
8 18 (17.48%) Resource Management
8 18 (17.48%) Systems Engineering
9 17 (16.50%) Kanban
10 16 (15.53%) Line Management
11 15 (14.56%) Project Management
11 15 (14.56%) Roadmaps
12 14 (13.59%) Mentoring
13 13 (12.62%) Computer Science
13 13 (12.62%) E-Commerce
13 13 (12.62%) Unit Testing
14 12 (11.65%) Responsive Web Design
Programming Languages
1 21 (20.39%) JavaScript
1 21 (20.39%) SQL
2 20 (19.42%) C#
2 20 (19.42%) PowerShell
3 12 (11.65%) T-SQL
4 9 (8.74%) Java
5 8 (7.77%) XPath
6 5 (4.85%) Scala
7 4 (3.88%) Python
8 1 (0.97%) Bash
8 1 (0.97%) C++
8 1 (0.97%) Kotlin
8 1 (0.97%) Perl
8 1 (0.97%) TypeScript
Qualifications
1 19 (18.45%) Degree
2 11 (10.68%) SC Cleared
2 11 (10.68%) Security Cleared
3 4 (3.88%) CSPO
4 1 (0.97%) Computer Science Degree
4 1 (0.97%) MCDST
4 1 (0.97%) MCP
4 1 (0.97%) MCSA
4 1 (0.97%) Microsoft Certification
Quality Assurance & Compliance
1 13 (12.62%) QA
2 2 (1.94%) Data Quality
3 1 (0.97%) PMO
System Software
1 22 (21.36%) Active Directory
2 18 (17.48%) VMware ESXi
3 2 (1.94%) Docker
4 1 (0.97%) Firmware
4 1 (0.97%) VMware Infrastructure
Systems Management
1 18 (17.48%) Microsoft Clustering
1 18 (17.48%) Microsoft Intune
1 18 (17.48%) Single Sign-On
1 18 (17.48%) vCenter Server
2 5 (4.85%) Kubernetes
3 3 (2.91%) Istio
3 3 (2.91%) Terraform
4 2 (1.94%) Kibana
4 2 (1.94%) logstash
5 1 (0.97%) Ansible
5 1 (0.97%) Grafana
5 1 (0.97%) Progress Chef
5 1 (0.97%) Puppet
5 1 (0.97%) Salt
5 1 (0.97%) SCCM
Vendors
1 28 (27.18%) ServiceNow
2 19 (18.45%) Sun
2 19 (18.45%) VMware
3 18 (17.48%) Commvault
4 12 (11.65%) Microsoft
5 9 (8.74%) Adobe
6 8 (7.77%) Cognizant
7 5 (4.85%) Oracle
8 4 (3.88%) BiZZdesign
8 4 (3.88%) Google
9 2 (1.94%) Apple
9 2 (1.94%) Databricks
9 2 (1.94%) Informatica
9 2 (1.94%) Salesforce
10 1 (0.97%) Cadence
10 1 (0.97%) IBM
10 1 (0.97%) Murex
10 1 (0.97%) Progress
10 1 (0.97%) Red Hat
10 1 (0.97%) Sybase