XenDesktop Jobs in England

Citrix XenDesktop
UK > England

The table below provides summary statistics for permanent job vacancies advertised in England requiring XenDesktop skills. It includes a benchmarking guide to the annual salaries offered in vacancies that cited XenDesktop over the 6 months leading up to 26 October 2024, comparing them to the same period in the previous two years.

6 months to
26 Oct 2024
Same period 2023 Same period 2022
Rank 652 609 897
Rank change year-on-year -43 +288 -47
Permanent jobs citing XenDesktop 110 93 171
As % of all permanent jobs advertised in England 0.17% 0.18% 0.14%
As % of the System Software category 1.53% 1.05% 0.90%
Number of salaries quoted 108 36 141
10th Percentile £31,600 £31,875 £32,500
25th Percentile £40,000 £35,688 £37,750
Median annual salary (50th Percentile) £68,000 £40,000 £45,000
Median % change year-on-year +70.00% -11.11% +12.50%
75th Percentile £82,500 £55,000 £50,000
90th Percentile £112,500 £65,000 £57,500
UK median annual salary £68,000 £40,000 £45,000
% change year-on-year +70.00% -11.11% +12.50%

All System Software Skills
England

XenDesktop falls under the System Software category. For comparison with the information above, the following table provides summary statistics for all permanent job vacancies requiring system software skills in England.

Permanent vacancies with a requirement for system software skills 7,168 8,826 19,032
As % of all permanent jobs advertised in England 10.76% 17.14% 15.77%
Number of salaries quoted 3,993 6,828 12,070
10th Percentile £30,025 £28,500 £29,000
25th Percentile £40,000 £36,722 £37,795
Median annual salary (50th Percentile) £55,000 £55,000 £55,000
Median % change year-on-year - - -4.35%
75th Percentile £75,000 £75,000 £78,750
90th Percentile £95,000 £90,000 £95,000
UK median annual salary £55,000 £55,000 £55,000

XenDesktop
Job Vacancy Trend in England

Job postings citing XenDesktop as a proportion of all IT jobs advertised in England.
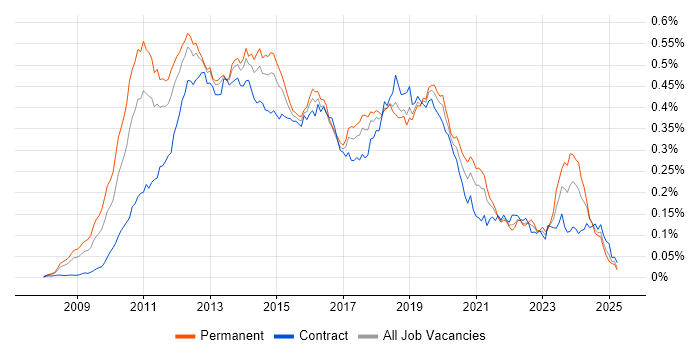
Job vacancy trend for XenDesktop in England

XenDesktop
Salary Trend in England

3-month moving average salary quoted in jobs citing XenDesktop in England.

Salary trend for XenDesktop in England

XenDesktop
Salary Histogram in England

Salary distribution for jobs citing XenDesktop in England over the 6 months to 26 October 2024.

Salary histogram for XenDesktop in England

XenDesktop
Job Locations in England

The table below looks at the demand and provides a guide to the median salaries quoted in IT jobs citing XenDesktop within the England region over the 6 months to 26 October 2024. The 'Rank Change' column provides an indication of the change in demand within each location based on the same 6 month period last year.

Location Rank Change
on Same Period
Last Year
Matching
Permanent
IT Job Ads
Median Salary
Past 6 Months
Median Salary
% Change
on Same Period
Last Year
Live
Jobs
London +29 70 £75,000 +89.87% 6
Midlands -29 20 £68,000 +53.67% 1
South West +16 16 £30,750 -14.58% 5
West Midlands -31 14 £68,000 +53.67%
East Midlands - 6 £40,000 - 1
North of England -12 3 £32,500 -18.75% 1
North West -31 3 £32,500 -21.21% 1
South East -33 1 £51,000 -15.00% 1
XenDesktop
UK

XenDesktop
Co-occurring Skills and Capabilities in England by Category

The follow tables expand on the table above by listing co-occurrences grouped by category. The same employment type, locality and period is covered with up to 20 co-occurrences shown in each of the following categories:

Application Platforms
1 36 (32.73%) Microsoft Exchange
2 13 (11.82%) SharePoint
2 13 (11.82%) SharePoint 2010
2 13 (11.82%) SharePoint 2013
Applications
1 11 (10.00%) Microsoft Office
2 1 (0.91%) Microsoft Excel
Cloud Services
1 49 (44.55%) Azure
2 42 (38.18%) AWS
3 38 (34.55%) Microsoft 365
4 22 (20.00%) GCP
5 9 (8.18%) Mimecast
6 8 (7.27%) Dynamics 365
7 5 (4.55%) Power Platform
8 3 (2.73%) Azure DevOps
Communications & Networking
1 42 (38.18%) Remote Desktop
2 24 (21.82%) Firewall
3 19 (17.27%) LAN
4 18 (16.36%) WAN
5 14 (12.73%) DHCP
5 14 (12.73%) DNS
6 12 (10.91%) SAN
7 8 (7.27%) NetScaler
8 5 (4.55%) Cisco Nexus
Database & Business Intelligence
1 20 (18.18%) Amazon RDS
2 5 (4.55%) Power BI
Development Applications
1 32 (29.09%) GitLab
2 12 (10.91%) Jenkins
General
1 67 (60.91%) Finance
2 32 (29.09%) Banking
3 14 (12.73%) Inclusion and Diversity
4 13 (11.82%) Analytical Skills
5 12 (10.91%) Investment Banking
6 8 (7.27%) Social Skills
7 7 (6.36%) Documentation Skills
8 5 (4.55%) Aerospace
8 5 (4.55%) Manufacturing
9 4 (3.64%) Public Sector
10 1 (0.91%) Law
10 1 (0.91%) Legal
10 1 (0.91%) Social Housing
Job Titles
1 37 (33.64%) Infrastructure Engineer
2 34 (30.91%) Analyst
3 24 (21.82%) Technical Analyst
4 23 (20.91%) Citrix Analyst
5 20 (18.18%) Automation Engineer
5 20 (18.18%) AWS Engineer
5 20 (18.18%) AWS Infrastructure Engineer
5 20 (18.18%) Python Engineer
6 19 (17.27%) Cloud Engineer
6 19 (17.27%) Support Engineer
7 18 (16.36%) 2nd Line Support
8 15 (13.64%) 2nd Line Engineer
8 15 (13.64%) 2nd Line Support Engineer
8 15 (13.64%) Technical Engineer
9 14 (12.73%) Citrix Engineer
10 13 (11.82%) Cloud Technical Analyst
11 11 (10.00%) Azure Engineer
12 8 (7.27%) Microsoft 365 Engineer
13 7 (6.36%) Senior
14 6 (5.45%) Technical Services Analyst
Libraries, Frameworks & Software Standards
1 9 (8.18%) ADO
Miscellaneous
1 10 (9.09%) Replication
2 9 (8.18%) Driving Licence
2 9 (8.18%) Public Cloud
3 6 (5.45%) Management Information System
4 4 (3.64%) Data Centre
5 1 (0.91%) Self-Motivation
Operating Systems
1 73 (66.36%) Windows
2 48 (43.64%) Windows Server
3 20 (18.18%) Linux
4 17 (15.45%) Red Hat Enterprise Linux
5 13 (11.82%) Windows 10
6 10 (9.09%) Android
6 10 (9.09%) Apple iOS
7 5 (4.55%) Windows Server 2016
7 5 (4.55%) Windows Server 2019
8 3 (2.73%) Unix
Processes & Methodologies
1 37 (33.64%) Infrastructure Engineering
2 35 (31.82%) DevOps
3 31 (28.18%) Infrastructure Automation
4 25 (22.73%) ITIL
5 23 (20.91%) Platform Engineering
6 20 (18.18%) Asset Management
7 18 (16.36%) Mobile Device Management
7 18 (16.36%) Server Virtualisation
8 14 (12.73%) Investment Management
8 14 (12.73%) Task Automation
9 12 (10.91%) Service Management
10 10 (9.09%) Customer Service
10 10 (9.09%) Problem-Solving
10 10 (9.09%) Ticket Management
11 9 (8.18%) Identity Access Management
11 9 (8.18%) Remote Monitoring and Management
12 8 (7.27%) Project Delivery
13 6 (5.45%) Project Management
14 5 (4.55%) Data Security
14 5 (4.55%) Infrastructure as Code
Programming Languages
1 57 (51.82%) PowerShell
2 32 (29.09%) Python
3 12 (10.91%) Bash
3 12 (10.91%) Korn
3 12 (10.91%) Perl
3 12 (10.91%) Ruby
4 4 (3.64%) SQL
Qualifications
1 17 (15.45%) MCITP
1 17 (15.45%) Microsoft Certification
2 15 (13.64%) SC Cleared
2 15 (13.64%) Security Cleared
3 14 (12.73%) Citrix Certification
4 13 (11.82%) MCSE
5 9 (8.18%) CCA
5 9 (8.18%) MCP
5 9 (8.18%) VMware Certified Professional (VCP)
6 5 (4.55%) CCNA
6 5 (4.55%) Cisco Certification
6 5 (4.55%) Degree
6 5 (4.55%) DV Cleared
6 5 (4.55%) RHCSA
7 4 (3.64%) Azure Certification
7 4 (3.64%) CESG Certified Professional
8 2 (1.82%) BPSS Clearance
9 1 (0.91%) Computer Science Degree
Quality Assurance & Compliance
1 6 (5.45%) SLA
2 5 (4.55%) QA
System Software
1 96 (87.27%) XenApp
2 76 (69.09%) VMware Infrastructure
3 58 (52.73%) Active Directory
4 32 (29.09%) Docker
5 31 (28.18%) Hyper-V
6 9 (8.18%) vSphere
7 5 (4.55%) VMware Workstation
8 3 (2.73%) Virtual Desktop
8 3 (2.73%) VMware ESXi
Systems Management
1 55 (50.00%) Terraform
2 34 (30.91%) SCCM
3 32 (29.09%) Ansible
4 27 (24.55%) Microsoft Intune
5 14 (12.73%) Active Directory Federation Services
6 12 (10.91%) Puppet
6 12 (10.91%) Red Hat Satellite
7 9 (8.18%) Backup Exec
7 9 (8.18%) Single Sign-On
7 9 (8.18%) Symantec Endpoint Protection
8 5 (4.55%) EMC NetWorker
9 4 (3.64%) vCenter Server
Vendors
1 110 (100.00%) Citrix
2 88 (80.00%) VMware
3 78 (70.91%) Microsoft
4 32 (29.09%) Dell
5 27 (24.55%) Symantec
6 23 (20.91%) Cisco
7 22 (20.00%) Google
8 18 (16.36%) HP
9 17 (15.45%) Red Hat
10 12 (10.91%) TOWER Software
10 12 (10.91%) Zscaler
11 10 (9.09%) Fortinet
11 10 (9.09%) Veeam
12 9 (8.18%) Ivanti
12 9 (8.18%) N-able
12 9 (8.18%) Veritas
13 6 (5.45%) ServiceNow
14 5 (4.55%) EMC
15 3 (2.73%) Nexthink
16 1 (0.91%) iManage