Technical Analyst Jobs in England

Technical Analyst
UK > England

The median Technical Analyst salary in England is £52,500 per year according to job vacancies posted during the 6 months to 16 April 2024.

The first table below provides salary benchmarking and summary statistics including a comparison to same period in the previous 2 years.

6 months to
16 Apr 2024
Same period 2023 Same period 2022
Rank 439 558 566
Rank change year-on-year +119 +8 -40
Permanent jobs requiring a Technical Analyst 432 441 686
As % of all permanent jobs advertised in England 0.51% 0.46% 0.53%
As % of the Job Titles category 0.54% 0.50% 0.55%
Number of salaries quoted 326 312 561
10th Percentile £26,250 £31,250 £26,000
25th Percentile £32,500 £41,250 £36,250
Median annual salary (50th Percentile) £52,500 £52,500 £50,000
Median % change year-on-year - +5.00% +11.11%
75th Percentile £73,750 £67,031 £65,000
90th Percentile £96,250 £77,500 £73,750
UK median annual salary £50,000 £52,500 £50,000
% change year-on-year -4.76% +5.00% +11.11%

All Permanent IT Job Vacancies
England

The following table is for comparison with the above and includes summary statistics for all permanent IT job vacancies advertised in England. Most job vacancies include a discernible job title that can be normalized. As such, the figures in the second row provide an indication of the number of permanent jobs in our overall sample.

Permanent vacancies in England with a recognized job title 79,484 88,194 124,195
% of permanent jobs with a recognized job title 94.49% 91.69% 96.04%
Number of salaries quoted 59,920 55,480 76,097
10th Percentile £28,500 £32,500 £32,500
25th Percentile £38,250 £45,000 £42,676
Median annual salary (50th Percentile) £54,000 £60,000 £60,000
Median % change year-on-year -10.00% - +9.09%
75th Percentile £72,433 £82,500 £80,000
90th Percentile £91,250 £100,000 £97,500
UK median annual salary £53,308 £60,000 £60,000
% change year-on-year -11.15% - +9.09%

Technical Analyst
Job Vacancy Trend in England

Job postings that featured Technical Analyst in the job title as a proportion of all IT jobs advertised in England.
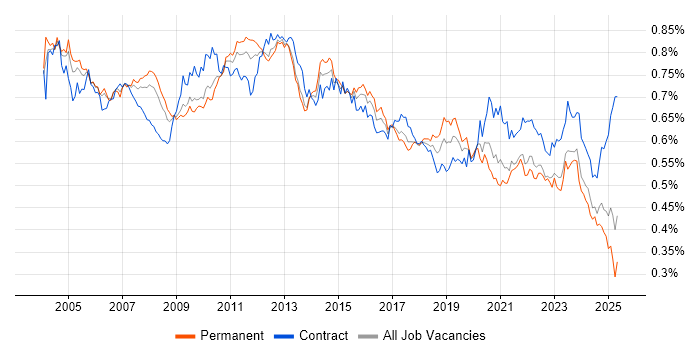
Job vacancy trend for Technical Analyst in England

Technical Analyst
Salary Trend in England

3-month moving average salary quoted in jobs citing Technical Analyst in England.

Salary trend for Technical Analyst in England

Technical Analyst
Salary Histogram in England

Salary distribution for jobs citing Technical Analyst in England over the 6 months to 16 April 2024.

Salary histogram for Technical Analyst in England

Technical Analyst
Job Locations in England

The table below looks at the demand and provides a guide to the median salaries quoted in IT jobs citing Technical Analyst within the England region over the 6 months to 16 April 2024. The 'Rank Change' column provides an indication of the change in demand within each location based on the same 6 month period last year.

Location Rank Change
on Same Period
Last Year
Matching
Permanent
IT Job Ads
Median Salary
Past 6 Months
Median Salary
% Change
on Same Period
Last Year
Live
Jobs
London +102 162 £75,000 +25.00% 33
North of England +65 88 £35,000 -22.22% 12
North West +52 71 £40,000 -10.11% 12
South East +53 65 £42,500 -10.05% 8
South West +16 47 £34,000 -8.04% 9
Midlands +21 40 £37,500 -21.05% 4
East of England +27 30 £35,000 -26.32% 6
West Midlands +46 29 £37,500 -21.05% 1
Yorkshire +64 13 £45,000 -
East Midlands -15 11 £40,250 -21.46% 3
North East -2 4 £30,000 -38.46%
Technical Analyst
UK

Technical Analyst Skill Set
Top 30 Co-occurring Skills and Capabilities in England

For the 6 months to 16 April 2024, Technical Analyst job roles required the following skills and capabilities in order of popularity. The figures indicate the absolute number co-occurrences and as a proportion of all permanent job ads across the England region featuring Technical Analyst in the job title.

1 146 (33.80%) Social Skills
2 120 (27.78%) SQL
3 93 (21.53%) Finance
4 90 (20.83%) Problem-Solving
5 83 (19.21%) Analytical Skills
6 80 (18.52%) Windows
7 73 (16.90%) Degree
8 70 (16.20%) Agile
9 69 (15.97%) ITIL
10 59 (13.66%) Microsoft
10 59 (13.66%) Active Directory
11 57 (13.19%) Azure
12 55 (12.73%) Python
13 53 (12.27%) User Stories
13 53 (12.27%) Customer Service
14 48 (11.11%) Asset Management
15 45 (10.42%) SQL Server
16 44 (10.19%) Banking
16 44 (10.19%) Public Sector
17 37 (8.56%) Analytics
18 36 (8.33%) Windows Server
18 36 (8.33%) Back Office
19 35 (8.10%) Hedge funds
19 35 (8.10%) Investment Management
19 35 (8.10%) Security Cleared
20 34 (7.87%) Front Office
20 34 (7.87%) Business Analysis
21 33 (7.64%) C#
21 33 (7.64%) Mentoring
22 32 (7.41%) Windows 10

Technical Analyst Skill Set
Co-occurring Skills and Capabilities in England by Category

The follow tables expand on the table above by listing co-occurrences grouped by category. The same employment type, locality and period is covered with up to 20 co-occurrences shown in each of the following categories:

Application Platforms
1 15 (3.47%) Confluence
2 14 (3.24%) SharePoint
3 7 (1.62%) WebSphere
4 5 (1.16%) Microsoft Exchange
5 2 (0.46%) Apache
5 2 (0.46%) IIS
5 2 (0.46%) Moodle
5 2 (0.46%) Tomcat
6 1 (0.23%) Appian
6 1 (0.23%) WebSphere Application Server
Applications
1 30 (6.94%) Microsoft Office
2 8 (1.85%) Microsoft Excel
3 6 (1.39%) Trello
4 4 (0.93%) MS Visio
5 2 (0.46%) Microsoft PowerPoint
6 1 (0.23%) Microsoft Project
Business Applications
1 23 (5.32%) Dynamics CRM
2 15 (3.47%) NEC Housing
3 3 (0.69%) Oracle Financials
4 2 (0.46%) Misys Midas
4 2 (0.46%) Payment Gateway
5 1 (0.23%) Bloomberg AIM
Cloud Services
1 57 (13.19%) Azure
2 28 (6.48%) Microsoft 365
3 27 (6.25%) SaaS
4 25 (5.79%) Power Platform
5 20 (4.63%) AWS
6 12 (2.78%) Power Automate
7 5 (1.16%) Azure Data Factory
7 5 (1.16%) Azure Synapse Analytics
7 5 (1.16%) Dynamics 365
7 5 (1.16%) Google Workspace
8 4 (0.93%) GCP
8 4 (0.93%) GitHub
9 3 (0.69%) Entra ID
9 3 (0.69%) PowerApps
10 2 (0.46%) Cloud Computing
10 2 (0.46%) Nutanix
11 1 (0.23%) Apigee
11 1 (0.23%) Azure Service Bus
11 1 (0.23%) Boomi
11 1 (0.23%) Microsoft Purview
Communications & Networking
1 11 (2.55%) Firewall
2 9 (2.08%) LAN
3 6 (1.39%) HTTP
3 6 (1.39%) SAN
3 6 (1.39%) TCP/IP
4 5 (1.16%) DNS
4 5 (1.16%) VSAT
4 5 (1.16%) Wi-Fi
4 5 (1.16%) Wireless
5 4 (0.93%) ADSL
5 4 (0.93%) Broadband
5 4 (0.93%) VLAN
5 4 (0.93%) WAN
6 3 (0.69%) DHCP
6 3 (0.69%) Internet
7 2 (0.46%) FTP
7 2 (0.46%) SMTP
8 1 (0.23%) DSL
8 1 (0.23%) Intrusion Detection
Database & Business Intelligence
1 45 (10.42%) SQL Server
2 31 (7.18%) SQL Server Integration Services
3 22 (5.09%) Power BI
4 10 (2.31%) SQL Server Reporting Services
5 9 (2.08%) Relational Database
6 8 (1.85%) Tableau
7 7 (1.62%) Big Data
8 6 (1.39%) Snowflake Schema
8 6 (1.39%) Star Schema
9 4 (0.93%) Ataccama
9 4 (0.93%) Metadata
10 3 (0.69%) MongoDB
10 3 (0.69%) MySQL
10 3 (0.69%) RDBMS
11 2 (0.46%) SQL Server Analysis Services
12 1 (0.23%) Azure SQL Database
12 1 (0.23%) BigQuery
12 1 (0.23%) Data Warehouse
12 1 (0.23%) GIS
12 1 (0.23%) Looker
Development Applications
1 27 (6.25%) JIRA
2 5 (1.16%) Git
3 4 (0.93%) GitLab
4 1 (0.23%) JMeter
4 1 (0.23%) LoadRunner
4 1 (0.23%) Postman
General
1 146 (33.80%) Social Skills
2 93 (21.53%) Finance
3 83 (19.21%) Analytical Skills
4 44 (10.19%) Banking
4 44 (10.19%) Public Sector
5 36 (8.33%) Back Office
6 34 (7.87%) Front Office
7 29 (6.71%) Organisational Skills
8 19 (4.40%) Retail
9 12 (2.78%) Legal
9 12 (2.78%) Manufacturing
10 11 (2.55%) Law
11 10 (2.31%) Telecoms
12 8 (1.85%) French Language
12 8 (1.85%) Military
13 7 (1.62%) Billing
13 7 (1.62%) Health Technology
14 6 (1.39%) Financial Institution
15 5 (1.16%) Inclusion and Diversity
15 5 (1.16%) Portuguese Language
Libraries, Frameworks & Software Standards
1 12 (2.78%) .NET
2 9 (2.08%) FIX Protocol
3 7 (1.62%) .NET Framework
4 6 (1.39%) REST
5 4 (0.93%) React
6 3 (0.69%) HTML
6 3 (0.69%) JSON
6 3 (0.69%) Laravel
6 3 (0.69%) Next.js
6 3 (0.69%) React Native
7 2 (0.46%) FpML
7 2 (0.46%) LAMP
7 2 (0.46%) LDAP
7 2 (0.46%) Murex MxML
7 2 (0.46%) Oracle Fusion
8 1 (0.23%) Entity Framework
8 1 (0.23%) Gherkin
8 1 (0.23%) JSON Schema
8 1 (0.23%) PySpark
8 1 (0.23%) Swagger
Miscellaneous
1 35 (8.10%) Hedge funds
2 30 (6.94%) Management Information System
3 28 (6.48%) Derivative
3 28 (6.48%) Product Ownership
4 22 (5.09%) PMI
5 16 (3.70%) Onboarding
5 16 (3.70%) Self-Motivation
6 13 (3.01%) Foreign Exchange (FX)
7 10 (2.31%) Equities
8 9 (2.08%) Fixed Income
8 9 (2.08%) Housing Association
9 7 (1.62%) Data Centre
9 7 (1.62%) Social Media
10 5 (1.16%) Data Structures
10 5 (1.16%) SCADA
11 4 (0.93%) Cyberattack
11 4 (0.93%) Driving Licence
11 4 (0.93%) Greenfield Project
11 4 (0.93%) Reference Data
12 3 (0.69%) FMCG
Operating Systems
1 80 (18.52%) Windows
2 36 (8.33%) Windows Server
3 32 (7.41%) Windows 10
4 26 (6.02%) Linux
5 16 (3.70%) Windows Server 2016
5 16 (3.70%) Windows Server 2019
6 9 (2.08%) Windows Server 2012
7 6 (1.39%) SUSE
7 6 (1.39%) SUSE Linux Enterprise Server
8 5 (1.16%) Apple iOS
9 2 (0.46%) Android
10 1 (0.23%) Mac OS
Processes & Methodologies
1 90 (20.83%) Problem-Solving
2 70 (16.20%) Agile
3 69 (15.97%) ITIL
4 53 (12.27%) Customer Service
4 53 (12.27%) User Stories
5 48 (11.11%) Asset Management
6 37 (8.56%) Analytics
7 35 (8.10%) Investment Management
8 34 (7.87%) Business Analysis
9 33 (7.64%) Mentoring
10 30 (6.94%) Stakeholder Management
11 29 (6.71%) CRM
12 28 (6.48%) ETL
13 27 (6.25%) Information Security
14 26 (6.02%) Mathematics
15 24 (5.56%) Process Improvement
15 24 (5.56%) Roadmaps
16 23 (5.32%) Change Management
16 23 (5.32%) Decision-Making
17 22 (5.09%) Disaster Recovery
Programming Languages
1 120 (27.78%) SQL
2 55 (12.73%) Python
3 33 (7.64%) C#
4 29 (6.71%) T-SQL
5 19 (4.40%) PL/SQL
6 9 (2.08%) Java
7 8 (1.85%) R
8 3 (0.69%) PHP
8 3 (0.69%) PowerShell
9 2 (0.46%) Bash
9 2 (0.46%) JavaScript
10 1 (0.23%) C
10 1 (0.23%) TypeScript
Qualifications
1 73 (16.90%) Degree
2 35 (8.10%) Security Cleared
3 23 (5.32%) SC Cleared
4 22 (5.09%) PMI Certification
5 14 (3.24%) Computer Science Degree
6 11 (2.55%) PRINCE2 Practitioner
7 10 (2.31%) BPSS Clearance
8 6 (1.39%) CCNA
8 6 (1.39%) Cisco Certification
8 6 (1.39%) DBS Check
8 6 (1.39%) IIBA
8 6 (1.39%) Master's Degree
9 4 (0.93%) MCITP
9 4 (0.93%) Microsoft Certification
9 4 (0.93%) Network+ Certification
10 2 (0.46%) CISA
10 2 (0.46%) CISSP
11 1 (0.23%) CISM
11 1 (0.23%) HND
11 1 (0.23%) ISEB
Quality Assurance & Compliance
1 13 (3.01%) Data Quality
2 11 (2.55%) SLA
3 3 (0.69%) QA
4 2 (0.46%) GDPR
4 2 (0.46%) GRC
4 2 (0.46%) ISO/IEC 27001
4 2 (0.46%) NIST
5 1 (0.23%) Cyber Essentials
5 1 (0.23%) ISO 9001
System Software
1 59 (13.66%) Active Directory
2 7 (1.62%) vSphere
3 5 (1.16%) VMware Infrastructure
4 4 (0.93%) Microsoft Virtual Server
4 4 (0.93%) Virtual Servers
5 2 (0.46%) Hyper-V
6 1 (0.23%) BitLocker
Systems Management
1 6 (1.39%) Microsoft Intune
1 6 (1.39%) Tivoli Storage Manager
2 5 (1.16%) Progress Chef
3 3 (0.69%) Jamf Pro
3 3 (0.69%) SCCM
4 1 (0.23%) Grafana
Vendors
1 59 (13.66%) Microsoft
2 15 (3.47%) NEC
3 14 (3.24%) VMware
4 12 (2.78%) Oracle
5 9 (2.08%) Adobe
5 9 (2.08%) Apple
5 9 (2.08%) F5
5 9 (2.08%) IBM
5 9 (2.08%) Snow
6 8 (1.85%) Veeam
7 7 (1.62%) Charles River
7 7 (1.62%) Commvault
7 7 (1.62%) ServiceNow
8 6 (1.39%) Cisco
8 6 (1.39%) IFS
9 4 (0.93%) UiPath
10 3 (0.69%) eFront
10 3 (0.69%) Google
11 2 (0.46%) Atlassian
11 2 (0.46%) Fortinet