Network Security Jobs in England

Network Security
UK > England

The table below provides summary statistics for permanent job vacancies advertised in England requiring Network Security skills. It includes a benchmarking guide to the annual salaries offered in vacancies that cited Network Security over the 6 months leading up to 31 May 2025, comparing them to the same period in the previous two years.

6 months to
31 May 2025
Same period 2024 Same period 2023
Rank 277 239 141
Rank change year-on-year -38 -98 +239
Permanent jobs citing Network Security 554 1,031 2,231
As % of all permanent jobs advertised in England 1.12% 1.15% 2.62%
As % of the Communications & Networking category 6.23% 8.48% 16.11%
Number of salaries quoted 434 860 784
10th Percentile £36,250 £31,250 £32,500
25th Percentile £47,688 £45,094 £41,250
Median annual salary (50th Percentile) £60,000 £60,000 £57,500
Median % change year-on-year - +4.35% -4.17%
75th Percentile £82,500 £77,210 £76,250
90th Percentile £95,000 £95,000 £93,550
UK median annual salary £62,500 £60,000 £57,500
% change year-on-year +4.17% +4.35% -4.17%

All Communications and Computer Networking Skills
England

Network Security falls under the Communications and Computer Networking category. For comparison with the information above, the following table provides summary statistics for all permanent job vacancies requiring communications or computer networking skills in England.

Permanent vacancies with a requirement for communications or computer networking skills 8,896 12,155 13,849
As % of all permanent jobs advertised in England 18.04% 13.53% 16.26%
Number of salaries quoted 3,762 8,542 7,007
10th Percentile £25,087 £26,250 £27,750
25th Percentile £29,750 £32,500 £35,500
Median annual salary (50th Percentile) £45,000 £47,500 £50,000
Median % change year-on-year -5.26% -5.00% -4.76%
75th Percentile £65,000 £62,500 £70,000
90th Percentile £83,750 £77,500 £87,500
UK median annual salary £42,500 £47,500 £50,500
% change year-on-year -10.53% -5.94% -3.81%

Network Security
Job Vacancy Trend in England

Job postings citing Network Security as a proportion of all IT jobs advertised in England.
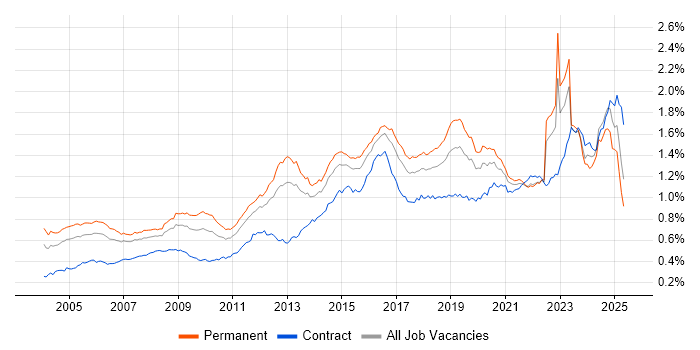
Job vacancy trend for Network Security in England

Network Security
Salary Trend in England

3-month moving average salary quoted in jobs citing Network Security in England.

Salary trend for Network Security in England

Network Security
Salary Histogram in England

Salary distribution for jobs citing Network Security in England over the 6 months to 31 May 2025.

Salary histogram for Network Security in England

Network Security
Job Locations in England

The table below looks at the demand and provides a guide to the median salaries quoted in IT jobs citing Network Security within the England region over the 6 months to 31 May 2025. The 'Rank Change' column provides an indication of the change in demand within each location based on the same 6 month period last year.

Location Rank Change
on Same Period
Last Year
Matching
Permanent
IT Job Ads
Median Salary
Past 6 Months
Median Salary
% Change
on Same Period
Last Year
Live
Jobs
London +10 199 £82,500 +13.79% 234
South East +19 112 £53,000 -11.67% 68
Midlands +29 74 £48,000 +11.04% 52
North of England -82 72 £57,500 +9.52% 70
South West +61 58 £66,763 +2.71% 44
West Midlands +31 55 £48,500 +12.20% 34
Yorkshire +15 40 £57,500 +15.00% 32
East of England +15 25 £49,750 +2.58% 26
East Midlands +31 19 £31,500 -3.08% 16
North West -104 19 £60,000 +12.15% 30
North East +41 13 £57,500 +6.98% 12
Network Security
UK

Network Security
Co-occurring Skills and Capabilities in England by Category

The follow tables expand on the table above by listing co-occurrences grouped by category. The same employment type, locality and period is covered with up to 20 co-occurrences shown in each of the following categories:

Application Platforms
1 43 (7.76%) Microsoft Exchange
2 14 (2.53%) SharePoint
3 4 (0.72%) nginx
4 3 (0.54%) Confluence
5 1 (0.18%) Oracle Workflow
5 1 (0.18%) SAS
5 1 (0.18%) SugarCRM
Applications
1 24 (4.33%) Microsoft Office
2 15 (2.71%) MS Visio
3 7 (1.26%) Microsoft Excel
4 1 (0.18%) Microsoft PowerPoint
Business Applications
1 4 (0.72%) Fidessa
1 4 (0.72%) SAP Business One
2 1 (0.18%) Oracle EBS
2 1 (0.18%) Oracle ERP
2 1 (0.18%) PeopleSoft HCM
2 1 (0.18%) SAP ERP
Cloud Services
1 188 (33.94%) Azure
2 105 (18.95%) AWS
3 71 (12.82%) Microsoft 365
4 55 (9.93%) GCP
5 22 (3.97%) Entra ID
6 19 (3.43%) Azure Sentinel
7 18 (3.25%) IaaS
8 17 (3.07%) SaaS
9 16 (2.89%) AWS CloudFormation
9 16 (2.89%) PaaS
10 14 (2.53%) Cloud Computing
10 14 (2.53%) Serverless
11 13 (2.35%) AWS Lambda
12 11 (1.99%) AWS KMS
12 11 (1.99%) Azure DevOps
13 8 (1.44%) OCI
13 8 (1.44%) OpenShift
14 6 (1.08%) Azure AKS
15 5 (0.90%) Azure ExpressRoute
15 5 (0.90%) Virtual Private Cloud
Communications & Networking
1 312 (56.32%) Firewall
2 143 (25.81%) VPN
3 116 (20.94%) WAN
4 87 (15.70%) LAN
5 86 (15.52%) BGP
6 79 (14.26%) OSPF
7 72 (13.00%) DNS
8 65 (11.73%) TCP/IP
9 59 (10.65%) VLAN
10 54 (9.75%) DHCP
11 50 (9.03%) SD-WAN
12 46 (8.30%) EIGRP
13 42 (7.58%) Internet
14 40 (7.22%) WLAN
15 35 (6.32%) Intrusion Detection
16 33 (5.96%) Wireless
17 30 (5.42%) MPLS
17 30 (5.42%) Wi-Fi
18 18 (3.25%) Cisco Firepower
18 18 (3.25%) VoIP
Database & Business Intelligence
1 26 (4.69%) SQL Server
2 8 (1.44%) Relational Database
3 6 (1.08%) Amazon RDS
4 4 (0.72%) Data Warehouse
5 2 (0.36%) Azure SQL Database
5 2 (0.36%) Data Lake
6 1 (0.18%) Hadoop
6 1 (0.18%) HBase
6 1 (0.18%) NoSQL
6 1 (0.18%) Oracle Database
6 1 (0.18%) Power BI
6 1 (0.18%) Tableau
Development Applications
1 6 (1.08%) Sonatype Nexus
2 5 (0.90%) Jenkins
3 4 (0.72%) GitLab
4 3 (0.54%) Git
4 3 (0.54%) JIRA
4 3 (0.54%) Subversion
5 1 (0.18%) Bitbucket
5 1 (0.18%) CircleCI
5 1 (0.18%) Octopus Deploy
General
1 162 (29.24%) Social Skills
2 96 (17.33%) Finance
3 37 (6.68%) Analytical Skills
4 34 (6.14%) Inclusion and Diversity
5 31 (5.60%) Banking
6 29 (5.23%) Legal
7 22 (3.97%) Telecoms
8 19 (3.43%) Retail
9 18 (3.25%) Manufacturing
10 13 (2.35%) Influencing Skills
10 13 (2.35%) Public Sector
11 11 (1.99%) Documentation Skills
12 9 (1.62%) Law
12 9 (1.62%) Marketing
12 9 (1.62%) Pharmaceutical
13 8 (1.44%) Aviation
14 7 (1.26%) Front Office
14 7 (1.26%) Mandarin Language
15 5 (0.90%) Advertising
16 4 (0.72%) Organisational Skills
Job Titles
1 152 (27.44%) Network Engineer
2 88 (15.88%) Senior
3 65 (11.73%) Security Engineer
4 58 (10.47%) Infrastructure Engineer
5 55 (9.93%) IT Support
6 52 (9.39%) Analyst
6 52 (9.39%) Architect
7 51 (9.21%) Lead
8 44 (7.94%) IT Engineer
9 42 (7.58%) Network Security Engineer
10 36 (6.50%) Support Engineer
11 32 (5.78%) Security Analyst
12 29 (5.23%) Senior Infrastructure Engineer
13 28 (5.05%) IT Support Engineer
14 26 (4.69%) Security Architect
15 22 (3.97%) Senior Network Engineer
16 18 (3.25%) Cloud Architect
17 16 (2.89%) Cybersecurity Analyst
17 16 (2.89%) Senior Analyst
18 14 (2.53%) Consultant
Libraries, Frameworks & Software Standards
1 13 (2.35%) Elastic Stack
1 13 (2.35%) Kafka
2 9 (1.62%) 802.1X
3 8 (1.44%) LDAP
4 6 (1.08%) REST
5 5 (0.90%) RESTful
6 3 (0.54%) Azure Blueprints
7 2 (0.36%) HTML
7 2 (0.36%) Jinja
7 2 (0.36%) Leaflet
7 2 (0.36%) RabbitMQ
7 2 (0.36%) Spring
7 2 (0.36%) Spring Boot
8 1 (0.18%) .NET
8 1 (0.18%) ARM Templates
8 1 (0.18%) JSON
8 1 (0.18%) Middleware
8 1 (0.18%) Oracle Fusion
8 1 (0.18%) SailPoint
8 1 (0.18%) SAML
Miscellaneous
1 86 (15.52%) Management Information System
2 51 (9.21%) Security Posture
3 44 (7.94%) Driving Licence
4 36 (6.50%) Data Centre
5 23 (4.15%) Client/Server
6 22 (3.97%) Security Operations Centre
7 12 (2.17%) Cloud Native
7 12 (2.17%) Operational Technology
8 8 (1.44%) Cyber Threat
8 8 (1.44%) Hybrid Cloud
8 8 (1.44%) Public Cloud
8 8 (1.44%) Self-Motivation
9 7 (1.26%) Onboarding
9 7 (1.26%) PKI
10 6 (1.08%) Clustering
10 6 (1.08%) Legacy Systems
10 6 (1.08%) Robotics
11 5 (0.90%) IoT
12 4 (0.72%) Analytical Mindset
13 3 (0.54%) Product Ownership
Operating Systems
1 135 (24.37%) Windows
2 62 (11.19%) Linux
3 53 (9.57%) Windows Server
4 20 (3.61%) Windows 10
5 10 (1.81%) Apple iOS
6 7 (1.26%) Android
6 7 (1.26%) Windows Server 2012
7 6 (1.08%) Windows 7
7 6 (1.08%) Windows Server 2016
8 4 (0.72%) VMS
9 1 (0.18%) AIX
9 1 (0.18%) Oracle Linux
9 1 (0.18%) Red Hat Enterprise Linux
9 1 (0.18%) Windows Server 2003
9 1 (0.18%) Windows Server 2008
9 1 (0.18%) Windows Server 2019
Processes & Methodologies
1 156 (28.16%) Problem-Solving
2 136 (24.55%) Cybersecurity
3 106 (19.13%) Incident Response
4 98 (17.69%) SIEM
5 89 (16.06%) Information Security
6 87 (15.70%) Mentoring
7 85 (15.34%) Computer Science
8 72 (13.00%) Infrastructure Engineering
9 69 (12.45%) DevOps
9 69 (12.45%) ITIL
10 64 (11.55%) Disaster Recovery
10 64 (11.55%) Vulnerability Management
11 63 (11.37%) Cloud Security
12 62 (11.19%) Network Management
13 59 (10.65%) Risk Management
14 53 (9.57%) Data Protection
15 52 (9.39%) Continuous Improvement
16 50 (9.03%) Migration
17 47 (8.48%) Security Operations
18 43 (7.76%) Security Architecture
Programming Languages
1 60 (10.83%) PowerShell
2 58 (10.47%) Python
3 24 (4.33%) SQL
4 23 (4.15%) Java
5 21 (3.79%) Bash
6 10 (1.81%) C++
7 7 (1.26%) Perl
8 5 (0.90%) Go
8 5 (0.90%) JavaScript
9 3 (0.54%) C
9 3 (0.54%) Kusto Query Language
9 3 (0.54%) R
10 2 (0.36%) Bicep
10 2 (0.36%) C#
10 2 (0.36%) Ruby
10 2 (0.36%) Shell Script
10 2 (0.36%) TypeScript
11 1 (0.18%) Kotlin
11 1 (0.18%) VBA
11 1 (0.18%) VBScript
Qualifications
1 165 (29.78%) Cisco Certification
2 147 (26.53%) Degree
3 124 (22.38%) CCNP
4 118 (21.30%) Security Cleared
5 108 (19.49%) CCNA
6 102 (18.41%) SC Cleared
7 78 (14.08%) Computer Science Degree
8 63 (11.37%) DV Cleared
9 40 (7.22%) CISSP
10 39 (7.04%) Microsoft Certification
11 32 (5.78%) MCSE
12 31 (5.60%) MCP
13 28 (5.05%) CISM
13 28 (5.05%) LPIC
14 21 (3.79%) AWS Certification
15 20 (3.61%) Azure Certification
16 15 (2.71%) AWS Certified Solutions Architect
16 15 (2.71%) CCIE
16 15 (2.71%) CCSA
17 14 (2.53%) Network+ Certification
Quality Assurance & Compliance
1 81 (14.62%) NIST
2 80 (14.44%) ISO/IEC 27001
3 79 (14.26%) GDPR
4 28 (5.05%) PCI DSS
5 23 (4.15%) Cyber Essentials
6 21 (3.79%) HIPAA
7 15 (2.71%) NCSC
7 15 (2.71%) SLA
8 13 (2.35%) Cyber Essentials PLUS
9 7 (1.26%) Accessibility
9 7 (1.26%) QA
10 5 (0.90%) SOC 2
11 4 (0.72%) ISO/IEC 27002 (supersedes ISO/IEC 17799)
11 4 (0.72%) NIST 800
12 3 (0.54%) COBIT
12 3 (0.54%) Sarbanes-Oxley
13 2 (0.36%) California Consumer Privacy Act
13 2 (0.36%) GRC
14 1 (0.18%) Actionable Recommendations
14 1 (0.18%) PMO
System Software
1 76 (13.72%) Active Directory
2 49 (8.84%) VMware Infrastructure
3 34 (6.14%) Hyper-V
4 31 (5.60%) Docker
5 16 (2.89%) VMware ESXi
6 10 (1.81%) vSphere
7 7 (1.26%) Virtual Machines
8 6 (1.08%) BitLocker
8 6 (1.08%) Firmware
8 6 (1.08%) Microsoft App-V
8 6 (1.08%) Terminal Services
8 6 (1.08%) Virtual Desktop
9 5 (0.90%) VMware NSX
10 4 (0.72%) Virtual Servers
11 3 (0.54%) EMC RecoverPoint
12 2 (0.36%) ProxySG
12 2 (0.36%) XenApp
13 1 (0.18%) HDFS
13 1 (0.18%) VMware Server
13 1 (0.18%) XenDesktop
Systems Management
1 45 (8.12%) Terraform
2 38 (6.86%) FortiGate
3 36 (6.50%) Ansible
4 35 (6.32%) Kubernetes
5 16 (2.89%) Grafana
5 16 (2.89%) Prometheus
6 15 (2.71%) Microsoft Intune
7 12 (2.17%) QRadar
8 10 (1.81%) Single Sign-On
8 10 (1.81%) vCenter Server
9 6 (1.08%) ArcSight ESM
9 6 (1.08%) Nagios
9 6 (1.08%) Puppet
9 6 (1.08%) vMotion
10 5 (0.90%) CASB
10 5 (0.90%) HP Fortify
10 5 (0.90%) Istio
10 5 (0.90%) SCCM
11 4 (0.72%) CSIRT
11 4 (0.72%) linkerd
Vendors
1 214 (38.63%) Cisco
2 172 (31.05%) Microsoft
3 100 (18.05%) Fortinet
4 60 (10.83%) VMware
5 54 (9.75%) Meraki
6 42 (7.58%) Juniper
7 34 (6.14%) CheckPoint
8 31 (5.60%) Palo Alto
9 25 (4.51%) Splunk
10 23 (4.15%) Citrix
10 23 (4.15%) SolarWinds
11 20 (3.61%) Google
12 19 (3.43%) F5
13 17 (3.07%) HP
14 12 (2.17%) Arista
15 9 (1.62%) SAP
16 8 (1.44%) ServiceNow
16 8 (1.44%) Symantec
16 8 (1.44%) Zscaler
17 7 (1.26%) McAfee