Virtual Machines Jobs in England

Virtual Machine (VM)
UK > England

The table below provides summary statistics for permanent job vacancies advertised in England requiring Virtual Machines skills. It includes a benchmarking guide to the annual salaries offered in vacancies that cited Virtual Machines over the 6 months leading up to 12 June 2025, comparing them to the same period in the previous two years.

6 months to
12 Jun 2025
Same period 2024 Same period 2023
Rank 509 422 302
Rank change year-on-year -87 -120 +292
Permanent jobs citing Virtual Machines 189 515 979
As % of all permanent jobs advertised in England 0.39% 0.54% 1.19%
As % of the System Software category 3.20% 4.75% 7.70%
Number of salaries quoted 136 418 274
10th Percentile £36,250 £35,875 £32,200
25th Percentile £50,000 £48,750 £41,313
Median annual salary (50th Percentile) £57,836 £57,500 £60,000
Median % change year-on-year +0.58% -4.17% +11.63%
75th Percentile £79,063 £71,875 £79,688
90th Percentile £96,875 £98,474 £100,000
UK median annual salary £57,836 £57,500 £60,000
% change year-on-year +0.58% -4.17% +14.29%

All System Software Skills
England

Virtual Machines falls under the System Software category. For comparison with the information above, the following table provides summary statistics for all permanent job vacancies requiring system software skills in England.

Permanent vacancies with a requirement for system software skills 5,900 10,850 12,719
As % of all permanent jobs advertised in England 12.03% 11.40% 15.43%
Number of salaries quoted 3,364 8,500 8,834
10th Percentile £27,750 £26,250 £27,750
25th Percentile £35,000 £32,500 £37,250
Median annual salary (50th Percentile) £52,500 £50,000 £55,000
Median % change year-on-year +5.00% -9.09% -
75th Percentile £76,250 £67,500 £77,500
90th Percentile £96,250 £86,250 £95,000
UK median annual salary £52,500 £50,000 £55,000
% change year-on-year +5.00% -9.09% -2.35%

Virtual Machines
Job Vacancy Trend in England

Job postings citing Virtual Machines as a proportion of all IT jobs advertised in England.
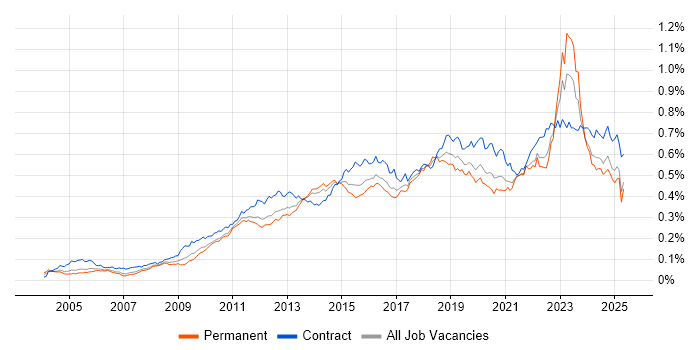
Job vacancy trend for Virtual Machines in England

Virtual Machines
Salary Trend in England

3-month moving average salary quoted in jobs citing Virtual Machines in England.

Salary trend for Virtual Machines in England

Virtual Machines
Salary Histogram in England

Salary distribution for jobs citing Virtual Machines in England over the 6 months to 12 June 2025.

Salary histogram for Virtual Machines in England

Virtual Machines
Job Locations in England

The table below looks at the demand and provides a guide to the median salaries quoted in IT jobs citing Virtual Machines within the England region over the 6 months to 12 June 2025. The 'Rank Change' column provides an indication of the change in demand within each location based on the same 6 month period last year.

Location Rank Change
on Same Period
Last Year
Matching
Permanent
IT Job Ads
Median Salary
Past 6 Months
Median Salary
% Change
on Same Period
Last Year
Live
Jobs
South East +24 55 £55,000 -8.33% 48
London +27 54 £88,750 +4.41% 63
North of England +23 51 £57,836 +5.16% 37
North West +12 32 £57,836 +0.58% 23
Midlands +49 17 £46,000 -0.54% 23
West Midlands +51 13 £46,000 -5.64% 16
Yorkshire +37 13 £41,250 -2.94% 7
East of England +14 9 £53,750 -4.44% 14
South West +64 6 £52,500 -4.55% 26
North East +40 6 £32,000 -43.11% 7
East Midlands +42 4 £57,500 +24.32% 6
South Coast - 1 £59,000 -
Virtual Machines
UK

Virtual Machines
Co-occurring Skills and Capabilities in England by Category

The follow tables expand on the table above by listing co-occurrences grouped by category. The same employment type, locality and period is covered with up to 20 co-occurrences shown in each of the following categories:

Application Platforms
1 25 (13.23%) Microsoft Exchange
2 17 (8.99%) SharePoint
3 3 (1.59%) Apache Airflow
4 2 (1.06%) Apache
4 2 (1.06%) Apache Spark
4 2 (1.06%) Blackberry Enterprise Server
4 2 (1.06%) Exchange Server 2013
4 2 (1.06%) IIS
4 2 (1.06%) Skype for Business
5 1 (0.53%) Confluence
5 1 (0.53%) Ethereum
5 1 (0.53%) OpenStack
5 1 (0.53%) Oracle SOA Suite
5 1 (0.53%) Solana
Applications
1 7 (3.70%) Mozilla Thunderbird
2 3 (1.59%) Microsoft Office
3 2 (1.06%) Microsoft Excel
3 2 (1.06%) Microsoft PowerPoint
Business Applications
1 1 (0.53%) Oracle Applications
1 1 (0.53%) Oracle EBS
Cloud Services
1 122 (64.55%) Azure
2 53 (28.04%) Entra ID
3 47 (24.87%) Azure DevOps
4 43 (22.75%) AWS
5 38 (20.11%) Microsoft 365
6 34 (17.99%) Azure Monitor
7 23 (12.17%) Power Automate
8 21 (11.11%) Azure Key Vault
8 21 (11.11%) IaaS
8 21 (11.11%) PaaS
9 19 (10.05%) SaaS
10 17 (8.99%) Azure ExpressRoute
11 16 (8.47%) Azure Service Bus
11 16 (8.47%) Power Platform
12 15 (7.94%) Azure AI
13 12 (6.35%) OneDrive
14 11 (5.82%) GitHub
14 11 (5.82%) Serverless
15 10 (5.29%) GCP
16 9 (4.76%) Amazon S3
Communications & Networking
1 77 (40.74%) Firewall
2 44 (23.28%) DNS
3 39 (20.63%) VPN
4 25 (13.23%) WAN
5 21 (11.11%) DHCP
6 20 (10.58%) SD-WAN
7 12 (6.35%) VLAN
8 11 (5.82%) TCP/IP
9 8 (4.23%) SAN
10 7 (3.70%) LAN
10 7 (3.70%) SSL
11 6 (3.17%) Network Security
12 4 (2.12%) HTTPS
12 4 (2.12%) NAS
13 3 (1.59%) Wi-Fi
14 2 (1.06%) IMAP
14 2 (1.06%) IPv4
14 2 (1.06%) Skype
14 2 (1.06%) SMTP
14 2 (1.06%) Wireless
Database & Business Intelligence
1 23 (12.17%) SQL Server
2 17 (8.99%) Data Lake
3 16 (8.47%) Power BI
4 15 (7.94%) MySQL
5 7 (3.70%) Relational Database
6 3 (1.59%) Amazon RDS
6 3 (1.59%) Azure SQL Database
7 2 (1.06%) Apache Hive
7 2 (1.06%) Big Data
7 2 (1.06%) BigQuery
7 2 (1.06%) Bigtable
7 2 (1.06%) Hadoop
7 2 (1.06%) HBase
7 2 (1.06%) Impala
7 2 (1.06%) Metadata
7 2 (1.06%) SAP HANA
7 2 (1.06%) Tableau
8 1 (0.53%) Oracle Database
8 1 (0.53%) Oracle Exadata
8 1 (0.53%) Oracle Reports
Development Applications
1 25 (13.23%) Git
2 18 (9.52%) Jenkins
3 7 (3.70%) Bitbucket Server
4 3 (1.59%) Vagrant
5 2 (1.06%) Artifactory
5 2 (1.06%) JIRA
6 1 (0.53%) MSBuild
6 1 (0.53%) NUnit
6 1 (0.53%) Octopus Deploy
General
1 62 (32.80%) Social Skills
2 32 (16.93%) Finance
3 19 (10.05%) Banking
4 10 (5.29%) Analytical Skills
5 8 (4.23%) Legal
6 7 (3.70%) Inclusion and Diversity
6 7 (3.70%) Manufacturing
7 6 (3.17%) Law
8 3 (1.59%) Investment Banking
8 3 (1.59%) Military
8 3 (1.59%) Telecoms
9 2 (1.06%) Retail
10 1 (0.53%) Advertising
10 1 (0.53%) Aerospace
10 1 (0.53%) Aviation
10 1 (0.53%) Back Office
10 1 (0.53%) Front Office
10 1 (0.53%) Marketing
10 1 (0.53%) Presentation Skills
10 1 (0.53%) Public Sector
Job Titles
1 28 (14.81%) Infrastructure Engineer
2 24 (12.70%) Cloud Engineer
3 23 (12.17%) Architect
3 23 (12.17%) Senior
4 21 (11.11%) Lead
5 17 (8.99%) Systems Engineer
5 17 (8.99%) Vulnerability Manager
6 16 (8.47%) Cloud Architect
7 15 (7.94%) DevOps Engineer
7 15 (7.94%) Lead Systems Engineer
8 14 (7.41%) Security Engineer
9 12 (6.35%) Azure Engineer
10 8 (4.23%) IT Engineer
10 8 (4.23%) Technical Engineer
11 7 (3.70%) Automation Engineer
11 7 (3.70%) Azure Infrastructure Engineer
11 7 (3.70%) Cloud Infrastructure Engineer
11 7 (3.70%) Cloud Security Engineer
11 7 (3.70%) Principal Engineer
11 7 (3.70%) Senior Cloud Engineer
Libraries, Frameworks & Software Standards
1 13 (6.88%) ARM Templates
2 6 (3.17%) Kafka
3 5 (2.65%) YAML
4 3 (1.59%) .NET
4 3 (1.59%) Pandas
4 3 (1.59%) scikit-learn
5 2 (1.06%) Anaconda
5 2 (1.06%) JSON
6 1 (0.53%) ADO.NET
6 1 (0.53%) ASP.NET Web API
6 1 (0.53%) Bootstrap
6 1 (0.53%) Entity Framework
6 1 (0.53%) HTML
6 1 (0.53%) jQuery
6 1 (0.53%) OAuth
6 1 (0.53%) Oracle Fusion
6 1 (0.53%) Razor View Engine
6 1 (0.53%) RESTful
6 1 (0.53%) WCF
6 1 (0.53%) WPF
Miscellaneous
1 38 (20.11%) Data Centre
2 28 (14.81%) Management Information System
3 15 (7.94%) NHS
4 11 (5.82%) Distributed Systems
4 11 (5.82%) Public Cloud
5 10 (5.29%) Cloud Native
5 10 (5.29%) Cyber Threat
6 9 (4.76%) Product Ownership
6 9 (4.76%) Security Posture
7 8 (4.23%) Operational Technology
7 8 (4.23%) SCADA
8 7 (3.70%) Life Science
9 6 (3.17%) Hybrid Cloud
9 6 (3.17%) Linux Command Line
10 4 (2.12%) Onboarding
11 3 (1.59%) Hedge funds
12 2 (1.06%) Blackberry
12 2 (1.06%) Cyber Defence
12 2 (1.06%) Self-Motivation
13 1 (0.53%) Blockchain
Operating Systems
1 57 (30.16%) Windows
2 39 (20.63%) Linux
3 33 (17.46%) Windows Server
4 17 (8.99%) Red Hat Enterprise Linux
5 13 (6.88%) VMS
6 7 (3.70%) Ubuntu
7 6 (3.17%) Apple iOS
8 4 (2.12%) Windows Server 2016
9 3 (1.59%) Unix
9 3 (1.59%) Windows Server 2019
10 2 (1.06%) AIX
10 2 (1.06%) Mac OS
10 2 (1.06%) Oracle Linux
10 2 (1.06%) SUSE Linux Enterprise Server
10 2 (1.06%) Windows 10
11 1 (0.53%) Android
11 1 (0.53%) Debian
11 1 (0.53%) Windows 7
11 1 (0.53%) Windows Server 2008
Processes & Methodologies
1 74 (39.15%) DevOps
2 58 (30.69%) Agile
3 55 (29.10%) Roadmaps
4 52 (27.51%) Infrastructure as Code
5 45 (23.81%) Infrastructure Engineering
6 42 (22.22%) CI/CD
7 39 (20.63%) Containerisation
8 36 (19.05%) Cybersecurity
9 35 (18.52%) Analytics
10 33 (17.46%) Log Analytics
10 33 (17.46%) Migration
11 31 (16.40%) Problem-Solving
12 30 (15.87%) Disaster Recovery
12 30 (15.87%) ITIL
12 30 (15.87%) Microservices
13 24 (12.70%) Service Management
14 22 (11.64%) Network Virtualisation
14 22 (11.64%) Technology Roadmap
15 20 (10.58%) Incident Response
16 19 (10.05%) Software Engineering
Programming Languages
1 71 (37.57%) PowerShell
2 51 (26.98%) SQL
3 43 (22.75%) Python
4 20 (10.58%) Bicep
4 20 (10.58%) Java
5 15 (7.94%) C
6 12 (6.35%) Shell Script
7 9 (4.76%) C#
8 8 (4.23%) Bash
9 6 (3.17%) Go
10 5 (2.65%) Ruby
11 3 (1.59%) Groovy
11 3 (1.59%) Perl
12 2 (1.06%) JavaScript
12 2 (1.06%) Korn
12 2 (1.06%) TypeScript
13 1 (0.53%) PL/SQL
13 1 (0.53%) R
13 1 (0.53%) Rust
13 1 (0.53%) Solidity
Qualifications
1 47 (24.87%) Azure Certification
2 40 (21.16%) Degree
3 18 (9.52%) Microsoft Certification
4 15 (7.94%) DBS Check
4 15 (7.94%) HND
5 12 (6.35%) Security Cleared
6 10 (5.29%) SC Cleared
7 7 (3.70%) CompTIA Security+
8 6 (3.17%) Computer Science Degree
8 6 (3.17%) VMware Certified Professional (VCP)
9 5 (2.65%) AWS Certification
9 5 (2.65%) CCNA
9 5 (2.65%) Cisco Certification
10 2 (1.06%) CISSP
10 2 (1.06%) ITIL Foundation Certificate
10 2 (1.06%) Master's Degree
10 2 (1.06%) MCSA
11 1 (0.53%) CCNP
11 1 (0.53%) MCSE
11 1 (0.53%) SANS
Quality Assurance & Compliance
1 18 (9.52%) GDPR
2 11 (5.82%) HIPAA
2 11 (5.82%) SOC 2
3 7 (3.70%) ISO/IEC 27001
4 3 (1.59%) Data Quality
5 2 (1.06%) Accessibility
6 1 (0.53%) SLA
System Software
1 54 (28.57%) Active Directory
2 38 (20.11%) VMware Infrastructure
3 34 (17.99%) Docker
4 18 (9.52%) Hyper-V
5 17 (8.99%) Virtual Desktop
6 14 (7.41%) VMware ESXi
6 14 (7.41%) vSphere
7 2 (1.06%) HDFS
7 2 (1.06%) XenApp
8 1 (0.53%) BitLocker
8 1 (0.53%) NFS
8 1 (0.53%) pfSense
8 1 (0.53%) RHEV
8 1 (0.53%) vCloud
8 1 (0.53%) XenDesktop
Systems Management
1 50 (26.46%) Terraform
2 31 (16.40%) Kubernetes
3 26 (13.76%) Microsoft Intune
4 24 (12.70%) Single Sign-On
5 17 (8.99%) Ansible
6 12 (6.35%) SCCM
7 9 (4.76%) vCenter Server
8 7 (3.70%) Nessus
8 7 (3.70%) Proxmox
9 6 (3.17%) Istio
10 5 (2.65%) Nagios
11 4 (2.12%) Grafana
12 3 (1.59%) Packer
12 3 (1.59%) WSUS
13 2 (1.06%) EMC NetWorker
13 2 (1.06%) FortiGate
13 2 (1.06%) Hadoop YARN
13 2 (1.06%) Jamf Pro
13 2 (1.06%) Red Hat Satellite
13 2 (1.06%) ZABBIX
Vendors
1 74 (39.15%) Microsoft
2 43 (22.75%) VMware
3 20 (10.58%) Databricks
4 18 (9.52%) Qualys
4 18 (9.52%) Tenable
5 15 (7.94%) Meraki
6 14 (7.41%) Cisco
7 10 (5.29%) Apple
7 10 (5.29%) Citrix
8 8 (4.23%) Juniper
9 7 (3.70%) Oracle
9 7 (3.70%) Red Hat
9 7 (3.70%) Rockwell
9 7 (3.70%) Siemens
10 6 (3.17%) Confluent
10 6 (3.17%) Palo Alto
11 5 (2.65%) Atlassian
11 5 (2.65%) NetApp
12 4 (2.12%) Google
12 4 (2.12%) Veeam