Dell Jobs in England

Dell
UK > England

The table below provides summary statistics for permanent job vacancies advertised in England requiring knowledge or experience of Dell products and/or services. It includes a benchmarking guide to the annual salaries offered in vacancies that cited Dell over the 6 months leading up to 19 June 2025, comparing them to the same period in the previous two years.

The figures below represent the IT labour market in general and are not representative of salaries within Dell, Inc.

6 months to
19 Jun 2025
Same period 2024 Same period 2023
Rank 415 443 458
Rank change year-on-year +28 +15 +202
Permanent jobs citing Dell 304 497 514
As % of all permanent jobs advertised in England 0.62% 0.51% 0.63%
As % of the Vendors category 1.50% 1.51% 1.53%
Number of salaries quoted 165 409 305
10th Percentile £24,570 £24,565 £27,350
25th Percentile £32,500 £29,000 £33,500
Median annual salary (50th Percentile) £45,000 £42,500 £45,000
Median % change year-on-year +5.88% -5.56% -5.26%
75th Percentile £58,750 £56,000 £57,500
90th Percentile £77,000 £70,000 £72,500
UK median annual salary £45,000 £40,000 £45,000
% change year-on-year +12.50% -11.11% -6.08%

All Vendors
England

Dell falls under the Vendor Products and Services category. For comparison with the information above, the following table provides summary statistics for all permanent job vacancies requiring knowledge or experience of all vendor products and services in England.

Permanent vacancies with a requirement for knowledge or experience of vendor products and services 20,290 33,004 33,660
As % of all permanent jobs advertised in England 41.20% 34.04% 41.40%
Number of salaries quoted 10,974 22,942 20,589
10th Percentile £26,250 £26,700 £31,000
25th Percentile £36,250 £36,000 £41,250
Median annual salary (50th Percentile) £55,000 £50,000 £57,500
Median % change year-on-year +10.00% -13.04% +4.55%
75th Percentile £70,600 £68,750 £75,000
90th Percentile £90,000 £87,500 £92,500
UK median annual salary £52,500 £50,000 £57,500
% change year-on-year +5.00% -13.04% +4.55%

Dell
Job Vacancy Trend in England

Job postings citing Dell as a proportion of all IT jobs advertised in England.
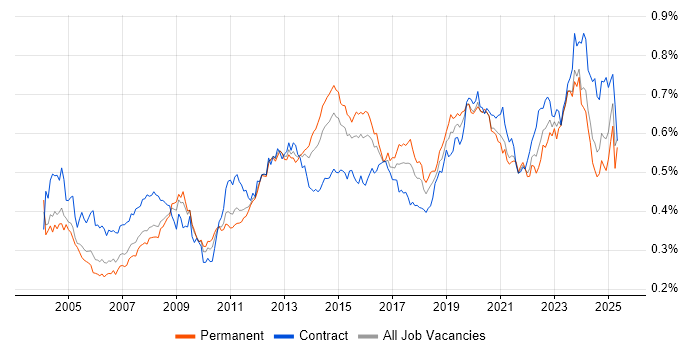
Job vacancy trend for Dell in England

Dell
Salary Trend in England

3-month moving average salary quoted in jobs citing Dell in England.

Salary trend for Dell in England

Dell
Salary Histogram in England

Salary distribution for jobs citing Dell in England over the 6 months to 19 June 2025.

Salary histogram for Dell in England

Dell
Job Locations in England

The table below looks at the demand and provides a guide to the median salaries quoted in IT jobs citing Dell within the England region over the 6 months to 19 June 2025. The 'Rank Change' column provides an indication of the change in demand within each location based on the same 6 month period last year.

Location Rank Change
on Same Period
Last Year
Matching
Permanent
IT Job Ads
Median Salary
Past 6 Months
Median Salary
% Change
on Same Period
Last Year
Live
Jobs
South East +109 108 £40,000 -13.98% 146
London +69 88 £60,000 +9.09% 233
Midlands +43 42 £50,000 +13.34% 100
North of England +8 38 £24,570 -35.34% 142
West Midlands +48 36 £35,000 -19.03% 58
North West -19 18 £24,570 -38.58% 80
Yorkshire +44 13 £42,000 +68.00% 54
East of England +14 13 £62,500 +123.21% 73
North East - 7 £24,570 - 9
South West +63 6 £24,000 -31.43% 87
East Midlands +24 6 £50,000 +11.11% 42
Dell
UK

Dell
Co-occurring Skills and Capabilities in England by Category

The follow tables expand on the table above by listing co-occurrences grouped by category. The same employment type, locality and period is covered with up to 20 co-occurrences shown in each of the following categories:

Application Platforms
1 27 (8.88%) Microsoft Exchange
2 16 (5.26%) SharePoint
3 10 (3.29%) IIS
4 1 (0.33%) Confluence
Applications
1 13 (4.28%) Microsoft Office
2 12 (3.95%) Microsoft Excel
3 11 (3.62%) Maya
4 3 (0.99%) Microsoft PowerPoint
Business Applications
1 12 (3.95%) NetSuite
2 11 (3.62%) Dynamics CRM
2 11 (3.62%) JDE OneWorld
3 5 (1.64%) Dynamics AX
3 5 (1.64%) SAP S/4HANA
4 4 (1.32%) Dynamics NAV
4 4 (1.32%) SAP HR
5 3 (0.99%) SAP CX
6 2 (0.66%) Carpe Diem
Cloud Services
1 48 (15.79%) Microsoft 365
2 47 (15.46%) Boomi
3 42 (13.82%) Azure
4 30 (9.87%) AWS
5 16 (5.26%) Salesforce Commerce Cloud
6 14 (4.61%) Power Platform
7 12 (3.95%) Entra ID
8 9 (2.96%) Google Workspace
9 7 (2.30%) GCP
10 6 (1.97%) SaaS
11 5 (1.64%) SAP Commerce Cloud
12 4 (1.32%) Cloud Computing
12 4 (1.32%) Salesforce Sales Cloud
12 4 (1.32%) Salesforce Service Cloud
12 4 (1.32%) SuccessFactors
13 3 (0.99%) Dynamics 365
13 3 (0.99%) IaaS
13 3 (0.99%) OpenShift
13 3 (0.99%) PaaS
13 3 (0.99%) Rubrik
Communications & Networking
1 69 (22.70%) Firewall
2 28 (9.21%) DNS
3 26 (8.55%) WAN
4 25 (8.22%) DHCP
5 20 (6.58%) SAN
6 18 (5.92%) LAN
6 18 (5.92%) VLAN
7 17 (5.59%) TCP/IP
7 17 (5.59%) VPN
8 11 (3.62%) OSPF
8 11 (3.62%) Remote Desktop
9 10 (3.29%) BGP
10 9 (2.96%) WLAN
11 6 (1.97%) iSCSI
11 6 (1.97%) Wireless
12 4 (1.32%) SD-WAN
12 4 (1.32%) VoIP
13 3 (0.99%) Cisco ASA
13 3 (0.99%) MPLS
13 3 (0.99%) NAS
Database & Business Intelligence
1 26 (8.55%) SQL Server
2 13 (4.28%) Data Lake
2 13 (4.28%) Power BI
3 11 (3.62%) SQL Server Integration Services
4 8 (2.63%) Tableau
5 7 (2.30%) Relational Database
6 6 (1.97%) DTS
6 6 (1.97%) Oracle Database
6 6 (1.97%) Oracle Reports
6 6 (1.97%) RDBMS
7 5 (1.64%) MySQL
7 5 (1.64%) SQL Server Reporting Services
8 4 (1.32%) Metabase
8 4 (1.32%) PostgreSQL
9 2 (0.66%) Data Warehouse
10 1 (0.33%) Amazon Redshift
10 1 (0.33%) BigQuery
Development Applications
1 4 (1.32%) Jenkins
2 3 (0.99%) JIRA
3 2 (0.66%) Git
4 1 (0.33%) Artifactory
4 1 (0.33%) Bitbucket
4 1 (0.33%) GitLab
4 1 (0.33%) WaveMaker
General
1 154 (50.66%) Social Skills
2 60 (19.74%) Marketing
3 58 (19.08%) Finance
4 39 (12.83%) Inclusion and Diversity
5 31 (10.20%) Retail
6 27 (8.88%) Presentation Skills
7 25 (8.22%) Analytical Skills
8 18 (5.92%) Law
9 14 (4.61%) Electronics
10 11 (3.62%) Games
11 9 (2.96%) Automotive
11 9 (2.96%) Documentation Skills
12 7 (2.30%) Organisational Skills
13 6 (1.97%) Public Sector
13 6 (1.97%) Telecoms
14 3 (0.99%) Back Office
14 3 (0.99%) Manufacturing
14 3 (0.99%) Police
15 2 (0.66%) Banking
15 2 (0.66%) Legal
Job Titles
1 57 (18.75%) Sales Executive
2 36 (11.84%) Senior
3 35 (11.51%) Account Executive
4 34 (11.18%) Corporate Sales Executive
5 31 (10.20%) Support Engineer
6 20 (6.58%) Infrastructure Engineer
7 17 (5.59%) Consultant
7 17 (5.59%) Developer
8 16 (5.26%) IT Engineer
8 16 (5.26%) Sales Account Executive
9 15 (4.93%) Architect
10 14 (4.61%) 2nd Line Support
10 14 (4.61%) Salesforce Architect
10 14 (4.61%) Systems Engineer
10 14 (4.61%) Telesales Executive
11 13 (4.28%) Lead
11 13 (4.28%) Technical Engineer
11 13 (4.28%) Technical Support
11 13 (4.28%) Technical Support Engineer
12 12 (3.95%) NetSuite Developer
Libraries, Frameworks & Software Standards
1 16 (5.26%) SOAP
2 13 (4.28%) REST
3 12 (3.95%) JSON
3 12 (3.95%) Web Services
3 12 (3.95%) XML
4 11 (3.62%) CSS
4 11 (3.62%) CSS3
4 11 (3.62%) Hibernate
4 11 (3.62%) HTML
4 11 (3.62%) jQuery
5 6 (1.97%) .NET
5 6 (1.97%) Lightning Web Components
5 6 (1.97%) RESTful
6 5 (1.64%) EDI
7 4 (1.32%) YAML
8 2 (0.66%) Oracle Fusion
8 2 (0.66%) Visualforce
9 1 (0.33%) 802.1X
9 1 (0.33%) AngularJS
9 1 (0.33%) Restlet
Miscellaneous
1 31 (10.20%) Data Centre
2 18 (5.92%) Enterprise Software
3 16 (5.26%) Virtual Team
4 15 (4.93%) Cloud Native
4 15 (4.93%) Management Information System
4 15 (4.93%) Onboarding
5 12 (3.95%) Analytical Mindset
6 9 (2.96%) Smartphone
7 7 (2.30%) Driving Licence
8 6 (1.97%) Public Cloud
8 6 (1.97%) Self-Motivation
9 5 (1.64%) Hybrid Cloud
10 4 (1.32%) Linux Command Line
11 3 (0.99%) Enterprise Storage
11 3 (0.99%) Operational Technology
11 3 (0.99%) PKI
11 3 (0.99%) Renewable Energy
12 2 (0.66%) Clustering
12 2 (0.66%) Fibre Optics
12 2 (0.66%) Replication
Operating Systems
1 75 (24.67%) Windows
2 42 (13.82%) Linux
3 36 (11.84%) Windows Server
4 20 (6.58%) Windows Server 2019
5 13 (4.28%) Windows 10
6 12 (3.95%) Ubuntu
6 12 (3.95%) Windows Server 2016
7 9 (2.96%) Mac OS X
8 8 (2.63%) Red Hat Enterprise Linux
9 4 (1.32%) zOS
10 3 (0.99%) Android
10 3 (0.99%) Windows Server 2012
11 2 (0.66%) Debian
11 2 (0.66%) Rocky
11 2 (0.66%) SUSE
12 1 (0.33%) CentOS
Processes & Methodologies
1 58 (19.08%) IT Strategy
2 55 (18.09%) Customer Experience
3 53 (17.43%) Technology Strategy
4 50 (16.45%) Artificial Intelligence
4 50 (16.45%) Problem-Solving
5 41 (13.49%) Email Marketing
6 34 (11.18%) ERP
7 32 (10.53%) CRM
7 32 (10.53%) Customer Service
8 31 (10.20%) Telesales
9 22 (7.24%) Infrastructure Engineering
10 20 (6.58%) Business Strategy
10 20 (6.58%) Cybersecurity
10 20 (6.58%) Presales
11 19 (6.25%) Systems Engineering
12 18 (5.92%) Business Development
12 18 (5.92%) ITIL
12 18 (5.92%) Roadmaps
12 18 (5.92%) Thought Leadership
13 17 (5.59%) Project Management
Programming Languages
1 41 (13.49%) SQL
2 20 (6.58%) PowerShell
3 14 (4.61%) JavaScript
4 10 (3.29%) Python
5 7 (2.30%) PL/SQL
6 6 (1.97%) Apex Code
7 5 (1.64%) Bash
8 4 (1.32%) C++
8 4 (1.32%) JCL
8 4 (1.32%) Korn
8 4 (1.32%) REXX
9 2 (0.66%) Java
10 1 (0.33%) Scala
Qualifications
1 101 (33.22%) Degree
2 25 (8.22%) Microsoft Certification
3 12 (3.95%) Computer Science Degree
3 12 (3.95%) MCSE
3 12 (3.95%) Security Cleared
4 9 (2.96%) BPSS Clearance
4 9 (2.96%) HNC
4 9 (2.96%) HND
5 6 (1.97%) Cisco Certification
5 6 (1.97%) Dell Certification
6 5 (1.64%) MCP
7 4 (1.32%) A+ Certification
7 4 (1.32%) CCNA
7 4 (1.32%) DV Cleared
7 4 (1.32%) SC Cleared
8 3 (0.99%) Azure Certification
8 3 (0.99%) Network+ Certification
9 2 (0.66%) AWS Certification
9 2 (0.66%) MCSA
10 1 (0.33%) DBS Check
Quality Assurance & Compliance
1 16 (5.26%) SLA
2 11 (3.62%) Accessibility
3 8 (2.63%) GDPR
4 2 (0.66%) Cyber Essentials
4 2 (0.66%) Cyber Essentials PLUS
4 2 (0.66%) ISO/IEC 27001
4 2 (0.66%) NIST
4 2 (0.66%) QA
5 1 (0.33%) Government Security Classifications
System Software
1 56 (18.42%) Active Directory
2 50 (16.45%) VMware Infrastructure
3 34 (11.18%) Hyper-V
4 12 (3.95%) vSphere
5 10 (3.29%) Virtual Desktop
6 6 (1.97%) Terminal Services
7 5 (1.64%) Docker
7 5 (1.64%) Firmware
7 5 (1.64%) VMware ESXi
8 4 (1.32%) Citrix Hypervisor
8 4 (1.32%) Time Sharing Option
9 2 (0.66%) KVM
9 2 (0.66%) Virtual Machines
9 2 (0.66%) VMware NSX
9 2 (0.66%) VMware Workstation
9 2 (0.66%) XenApp
9 2 (0.66%) XenDesktop
10 1 (0.33%) NFS
Systems Management
1 11 (3.62%) Microsoft Intune
2 9 (2.96%) Kubernetes
2 9 (2.96%) SCCM
3 8 (2.63%) Ansible
4 5 (1.64%) Terraform
4 5 (1.64%) VxRail
5 4 (1.32%) Avamar
5 4 (1.32%) FortiGate
5 4 (1.32%) WSUS
6 3 (0.99%) Active Directory Federation Services
6 3 (0.99%) Dell DRAC
6 3 (0.99%) EMC NetWorker
7 2 (0.66%) Puppet
7 2 (0.66%) vCenter Server
8 1 (0.33%) Microsoft Clustering
8 1 (0.33%) PowerCLI
8 1 (0.33%) Progress Chef
8 1 (0.33%) SCOM
8 1 (0.33%) vRealize
8 1 (0.33%) WMI
Vendors
1 155 (50.99%) Microsoft
2 104 (34.21%) Cisco
3 69 (22.70%) VMware
4 38 (12.50%) HP
5 30 (9.87%) Salesforce
6 22 (7.24%) Veeam
7 21 (6.91%) Oracle
8 20 (6.58%) SAP
9 19 (6.25%) Citrix
9 19 (6.25%) MuleSoft
10 16 (5.26%) Fortinet
11 14 (4.61%) Apple
11 14 (4.61%) Google
11 14 (4.61%) NetApp
12 13 (4.28%) Juniper
13 12 (3.95%) Adobe
14 10 (3.29%) IBM
14 10 (3.29%) Red Hat
15 9 (2.96%) EMC
15 9 (2.96%) McAfee