Performance Metrics Jobs in England

Performance Metrics
UK > England

The table below provides summary statistics for permanent job vacancies advertised in England requiring Performance Metrics skills. It includes a benchmarking guide to the annual salaries offered in vacancies that cited Performance Metrics over the 6 months leading up to 11 January 2025, comparing them to the same period in the previous two years.

6 months to
11 Jan 2025
Same period 2024 Same period 2023
Rank 303 425 646
Rank change year-on-year +122 +221 +81
Permanent jobs citing Performance Metrics 553 280 363
As % of all permanent jobs advertised in England 0.97% 0.55% 0.37%
As % of the Processes & Methodologies category 1.05% 0.61% 0.39%
Number of salaries quoted 238 191 136
10th Percentile £42,200 £31,250 £33,750
25th Percentile £47,500 £42,500 £41,250
Median annual salary (50th Percentile) £60,000 £59,000 £55,000
Median % change year-on-year +1.69% +7.27% -15.38%
75th Percentile £74,688 £76,125 £70,000
90th Percentile £90,000 £85,000 £97,750
UK median annual salary £59,000 £59,000 £56,000
% change year-on-year - +5.36% -13.85%

All Process and Methodology Skills
England

Performance Metrics falls under the Processes and Methodologies category. For comparison with the information above, the following table provides summary statistics for all permanent job vacancies requiring process or methodology skills in England.

Permanent vacancies with a requirement for process or methodology skills 52,424 46,231 93,237
As % of all permanent jobs advertised in England 91.82% 90.11% 95.45%
Number of salaries quoted 23,586 34,455 59,168
10th Percentile £35,000 £31,500 £35,000
25th Percentile £45,628 £42,500 £46,250
Median annual salary (50th Percentile) £60,000 £60,000 £62,500
Median % change year-on-year - -4.00% +4.17%
75th Percentile £79,600 £80,000 £83,750
90th Percentile £100,000 £98,750 £100,000
UK median annual salary £60,000 £60,000 £62,500
% change year-on-year - -4.00% +4.17%

Performance Metrics
Job Vacancy Trend in England

Job postings citing Performance Metrics as a proportion of all IT jobs advertised in England.
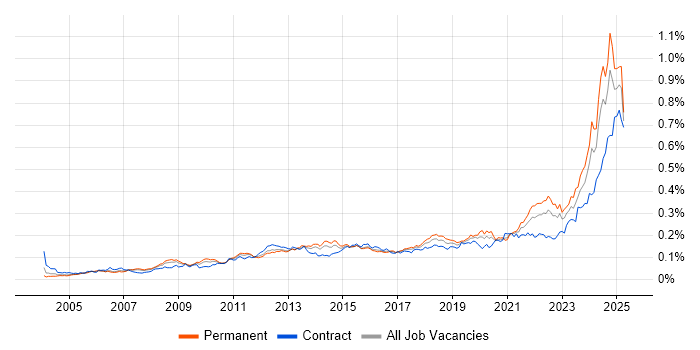
Job vacancy trend for Performance Metrics in England

Performance Metrics
Salary Trend in England

3-month moving average salary quoted in jobs citing Performance Metrics in England.

Salary trend for Performance Metrics in England

Performance Metrics
Salary Histogram in England

Salary distribution for jobs citing Performance Metrics in England over the 6 months to 11 January 2025.

Salary histogram for Performance Metrics in England

Performance Metrics
Job Locations in England

The table below looks at the demand and provides a guide to the median salaries quoted in IT jobs citing Performance Metrics within the England region over the 6 months to 11 January 2025. The 'Rank Change' column provides an indication of the change in demand within each location based on the same 6 month period last year.

Location Rank Change
on Same Period
Last Year
Matching
Permanent
IT Job Ads
Median Salary
Past 6 Months
Median Salary
% Change
on Same Period
Last Year
Live
Jobs
Midlands +109 194 £47,500 - 13
West Midlands +82 152 £47,500 - 8
North of England +58 135 £50,818 -5.89% 51
London +20 125 £65,000 -9.72% 131
North West +45 100 £50,818 +35.51% 32
South East +1 67 £60,000 +9.09% 25
East Midlands +5 42 £42,512 -14.98% 5
Yorkshire +16 19 £65,000 +20.37% 15
North East +1 16 £73,805 +168.38% 4
East of England -45 12 £55,000 +36.82% 13
South West +14 10 £42,512 -39.27% 10
Performance Metrics
UK

Performance Metrics
Co-occurring Skills and Capabilities in England by Category

The follow tables expand on the table above by listing co-occurrences grouped by category. The same employment type, locality and period is covered with up to 20 co-occurrences shown in each of the following categories:

Application Platforms
1 66 (11.93%) SharePoint
2 33 (5.97%) Apache Spark
3 8 (1.45%) WordPress
4 6 (1.08%) CMS
5 5 (0.90%) Apache
6 3 (0.54%) Apache Airflow
7 2 (0.36%) Microsoft Exchange
8 1 (0.18%) Confluence
Applications
1 260 (47.02%) Microsoft Office
2 234 (42.31%) Microsoft Excel
3 16 (2.89%) Microsoft PowerPoint
4 13 (2.35%) MS Visio
5 10 (1.81%) Microsoft Project
6 3 (0.54%) Photoshop
7 1 (0.18%) InDesign
7 1 (0.18%) Simulink
7 1 (0.18%) Spreadsheet
Business Applications
1 2 (0.36%) Lawson
1 2 (0.36%) Primavera
2 1 (0.18%) Oracle EBS
2 1 (0.18%) SAP S/4HANA
Cloud Services
1 38 (6.87%) Azure
2 21 (3.80%) AWS
2 21 (3.80%) SaaS
3 12 (2.17%) Google Analytics
4 11 (1.99%) Power Platform
5 10 (1.81%) Microsoft 365
6 7 (1.27%) Google Ads
7 4 (0.72%) Entra ID
8 3 (0.54%) Azure Data Factory
8 3 (0.54%) GCP
9 2 (0.36%) AWS CloudFormation
9 2 (0.36%) Azure Machine Learning
9 2 (0.36%) Azure Synapse Analytics
9 2 (0.36%) Microsoft Copilot
10 1 (0.18%) Amplience
10 1 (0.18%) Cloudinary
10 1 (0.18%) Cohesity
10 1 (0.18%) Commercetools
10 1 (0.18%) Datadog
10 1 (0.18%) Microsoft Advertising
Communications & Networking
1 27 (4.88%) HTTP
2 9 (1.63%) Wireless
3 7 (1.27%) 3G
3 7 (1.27%) GPRS
3 7 (1.27%) LTE
3 7 (1.27%) Modbus
4 4 (0.72%) Network Security
5 3 (0.54%) Broadband
6 1 (0.18%) Internet
6 1 (0.18%) SAN
6 1 (0.18%) SSL
6 1 (0.18%) Unified Communications
6 1 (0.18%) VPN
Database & Business Intelligence
1 9 (1.63%) Power BI
1 9 (1.63%) SQL Server
2 7 (1.27%) Tableau
3 6 (1.08%) Data Warehouse
4 5 (0.90%) Big Data
5 4 (0.72%) Hadoop
5 4 (0.72%) Relational Database
6 3 (0.54%) Data Lake
6 3 (0.54%) MySQL
6 3 (0.54%) NoSQL
6 3 (0.54%) RDBMS
7 2 (0.36%) Azure SQL Data Warehouse
7 2 (0.36%) Data Mining
7 2 (0.36%) Elasticsearch
7 2 (0.36%) Essbase
7 2 (0.36%) KDB
7 2 (0.36%) MS Access
8 1 (0.18%) MongoDB
8 1 (0.18%) Oracle Database
8 1 (0.18%) Redis
Development Applications
1 38 (6.87%) JIRA
2 7 (1.27%) Git
3 5 (0.90%) Octopus Deploy
3 5 (0.90%) TeamCity
4 4 (0.72%) Selenium
5 3 (0.54%) FitNesse
5 3 (0.54%) Jenkins
5 3 (0.54%) SonarQube
5 3 (0.54%) SQL Server Management Studio (SSMS)
6 1 (0.18%) Gradle
6 1 (0.18%) JUnit
6 1 (0.18%) Maven
6 1 (0.18%) Sonatype Nexus
6 1 (0.18%) Spinnaker
6 1 (0.18%) TestNG
General
1 126 (22.78%) Social Skills
2 118 (21.34%) Finance
3 73 (13.20%) Analytical Skills
4 61 (11.03%) Manufacturing
5 60 (10.85%) Military
6 50 (9.04%) Marketing
6 50 (9.04%) Retail
7 40 (7.23%) Advertising
8 39 (7.05%) Games
9 34 (6.15%) Inclusion and Diversity
10 25 (4.52%) Public Sector
11 18 (3.25%) Legal
12 9 (1.63%) Banking
12 9 (1.63%) Organisational Skills
13 8 (1.45%) Law
13 8 (1.45%) Telecoms
14 7 (1.27%) Influencing Skills
15 6 (1.08%) Aerospace
15 6 (1.08%) Aviation
16 4 (0.72%) Electronics
Job Titles
1 197 (35.62%) Graduate
2 94 (17.00%) Senior
3 62 (11.21%) Analyst
4 50 (9.04%) Project Manager
5 47 (8.50%) Configuration Manager
6 40 (7.23%) Lead
7 31 (5.61%) Software Engineer
8 29 (5.24%) Senior Software Engineer
9 24 (4.34%) Product Manager
10 17 (3.07%) IT Manager
10 17 (3.07%) Senior Analyst
11 11 (1.99%) Architect
11 11 (1.99%) Developer
11 11 (1.99%) Service Manager
12 10 (1.81%) Business Analyst
12 10 (1.81%) Customer Analyst
12 10 (1.81%) Operations Analyst
12 10 (1.81%) Service Analyst
12 10 (1.81%) Solutions Architect
13 9 (1.63%) Designer
Libraries, Frameworks & Software Standards
1 29 (5.24%) Kafka
2 19 (3.44%) .NET
3 7 (1.27%) .NET Core
3 7 (1.27%) Unity (Game Engine)
4 6 (1.08%) CSS
4 6 (1.08%) HTML
5 5 (0.90%) .NET Framework
5 5 (0.90%) AngularJS
5 5 (0.90%) ASP.NET
5 5 (0.90%) ASP.NET MVC
5 5 (0.90%) ASP.NET MVC 4
5 5 (0.90%) Entity Framework
5 5 (0.90%) LINQ
5 5 (0.90%) XML
6 4 (0.72%) Oracle Fusion
6 4 (0.72%) Pandas
7 3 (0.54%) NHibernate
7 3 (0.54%) NumPy
7 3 (0.54%) SciPy
7 3 (0.54%) Web Services
Miscellaneous
1 65 (11.75%) Onboarding
2 27 (4.88%) Distributed Systems
3 24 (4.34%) Management Information System
4 10 (1.81%) Self-Motivation
5 9 (1.63%) Operational Technology
5 9 (1.63%) Social Media
6 8 (1.45%) e-Learning
7 7 (1.27%) Augmented Reality
7 7 (1.27%) Greenfield Project
7 7 (1.27%) IoT
7 7 (1.27%) Mobile App
7 7 (1.27%) NB-IoT
7 7 (1.27%) Virtual Reality
8 6 (1.08%) Virtual Team
9 5 (0.90%) Data Centre
9 5 (0.90%) Legacy Applications
10 4 (0.72%) Algorithms
10 4 (0.72%) Analytical Mindset
10 4 (0.72%) Legacy Systems
10 4 (0.72%) Product Ownership
Operating Systems
1 10 (1.81%) Windows
2 6 (1.08%) Linux
3 4 (0.72%) Windows Server
4 2 (0.36%) Android
4 2 (0.36%) Apple iOS
4 2 (0.36%) Unix
5 1 (0.18%) Kali Linux
Processes & Methodologies
1 267 (48.28%) Continuous Improvement
2 230 (41.59%) Data Analysis
3 221 (39.96%) Customer Service
4 215 (38.88%) Customer Experience
5 209 (37.79%) Process Improvement
6 205 (37.07%) Logistics
7 200 (36.17%) Creative Thinking
8 197 (35.62%) Contingency Planning
9 94 (17.00%) Agile
10 89 (16.09%) Project Management
11 64 (11.57%) Problem-Solving
12 60 (10.85%) Risk Management
13 59 (10.67%) ERP
14 55 (9.95%) Computer Science
15 54 (9.76%) Roadmaps
16 52 (9.40%) Configuration Management
17 48 (8.68%) Bill of Materials
18 42 (7.59%) Analytics
19 39 (7.05%) Decision-Making
20 36 (6.51%) Machine Learning
Programming Languages
1 48 (8.68%) Python
2 29 (5.24%) Scala
3 26 (4.70%) SQL
4 19 (3.44%) C#
5 9 (1.63%) Java
5 9 (1.63%) JavaScript
6 6 (1.08%) R
7 4 (0.72%) Bash
7 4 (0.72%) C++
7 4 (0.72%) Go
8 3 (0.54%) Shell Script
9 2 (0.36%) PHP
9 2 (0.36%) Ruby
9 2 (0.36%) Rust
10 1 (0.18%) MATLAB
10 1 (0.18%) PL/SQL
10 1 (0.18%) PowerShell
10 1 (0.18%) VBA
Qualifications
1 324 (58.59%) Degree
2 21 (3.80%) BPSS Clearance
3 16 (2.89%) PMI Certification
4 13 (2.35%) PMP
5 7 (1.27%) ITIL Certification
6 6 (1.08%) Master's Degree
7 5 (0.90%) SC Cleared
7 5 (0.90%) Security Cleared
8 3 (0.54%) AAT
9 2 (0.36%) CISSP
9 2 (0.36%) DV Cleared
9 2 (0.36%) MBA
9 2 (0.36%) Numerate Degree
10 1 (0.18%) CASP
10 1 (0.18%) CCFP
10 1 (0.18%) CEH
10 1 (0.18%) Computer Science Degree
10 1 (0.18%) GCFA
10 1 (0.18%) GCFE
10 1 (0.18%) GIAC
Quality Assurance & Compliance
1 20 (3.62%) QA
2 15 (2.71%) PMO
3 13 (2.35%) SLA
4 10 (1.81%) Accessibility
4 10 (1.81%) Data Quality
5 8 (1.45%) GDPR
6 4 (0.72%) P3O
7 2 (0.36%) PCI DSS
8 1 (0.18%) 21 CFR Part 11
8 1 (0.18%) Basel III
8 1 (0.18%) COBIT
8 1 (0.18%) Cyber Essentials
8 1 (0.18%) IFRS
8 1 (0.18%) IFRS 9
8 1 (0.18%) ISO/IEC 27001
8 1 (0.18%) ISO/IEC 27002 (supersedes ISO/IEC 17799)
8 1 (0.18%) NCSC
8 1 (0.18%) NIST
System Software
1 9 (1.63%) Virtual Machines
2 6 (1.08%) Docker
3 4 (0.72%) Active Directory
4 1 (0.18%) VMware Infrastructure
Systems Management
1 8 (1.45%) Terraform
2 6 (1.08%) Kubernetes
3 3 (0.54%) Control-M
4 2 (0.36%) Ansible
4 2 (0.36%) Microsoft Intune
4 2 (0.36%) SCCM
5 1 (0.18%) EnCase
5 1 (0.18%) FTK
5 1 (0.18%) Grafana
5 1 (0.18%) Oracle RMAN
5 1 (0.18%) Prometheus
5 1 (0.18%) RSA Security Analytics
Vendors
1 130 (23.51%) Microsoft
2 55 (9.95%) SAP
3 44 (7.96%) Google
4 29 (5.24%) Apple
5 7 (1.27%) Databricks
5 7 (1.27%) ServiceNow
6 6 (1.08%) Ahrefs
6 6 (1.08%) Oracle
7 4 (0.72%) Salesforce
8 3 (0.54%) HubSpot
8 3 (0.54%) RedGate
9 2 (0.36%) Cisco
9 2 (0.36%) Civica
9 2 (0.36%) Cognos
9 2 (0.36%) Facebook
9 2 (0.36%) Instagram
9 2 (0.36%) JD Edwards
9 2 (0.36%) MicroStrategy
9 2 (0.36%) TikTok
9 2 (0.36%) VMware