Google Jobs in England

Google
UK > England

The table below provides summary statistics for permanent job vacancies advertised in England requiring knowledge or experience of Google products and/or services. It includes a benchmarking guide to the annual salaries offered in vacancies that cited Google over the 6 months leading up to 1 May 2025, comparing them to the same period in the previous two years.

The figures below represent the IT labour market in general and are not representative of salaries within Google.

6 months to
1 May 2025
Same period 2024 Same period 2023
Rank 128 92 113
Rank change year-on-year -36 +21 -47
Permanent jobs citing Google 1,108 2,359 2,818
As % of all permanent jobs advertised in England 2.41% 2.77% 3.05%
As % of the Vendors category 6.54% 7.44% 7.30%
Number of salaries quoted 620 1,550 1,606
10th Percentile £31,225 £26,250 £37,000
25th Percentile £40,000 £36,250 £45,000
Median annual salary (50th Percentile) £60,197 £55,000 £65,000
Median % change year-on-year +9.45% -15.38% +4.00%
75th Percentile £85,000 £80,000 £88,750
90th Percentile £97,528 £100,000 £110,000
UK median annual salary £60,000 £55,000 £65,000
% change year-on-year +9.09% -15.38% +4.00%

All Vendors
England

Google falls under the Vendor Products and Services category. For comparison with the information above, the following table provides summary statistics for all permanent job vacancies requiring knowledge or experience of all vendor products and services in England.

Permanent vacancies with a requirement for knowledge or experience of vendor products and services 16,930 31,717 38,620
As % of all permanent jobs advertised in England 36.76% 37.23% 41.74%
Number of salaries quoted 10,620 22,896 22,126
10th Percentile £28,500 £26,500 £30,932
25th Percentile £38,806 £35,924 £41,125
Median annual salary (50th Percentile) £55,000 £50,000 £56,500
Median % change year-on-year +10.00% -11.50% +2.73%
75th Percentile £71,250 £68,750 £75,294
90th Percentile £90,000 £87,500 £93,750
UK median annual salary £55,000 £50,000 £57,500
% change year-on-year +10.00% -13.04% +4.55%

Google
Job Vacancy Trend in England

Job postings citing Google as a proportion of all IT jobs advertised in England.
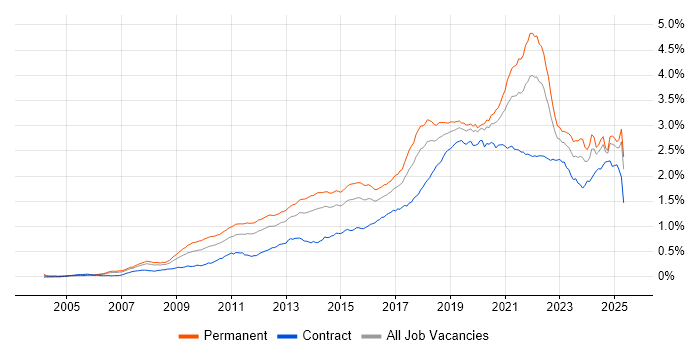
Job vacancy trend for Google in England

Google
Salary Trend in England

3-month moving average salary quoted in jobs citing Google in England.

Salary trend for Google in England

Google
Salary Histogram in England

Salary distribution for jobs citing Google in England over the 6 months to 1 May 2025.

Salary histogram for Google in England

Google
Job Locations in England

The table below looks at the demand and provides a guide to the median salaries quoted in IT jobs citing Google within the England region over the 6 months to 1 May 2025. The 'Rank Change' column provides an indication of the change in demand within each location based on the same 6 month period last year.

Location Rank Change
on Same Period
Last Year
Matching
Permanent
IT Job Ads
Median Salary
Past 6 Months
Median Salary
% Change
on Same Period
Last Year
Live
Jobs
London +18 553 £67,500 -3.57% 1,400
South East 0 167 £40,000 -11.11% 641
North of England -91 161 £69,384 +38.77% 541
North West -75 110 £71,991 +43.98% 272
Midlands -33 100 £42,500 -10.53% 458
West Midlands +4 76 £40,000 -20.79% 224
South West -21 67 £45,000 -10.00% 78
Yorkshire -47 47 £45,000 -5.26% 213
East of England -31 33 £34,500 +21.05% 111
East Midlands -40 24 £43,500 -8.42% 219
North East -5 4 £69,384 +32.16% 59
Google
UK

Google
Co-occurring Skills and Capabilities in England by Category

The follow tables expand on the table above by listing co-occurrences grouped by category. The same employment type, locality and period is covered with up to 20 co-occurrences shown in each of the following categories:

Application Platforms
1 83 (7.49%) CMS
2 47 (4.24%) WordPress
3 44 (3.97%) Apache Spark
4 25 (2.26%) Microsoft Exchange
5 20 (1.81%) Confluence
6 19 (1.71%) Drupal
7 14 (1.26%) WinCC
8 12 (1.08%) SharePoint
9 7 (0.63%) Apache Airflow
9 7 (0.63%) Sitecore CMS
10 6 (0.54%) Apache
11 5 (0.45%) Headless CMS
11 5 (0.45%) IBM Domino
11 5 (0.45%) nginx
12 4 (0.36%) Jupyter
13 3 (0.27%) Adobe Experience Manager
13 3 (0.27%) EPiServer
13 3 (0.27%) OpenStack
14 2 (0.18%) Umbraco
14 2 (0.18%) WebSphere Application Server
Applications
1 97 (8.75%) Microsoft Excel
2 84 (7.58%) Microsoft Office
3 29 (2.62%) Photoshop
4 25 (2.26%) Microsoft PowerPoint
5 17 (1.53%) Adobe Premiere
6 14 (1.26%) EPLAN
7 13 (1.17%) Chatbot
8 9 (0.81%) Acrobat
8 9 (0.81%) Adobe After Effects
8 9 (0.81%) Adobe Creative Suite
8 9 (0.81%) CapCut
9 8 (0.72%) MS Visio
10 7 (0.63%) Adobe Illustrator
11 5 (0.45%) InDesign
12 4 (0.36%) Adobe XD
12 4 (0.36%) Notion
13 3 (0.27%) Maya
13 3 (0.27%) Microsoft Project
13 3 (0.27%) Spreadsheet
14 2 (0.18%) Sketch
Business Applications
1 31 (2.80%) Shopify
2 6 (0.54%) Dynamics CRM
2 6 (0.54%) NetSuite
3 5 (0.45%) CiviCRM
3 5 (0.45%) Payment Gateway
4 3 (0.27%) Salesforce CRM
4 3 (0.27%) SAP S/4HANA
5 2 (0.18%) Magento
6 1 (0.090%) Cloudability
6 1 (0.090%) Distributed Ledger
6 1 (0.090%) Finacle
Cloud Services
1 434 (39.17%) GCP
2 394 (35.56%) Azure
3 332 (29.96%) AWS
4 258 (23.29%) Google Analytics
5 119 (10.74%) Google Ads
6 95 (8.57%) Google Workspace
7 85 (7.67%) Power Platform
8 81 (7.31%) SaaS
9 76 (6.86%) Microsoft 365
10 44 (3.97%) Google Tag Manager
11 37 (3.34%) Facebook Ads
11 37 (3.34%) GitHub
12 35 (3.16%) Google Sheets
13 33 (2.98%) Serverless
14 31 (2.80%) Cloud Computing
15 28 (2.53%) Canva
15 28 (2.53%) Snowflake
16 25 (2.26%) AWS CloudFormation
17 22 (1.99%) Azure DevOps
18 21 (1.90%) Google Docs
Communications & Networking
1 78 (7.04%) Firewall
2 63 (5.69%) DNS
3 54 (4.87%) TCP/IP
4 47 (4.24%) DHCP
5 37 (3.34%) Ethernet
6 36 (3.25%) WAN
7 35 (3.16%) LAN
7 35 (3.16%) Network Security
8 33 (2.98%) HTTP
9 24 (2.17%) SD-WAN
9 24 (2.17%) VLAN
10 22 (1.99%) Cisco ISE
10 22 (1.99%) VPN
11 19 (1.71%) Internet
12 18 (1.62%) Wi-Fi
13 15 (1.35%) BGP
13 15 (1.35%) OSPF
13 15 (1.35%) WLAN
14 14 (1.26%) Modbus
14 14 (1.26%) SMTP
Database & Business Intelligence
1 79 (7.13%) Power BI
2 71 (6.41%) BigQuery
3 66 (5.96%) NoSQL
4 54 (4.87%) PostgreSQL
5 42 (3.79%) Data Warehouse
6 40 (3.61%) Tableau
7 38 (3.43%) Looker
8 37 (3.34%) MongoDB
9 31 (2.80%) MySQL
10 29 (2.62%) Big Data
11 25 (2.26%) Data Mining
12 23 (2.08%) Data Lake
12 23 (2.08%) Metadata
13 22 (1.99%) Relational Database
14 21 (1.90%) Amazon RDS
15 19 (1.71%) Hadoop
16 17 (1.53%) Elasticsearch
17 16 (1.44%) Amazon Redshift
18 15 (1.35%) Redis
19 14 (1.26%) SQL Server
Development Applications
1 54 (4.87%) JIRA
2 51 (4.60%) Git
3 20 (1.81%) Jenkins
4 10 (0.90%) SonarQube
5 9 (0.81%) Maven
6 8 (0.72%) Gradle
7 7 (0.63%) GitLab
8 5 (0.45%) Balsamiq
8 5 (0.45%) CircleCI
8 5 (0.45%) Oracle Forms
8 5 (0.45%) Storybook
8 5 (0.45%) Visual Studio
8 5 (0.45%) Visual Studio Code
9 4 (0.36%) Bazaar
10 3 (0.27%) Bitbucket
10 3 (0.27%) Postman
11 2 (0.18%) Sonatype Nexus
11 2 (0.18%) Spinnaker
12 1 (0.090%) Gatling
12 1 (0.090%) Travis CI
General
1 462 (41.70%) Social Skills
2 300 (27.08%) Marketing
3 296 (26.71%) Analytical Skills
4 251 (22.65%) Finance
5 183 (16.52%) Retail
6 136 (12.27%) Advertising
7 101 (9.12%) Banking
7 101 (9.12%) Inclusion and Diversity
8 85 (7.67%) Law
9 53 (4.78%) Public Sector
10 52 (4.69%) Organisational Skills
11 51 (4.60%) Games
12 46 (4.15%) Legal
13 37 (3.34%) Manufacturing
14 35 (3.16%) Presentation Skills
15 30 (2.71%) Pharmaceutical
16 26 (2.35%) Telecoms
17 23 (2.08%) Automotive
17 23 (2.08%) Brand Awareness
18 22 (1.99%) Publishing
Job Titles
1 202 (18.23%) Senior
2 120 (10.83%) Architect
3 106 (9.57%) Lead
4 80 (7.22%) Developer
5 65 (5.87%) Software Engineer
6 59 (5.32%) Analyst
6 59 (5.32%) Solutions Architect
7 48 (4.33%) Support Engineer
8 38 (3.43%) IT Engineer
9 37 (3.34%) Data Engineer
10 35 (3.16%) IT Support
11 34 (3.07%) Senior Software Engineer
12 33 (2.98%) Cloud Engineer
13 32 (2.89%) Senior Developer
14 31 (2.80%) SEO Specialist
14 31 (2.80%) Systems Engineer
15 29 (2.62%) PPC Executive
16 28 (2.53%) Full-Stack Developer
17 24 (2.17%) Senior Architect
18 23 (2.08%) Infrastructure Engineer
Libraries, Frameworks & Software Standards
1 80 (7.22%) HTML
2 69 (6.23%) CSS
3 57 (5.14%) Kafka
4 55 (4.96%) React
5 51 (4.60%) Node.js
6 48 (4.33%) REST
7 37 (3.34%) RESTful
8 28 (2.53%) JSON
9 25 (2.26%) Spring
10 24 (2.17%) Flask
10 24 (2.17%) HTML5
11 23 (2.08%) AngularJS
12 22 (1.99%) FastAPI
13 21 (1.90%) RabbitMQ
14 19 (1.71%) .NET
14 19 (1.71%) Spring Boot
15 17 (1.53%) GraphQL
16 16 (1.44%) Django
17 15 (1.35%) ARM Templates
18 14 (1.26%) Elastic Stack
Miscellaneous
1 126 (11.37%) Social Media
2 76 (6.86%) Cloud Native
3 58 (5.23%) Management Information System
4 55 (4.96%) Algorithms
5 52 (4.69%) Public Cloud
6 48 (4.33%) Product Ownership
7 45 (4.06%) Distributed Systems
7 45 (4.06%) Self-Motivation
8 43 (3.88%) Blog
9 41 (3.70%) Mobile App
10 28 (2.53%) Data Centre
11 24 (2.17%) Legacy Systems
12 23 (2.08%) Analytical Mindset
13 20 (1.81%) Hybrid Cloud
13 20 (1.81%) Security Posture
14 19 (1.71%) Digital Media
15 18 (1.62%) Mobile Games
16 17 (1.53%) Data Structures
17 16 (1.44%) Graphic Design
17 16 (1.44%) Learning Management System
Operating Systems
1 88 (7.94%) Windows
2 57 (5.14%) Linux
3 47 (4.24%) Windows Server
4 31 (2.80%) Windows 10
5 17 (1.53%) Ubuntu
5 17 (1.53%) Windows Server 2016
5 17 (1.53%) Windows Server 2019
6 16 (1.44%) Android
6 16 (1.44%) Mac OS X
7 14 (1.26%) Unix
8 12 (1.08%) Apple iOS
8 12 (1.08%) Mac OS
9 7 (0.63%) VMS
10 2 (0.18%) CentOS
10 2 (0.18%) Rocky
10 2 (0.18%) Solaris
10 2 (0.18%) Windows 7
11 1 (0.090%) Windows Server 2003
11 1 (0.090%) Windows Server 2008
11 1 (0.090%) Windows Server 2012
Processes & Methodologies
1 421 (38.00%) Analytics
2 311 (28.07%) Problem-Solving
3 255 (23.01%) Agile
4 183 (16.52%) DevOps
5 170 (15.34%) CI/CD
6 160 (14.44%) Digital Marketing
7 158 (14.26%) SEO
8 147 (13.27%) Software Engineering
9 145 (13.09%) Artificial Intelligence
9 145 (13.09%) Roadmaps
10 143 (12.91%) Pay per click
11 121 (10.92%) Computer Science
12 110 (9.93%) Machine Learning
13 107 (9.66%) Mentoring
14 103 (9.30%) Continuous Improvement
15 100 (9.03%) Project Management
16 99 (8.94%) E-Commerce
17 98 (8.84%) Containerisation
18 92 (8.30%) User Experience
19 88 (7.94%) Business Intelligence
Programming Languages
1 264 (23.83%) Python
2 186 (16.79%) SQL
3 133 (12.00%) Java
4 92 (8.30%) JavaScript
5 61 (5.51%) C#
6 49 (4.42%) PowerShell
7 40 (3.61%) Scala
8 37 (3.34%) TypeScript
9 25 (2.26%) Bash
10 23 (2.08%) PHP
11 18 (1.62%) Go
11 18 (1.62%) Kotlin
12 12 (1.08%) R
13 8 (0.72%) Data Analysis Expressions
14 6 (0.54%) C++
15 3 (0.27%) Objective-C
15 3 (0.27%) Ruby
15 3 (0.27%) T-SQL
15 3 (0.27%) XAML
16 2 (0.18%) SQR
Qualifications
1 226 (20.40%) Degree
2 79 (7.13%) Computer Science Degree
3 69 (6.23%) Security Cleared
4 56 (5.05%) SC Cleared
5 50 (4.51%) Azure Certification
6 46 (4.15%) AWS Certification
6 46 (4.15%) Microsoft Certification
7 45 (4.06%) Master's Degree
8 35 (3.16%) HNC
9 28 (2.53%) DBS Check
10 27 (2.44%) AWS Certified Solutions Architect
11 18 (1.62%) Cisco Certification
12 17 (1.53%) PhD
13 16 (1.44%) A+ Certification
13 16 (1.44%) HND
13 16 (1.44%) MCSE
14 15 (1.35%) (ISC)2 CCSP
15 12 (1.08%) CCSP
15 12 (1.08%) CISSP
16 9 (0.81%) MCP
Quality Assurance & Compliance
1 75 (6.77%) GDPR
2 48 (4.33%) QA
3 40 (3.61%) Accessibility
4 31 (2.80%) Data Quality
5 30 (2.71%) NIST
6 27 (2.44%) ISO/IEC 27001
7 26 (2.35%) PCI DSS
8 16 (1.44%) Cyber Essentials
9 15 (1.35%) Sarbanes-Oxley
10 13 (1.17%) California Consumer Privacy Act
11 12 (1.08%) SLA
12 9 (0.81%) HIPAA
12 9 (0.81%) PERC
13 7 (0.63%) GLP
13 7 (0.63%) GMP
13 7 (0.63%) SOC 2
14 5 (0.45%) Actionable Recommendations
15 3 (0.27%) PMO
15 3 (0.27%) WCAG
16 2 (0.18%) COBIT
System Software
1 142 (12.82%) Docker
2 69 (6.23%) Active Directory
3 27 (2.44%) VMware Infrastructure
3 27 (2.44%) VMware NSX
4 24 (2.17%) Hyper-V
5 8 (0.72%) vSphere
6 7 (0.63%) Virtual Machines
7 5 (0.45%) BitLocker
7 5 (0.45%) Microsoft App-V
7 5 (0.45%) Terminal Services
7 5 (0.45%) VMware ESXi
8 4 (0.36%) XenApp
8 4 (0.36%) XenDesktop
9 3 (0.27%) HDFS
9 3 (0.27%) VMware Workstation
10 2 (0.18%) KVM
10 2 (0.18%) NFS
10 2 (0.18%) SRDF
10 2 (0.18%) Veritas Cluster Server
10 2 (0.18%) Xen
Systems Management
1 163 (14.71%) Kubernetes
2 148 (13.36%) Terraform
3 45 (4.06%) Ansible
4 23 (2.08%) FortiGate
5 20 (1.81%) Prometheus
6 18 (1.62%) Microsoft Intune
7 15 (1.35%) Grafana
8 14 (1.26%) Wonderware InTouch
9 12 (1.08%) Argo
9 12 (1.08%) Puppet
10 11 (0.99%) CASB
11 10 (0.90%) AWS Copilot
11 10 (0.90%) Progress Chef
12 9 (0.81%) Istio
13 7 (0.63%) Nagios
13 7 (0.63%) Single Sign-On
14 6 (0.54%) Jamf Pro
14 6 (0.54%) linkerd
15 5 (0.45%) vCenter Server
15 5 (0.45%) vMotion
Vendors
1 370 (33.39%) Microsoft
2 73 (6.59%) Adobe
3 66 (5.96%) TikTok
4 64 (5.78%) Facebook
5 61 (5.51%) VMware
6 59 (5.32%) Apple
7 55 (4.96%) Cisco
8 43 (3.88%) Salesforce
9 41 (3.70%) Instagram
9 41 (3.70%) SAP
10 36 (3.25%) Pinterest
11 30 (2.71%) Ahrefs
12 27 (2.44%) OpenAI
12 27 (2.44%) ServiceNow
13 26 (2.35%) F5
14 25 (2.26%) CheckPoint
15 24 (2.17%) Oracle
16 23 (2.08%) Screaming Frog
17 22 (1.99%) Blue Coat
18 21 (1.90%) IBM