Roadmaps Jobs in the North of England

Roadmaps
England > North of England

The following table provides summary statistics for permanent job vacancies advertised in the North of England with a requirement for Roadmaps skills. Included is a benchmarking guide to the salaries offered in vacancies that have cited Roadmaps over the 6 months to 2 December 2023 with a comparison to the same period in the previous 2 years.

6 months to
2 Dec 2023
Same period 2022 Same period 2021
Rank 26 28 38
Rank change year-on-year +2 +10 -4
Permanent jobs citing Roadmaps 648 1,542 1,160
As % of all permanent jobs advertised in the North of England 8.33% 9.02% 6.92%
As % of the Processes & Methodologies category 8.76% 9.38% 7.27%
Number of salaries quoted 412 834 901
10th Percentile £46,375 £38,386 £38,250
25th Percentile £56,219 £49,716 £46,250
Median annual salary (50th Percentile) £67,500 £65,000 £60,000
Median % change year-on-year +3.85% +8.33% +9.09%
75th Percentile £85,000 £80,938 £75,000
90th Percentile £96,539 £95,000 £91,250
England median annual salary £75,000 £72,500 £70,000
% change year-on-year +3.45% +3.57% +7.69%

All Process and Methodology Skills
North of England

Roadmaps is in the Processes and Methodologies category. The following table is for comparison with the above and provides summary statistics for all permanent job vacancies advertised in the North of England with a requirement for process or methodology skills.

Permanent vacancies with a requirement for process or methodology skills 7,399 16,443 15,956
As % of all permanent jobs advertised in the North of England 95.10% 96.20% 95.23%
Number of salaries quoted 5,165 9,451 11,682
10th Percentile £30,000 £30,831 £30,000
25th Percentile £41,250 £40,000 £37,500
Median annual salary (50th Percentile) £55,000 £52,500 £50,000
Median % change year-on-year +4.76% +5.00% +5.26%
75th Percentile £68,750 £70,000 £65,000
90th Percentile £83,750 £85,000 £78,750
England median annual salary £60,000 £62,500 £60,000
% change year-on-year -4.00% +4.17% +9.09%

Roadmaps
Job Vacancy Trend in the North of England

Job postings citing Roadmaps as a proportion of all IT jobs advertised in the North of England.
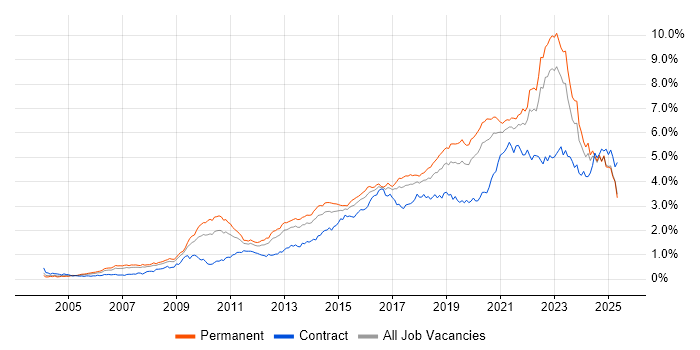
Job vacancy trend for Roadmaps in the North of England

Roadmaps
Salary Trend in the North of England

3-month moving average salary quoted in jobs citing Roadmaps in the North of England.

Salary trend for Roadmaps in the North of England

Roadmaps
Salary Histogram in the North of England

Salary distribution for jobs citing Roadmaps in the North of England over the 6 months to 2 December 2023.

Salary histogram for Roadmaps in the North of England

Roadmaps
Job Locations in the North of England

The table below looks at the demand and provides a guide to the median salaries quoted in IT jobs citing Roadmaps within the North of England region over the 6 months to 2 December 2023. The 'Rank Change' column provides an indication of the change in demand within each location based on the same 6 month period last year.

Location Rank Change
on Same Period
Last Year
Matching
Permanent
IT Job Ads
Median Salary
Past 6 Months
Median Salary
% Change
on Same Period
Last Year
Live
Jobs
North West +1 334 £66,757 +11.26% 180
Yorkshire -5 272 £72,500 +4.40% 84
North East +16 44 £60,000 -4.00% 38
Roadmaps
England

Roadmaps
Co-occurring Skills and Capabilities in the North of England by Category

The follow tables expand on the table above by listing co-occurrences grouped by category. The same employment type, locality and period is covered with up to 20 co-occurrences shown in each of the following categories:

Application Platforms
1 12 (1.85%) SharePoint
2 4 (0.62%) Oracle SOA Suite
3 3 (0.46%) CMS
4 2 (0.31%) Drupal
5 1 (0.15%) IIS
5 1 (0.15%) MS Exchange
5 1 (0.15%) NetWeaver
5 1 (0.15%) OpenEdge
5 1 (0.15%) OpenStack
Applications
1 4 (0.62%) Chatbot
2 2 (0.31%) Microsoft Excel
2 2 (0.31%) Microsoft Office
2 2 (0.31%) Microsoft PowerPoint
2 2 (0.31%) MS Visio
3 1 (0.15%) Microsoft Project
3 1 (0.15%) Trello
Business Applications
1 63 (9.72%) Dynamics CRM
2 15 (2.31%) SAP S/4HANA
3 12 (1.85%) SAP ERP
4 8 (1.23%) Unit4 Business World
5 2 (0.31%) OpenText VIM for SAP
5 2 (0.31%) SAP BPC
6 1 (0.15%) IBM Planning Analytics
6 1 (0.15%) Magento
6 1 (0.15%) ReMetrica
6 1 (0.15%) SAP HR
6 1 (0.15%) Sparx Enterprise Architect
Cloud Services
1 231 (35.65%) Azure
2 147 (22.69%) PaaS
3 137 (21.14%) SaaS
4 123 (18.98%) IaaS
5 92 (14.20%) AWS
6 86 (13.27%) GCP
7 80 (12.35%) Power Platform
8 65 (10.03%) Dynamics 365
8 65 (10.03%) Serverless
9 59 (9.10%) Azure Functions
10 41 (6.33%) Azure DevOps
11 25 (3.86%) Microsoft 365
12 16 (2.47%) OpenShift
13 13 (2.01%) GitHub
14 10 (1.54%) Entra ID
15 8 (1.23%) Azure Monitor
15 8 (1.23%) PowerApps
16 6 (0.93%) AWS CodePipeline
16 6 (0.93%) Azure Sentinel
16 6 (0.93%) Azure Storage
Communications & Networking
1 18 (2.78%) Firewall
2 15 (2.31%) DNS
3 13 (2.01%) Network Security
4 10 (1.54%) WAN
5 9 (1.39%) LAN
6 7 (1.08%) Wi-Fi
7 6 (0.93%) SD-WAN
7 6 (0.93%) VPN
8 5 (0.77%) DHCP
8 5 (0.77%) Internet
8 5 (0.77%) MPLS
8 5 (0.77%) TCP/IP
8 5 (0.77%) Unified Communications
9 4 (0.62%) VLAN
10 3 (0.46%) Ethernet VPN
10 3 (0.46%) Reverse Proxy
10 3 (0.46%) SAN
10 3 (0.46%) VXLAN
11 2 (0.31%) VoIP
12 1 (0.15%) HTTP
Database & Business Intelligence
1 57 (8.80%) Data Warehouse
2 53 (8.18%) Data Lake
2 53 (8.18%) NoSQL
3 21 (3.24%) SQL Server
4 17 (2.62%) MongoDB
5 16 (2.47%) Elasticsearch
6 13 (2.01%) Power BI
7 11 (1.70%) Azure SQL Database
8 10 (1.54%) MySQL
9 6 (0.93%) Amazon Athena
9 6 (0.93%) Amazon QuickSight
9 6 (0.93%) Amazon RDS
9 6 (0.93%) Amazon Redshift
9 6 (0.93%) BusinessObjects
9 6 (0.93%) DataStage
9 6 (0.93%) DynamoDB
9 6 (0.93%) IBM InfoSphere
9 6 (0.93%) PostgreSQL
10 5 (0.77%) Relational Database
11 4 (0.62%) BigQuery
Development Applications
1 30 (4.63%) Jenkins
2 21 (3.24%) Git
3 16 (2.47%) Cucumber
3 16 (2.47%) Cypress.io
3 16 (2.47%) Selenium
4 12 (1.85%) JIRA
5 4 (0.62%) Octopus Deploy
6 2 (0.31%) Oracle Forms
6 2 (0.31%) Visual Studio
7 1 (0.15%) Bitbucket
7 1 (0.15%) ERwin
7 1 (0.15%) GoCD
7 1 (0.15%) Gradle
7 1 (0.15%) NUnit
7 1 (0.15%) Postman
7 1 (0.15%) Redmine
7 1 (0.15%) SoapUI
7 1 (0.15%) SonarQube
7 1 (0.15%) TeamCity
7 1 (0.15%) Visual Studio Code
General
1 341 (52.62%) Finance
2 141 (21.76%) Banking
3 111 (17.13%) Social Skills
4 67 (10.34%) Retail
5 50 (7.72%) Analytical Skills
6 34 (5.25%) Inclusion and Diversity
7 32 (4.94%) Marketing
8 27 (4.17%) Influencing Skills
9 21 (3.24%) Legal
10 20 (3.09%) Law
11 17 (2.62%) Public Sector
12 12 (1.85%) Aerospace
12 12 (1.85%) Manufacturing
13 10 (1.54%) Organisational Skills
14 9 (1.39%) Presentation Skills
15 8 (1.23%) Back Office
15 8 (1.23%) Billing
15 8 (1.23%) Games
16 5 (0.77%) Tech for Good
16 5 (0.77%) Telecoms
Job Titles
1 294 (45.37%) Architect
2 139 (21.45%) Enterprise Architect
3 72 (11.11%) Lead
4 71 (10.96%) Solutions Architect
5 67 (10.34%) Senior
6 57 (8.80%) Dynamics 365 Architect
7 54 (8.33%) CRM Architect
7 54 (8.33%) Dynamics CRM Architect
8 37 (5.71%) Commercial Architect
9 32 (4.94%) Cloud Engineer
10 28 (4.32%) Developer
10 28 (4.32%) Product Manager
11 24 (3.70%) Analyst
12 23 (3.55%) Product Owner
13 20 (3.09%) Software Engineer
14 18 (2.78%) Cloud Security Engineer
14 18 (2.78%) Security Engineer
15 16 (2.47%) Business Analyst
16 13 (2.01%) Project Manager
16 13 (2.01%) Technical Architect
Libraries, Frameworks & Software Standards
1 59 (9.10%) OpenID
2 37 (5.71%) .NET
3 28 (4.32%) Kafka
4 24 (3.70%) Web Services
5 20 (3.09%) REST
6 18 (2.78%) JWT
7 15 (2.31%) React
8 11 (1.70%) OAuth
9 10 (1.54%) CSS
9 10 (1.54%) HTML
10 8 (1.23%) JSON
10 8 (1.23%) Node.js
10 8 (1.23%) YAML
11 7 (1.08%) jQuery
12 6 (0.93%) .NET Core
12 6 (0.93%) AngularJS
12 6 (0.93%) ARM Templates
12 6 (0.93%) Azure Blueprints
13 5 (0.77%) RESTful
14 4 (0.62%) Oracle Fusion
Miscellaneous
1 87 (13.43%) Product Ownership
2 56 (8.64%) Public Cloud
3 55 (8.49%) Mainframe
4 50 (7.72%) Blockchain
5 31 (4.78%) Cloud Native
6 27 (4.17%) Data Centre
7 21 (3.24%) Enterprise Software
8 15 (2.31%) Virtual Team
9 14 (2.16%) Management Information System
10 10 (1.54%) Private Cloud
10 10 (1.54%) Renewable Energy
11 8 (1.23%) Linux Command Line
12 7 (1.08%) Replication
13 6 (0.93%) Legacy Systems
14 5 (0.77%) Data Structures
14 5 (0.77%) Greenfield Project
15 4 (0.62%) Digital Signage
15 4 (0.62%) IoT
15 4 (0.62%) Onboarding
15 4 (0.62%) Video Conferencing
Operating Systems
1 51 (7.87%) Unix
2 26 (4.01%) Windows
3 18 (2.78%) Linux
4 9 (1.39%) Windows Server
5 5 (0.77%) HPUX
5 5 (0.77%) Red Hat Enterprise Linux
5 5 (0.77%) Solaris
6 3 (0.46%) Android
6 3 (0.46%) Apple iOS
6 3 (0.46%) Windows Server 2012
6 3 (0.46%) Windows Server 2016
6 3 (0.46%) Windows Server 2019
7 1 (0.15%) Ubuntu
7 1 (0.15%) VMS
7 1 (0.15%) Windows 10
Processes & Methodologies
1 415 (64.04%) Agile
2 171 (26.39%) Strategic Roadmap
3 151 (23.30%) Enterprise Architecture
4 126 (19.44%) DevOps
5 99 (15.28%) Product Roadmap
5 99 (15.28%) Technology Roadmap
6 86 (13.27%) Cybersecurity
7 81 (12.50%) Customer Service
8 80 (12.35%) Microservices
9 79 (12.19%) Thought Leadership
10 74 (11.42%) CRM
11 72 (11.11%) SOA
12 70 (10.80%) Analytics
12 70 (10.80%) Machine Learning
13 69 (10.65%) Data Integration
14 68 (10.49%) Architectural Design
14 68 (10.49%) IT Strategy
15 64 (9.88%) Problem-Solving
16 63 (9.72%) Technology Strategy
17 61 (9.41%) Artificial Intelligence
Programming Languages
1 61 (9.41%) SQL
2 54 (8.33%) Python
3 36 (5.56%) C#
3 36 (5.56%) JavaScript
4 33 (5.09%) PowerShell
5 28 (4.32%) Java
6 19 (2.93%) Bash
6 19 (2.93%) C++
7 8 (1.23%) Bicep
8 7 (1.08%) PHP
9 5 (0.77%) TypeScript
10 3 (0.46%) T-SQL
11 2 (0.31%) Data Analysis Expressions
11 2 (0.31%) Perl
11 2 (0.31%) Rust
11 2 (0.31%) VB
12 1 (0.15%) ABAP
12 1 (0.15%) Delphi
12 1 (0.15%) Shell Script
Qualifications
1 36 (5.56%) Degree
2 27 (4.17%) Security Cleared
3 13 (2.01%) Azure Certification
3 13 (2.01%) SC Cleared
4 8 (1.23%) CISMP
5 5 (0.77%) ITIL Certification
6 4 (0.62%) Microsoft Certification
6 4 (0.62%) PMI Certification
6 4 (0.62%) PMP
7 3 (0.46%) Cisco Certification
7 3 (0.46%) Computer Science Degree
7 3 (0.46%) Master's Degree
7 3 (0.46%) MCP
7 3 (0.46%) Network+ Certification
7 3 (0.46%) OCP
7 3 (0.46%) Oracle Certification
8 2 (0.31%) CCIE
8 2 (0.31%) CISSP
8 2 (0.31%) JNCIE
8 2 (0.31%) TOGAF Certification
Quality Assurance & Compliance
1 19 (2.93%) GRC
2 11 (1.70%) GDPR
3 10 (1.54%) Data Quality
4 7 (1.08%) PMO
4 7 (1.08%) QA
5 5 (0.77%) ISO/IEC 27001
6 4 (0.62%) Cyber Essentials
6 4 (0.62%) NIST
7 3 (0.46%) SLA
8 2 (0.31%) COBIT
8 2 (0.31%) PSD2
9 1 (0.15%) Cyber Essentials PLUS
9 1 (0.15%) ISO 9001
9 1 (0.15%) P3O
9 1 (0.15%) PCI DSS
9 1 (0.15%) WCAG
System Software
1 43 (6.64%) Docker
2 15 (2.31%) Active Directory
3 10 (1.54%) VMware Infrastructure
4 7 (1.08%) Virtual Machines
5 5 (0.77%) Firmware
6 4 (0.62%) Hyper-V
7 3 (0.46%) vSphere
8 2 (0.31%) Virtual Desktop
8 2 (0.31%) VMware ESXi
9 1 (0.15%) KVM
9 1 (0.15%) RACF
Systems Management
1 82 (12.65%) Kubernetes
2 24 (3.70%) Terraform
3 8 (1.23%) Istio
3 8 (1.23%) SCCM
4 6 (0.93%) Ansible
4 6 (0.93%) Microsoft Intune
5 2 (0.31%) Oracle Identity Management
5 2 (0.31%) WebSphere Cast Iron
6 1 (0.15%) Active Directory Federation Services
6 1 (0.15%) Single Sign-On
6 1 (0.15%) WSUS
Vendors
1 123 (18.98%) Microsoft
2 35 (5.40%) SAP
3 30 (4.63%) Google
4 16 (2.47%) Oracle
4 16 (2.47%) Salesforce
5 13 (2.01%) Cisco
6 12 (1.85%) IBM
6 12 (1.85%) VMware
7 11 (1.70%) ServiceNow
8 7 (1.08%) HP
8 7 (1.08%) Sun
9 6 (0.93%) Confluent
10 5 (0.77%) Unisys
11 4 (0.62%) Sitecore
12 3 (0.46%) Aruba
12 3 (0.46%) Databricks
12 3 (0.46%) Juniper
13 2 (0.31%) ABBYY
13 2 (0.31%) Blue Prism
13 2 (0.31%) Workday