SQL Server Jobs in the South West

Microsoft SQL Server (MS SQL)
England > South West

The table below provides summary statistics for permanent job vacancies advertised in the South West requiring SQL Server skills. It includes a benchmarking guide to the annual salaries offered in vacancies that cited SQL Server over the 6 months leading up to 12 July 2025, comparing them to the same period in the previous two years.

6 months to
12 Jul 2025
Same period 2024 Same period 2023
Rank 87 59 59
Rank change year-on-year -28 0 -24
Permanent jobs citing SQL Server 102 367 308
As % of all permanent jobs advertised in the South West 2.60% 3.65% 4.83%
As % of the Database & Business Intelligence category 20.52% 28.67% 25.04%
Number of salaries quoted 82 301 252
10th Percentile £34,500 £33,250 £32,775
25th Percentile £40,688 £42,500 £40,000
Median annual salary (50th Percentile) £50,000 £55,000 £50,000
Median % change year-on-year -9.09% +10.00% +5.26%
75th Percentile £59,688 £63,750 £62,500
90th Percentile £71,750 £71,250 £70,250
England median annual salary £56,000 £55,000 £57,443
% change year-on-year +1.82% -4.25% +4.44%

All Database and Business Intelligence Skills
South West

SQL Server falls under the Databases and Business Intelligence category. For comparison with the information above, the following table provides summary statistics for all permanent job vacancies requiring database or business intelligence skills in the South West.

Permanent vacancies with a requirement for database or business intelligence skills 497 1,280 1,230
As % of all permanent jobs advertised in the South West 12.67% 12.73% 19.28%
Number of salaries quoted 319 842 859
10th Percentile £32,544 £32,500 £34,723
25th Percentile £40,000 £42,500 £41,250
Median annual salary (50th Percentile) £54,000 £53,168 £55,000
Median % change year-on-year +1.56% -3.33% +10.00%
75th Percentile £67,500 £65,000 £70,000
90th Percentile £82,948 £76,250 £85,000
England median annual salary £62,000 £60,000 £65,000
% change year-on-year +3.33% -7.69% +8.33%

SQL Server
Job Vacancy Trend in the South West

Job postings citing SQL Server as a proportion of all IT jobs advertised in the South West.
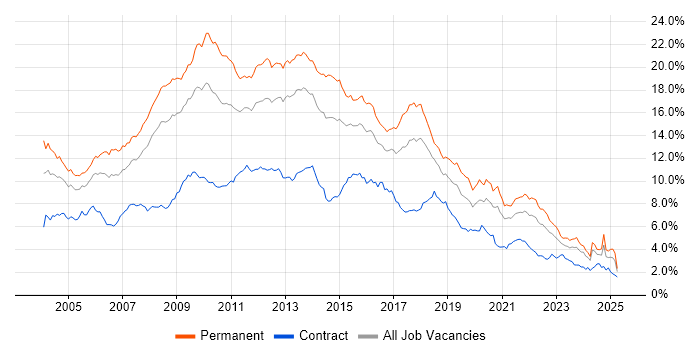
Job vacancy trend for SQL Server in the South West

SQL Server
Salary Trend in the South West

3-month moving average salary quoted in jobs citing SQL Server in the South West.

Salary trend for SQL Server in the South West

SQL Server
Salary Histogram in the South West

Salary distribution for jobs citing SQL Server in the South West over the 6 months to 12 July 2025.

Salary histogram for SQL Server in the South West

SQL Server
Job Locations in the South West

The table below looks at the demand and provides a guide to the median salaries quoted in IT jobs citing SQL Server within the South West region over the 6 months to 12 July 2025. The 'Rank Change' column provides an indication of the change in demand within each location based on the same 6 month period last year.

Location Rank Change
on Same Period
Last Year
Matching
Permanent
IT Job Ads
Median Salary
Past 6 Months
Median Salary
% Change
on Same Period
Last Year
Live
Jobs
Bristol -8 29 £43,875 -16.43% 22
Wiltshire -3 22 £53,750 -2.27% 13
Dorset +26 20 £50,000 -6.98% 4
Gloucestershire +23 11 £55,000 +4.76% 22
Somerset 0 10 £35,000 -26.32% 13
Devon -21 10 £31,000 -34.74% 5
SQL Server
England

SQL Server
Co-occurring Skills and Capabilities in the South West by Category

The follow tables expand on the table above by listing co-occurrences grouped by category. The same employment type, locality and period is covered with up to 20 co-occurrences shown in each of the following categories:

Application Platforms
1 6 (5.88%) Microsoft Exchange
1 6 (5.88%) SharePoint
2 5 (4.90%) IIS
3 4 (3.92%) Confluence
4 3 (2.94%) Apache Airflow
5 2 (1.96%) NServiceBus
6 1 (0.98%) Apache
6 1 (0.98%) CMS
6 1 (0.98%) Luigi
6 1 (0.98%) Umbraco
Applications
1 3 (2.94%) Microsoft Office
2 2 (1.96%) Microsoft Excel
2 2 (1.96%) Microsoft PowerPoint
Business Applications
1 5 (4.90%) NetSuite
2 3 (2.94%) Dynamics AX
2 3 (2.94%) Infor CloudSuite
2 3 (2.94%) Infor CloudSuite Industrial (formerly SyteLine)
3 2 (1.96%) Dynamics CRM
4 1 (0.98%) Dynamics NAV
Cloud Services
1 51 (50.00%) Azure
2 25 (24.51%) Microsoft 365
3 23 (22.55%) Power Platform
4 17 (16.67%) AWS
5 10 (9.80%) IaaS
6 9 (8.82%) Azure DevOps
7 7 (6.86%) Entra ID
8 6 (5.88%) PaaS
8 6 (5.88%) Serverless
9 5 (4.90%) Rubrik
9 5 (4.90%) Snowflake
10 4 (3.92%) Dynamics 365
10 4 (3.92%) Power Automate
10 4 (3.92%) SaaS
11 3 (2.94%) Azure Cosmos DB
11 3 (2.94%) GitHub
11 3 (2.94%) Matillion
12 2 (1.96%) Azure ExpressRoute
12 2 (1.96%) Azure Monitor
13 1 (0.98%) Azure Logic Apps
Communications & Networking
1 19 (18.63%) Firewall
2 16 (15.69%) LAN
2 16 (15.69%) WAN
3 11 (10.78%) Wi-Fi
4 10 (9.80%) VPN
5 9 (8.82%) SD-WAN
6 8 (7.84%) DNS
7 7 (6.86%) DHCP
7 7 (6.86%) VLAN
7 7 (6.86%) VoIP
8 5 (4.90%) TCP/IP
9 4 (3.92%) Internet
9 4 (3.92%) SAN
9 4 (3.92%) Wireless
10 2 (1.96%) Cisco IOS
10 2 (1.96%) IPsec
10 2 (1.96%) MPLS
10 2 (1.96%) Unified Communications
11 1 (0.98%) FTP
11 1 (0.98%) HTTP
Database & Business Intelligence
1 22 (21.57%) Power BI
2 18 (17.65%) SQL Server Integration Services
3 13 (12.75%) SQL Server Reporting Services
4 8 (7.84%) Azure SQL Database
4 8 (7.84%) Relational Database
4 8 (7.84%) SQL Server Analysis Services
5 6 (5.88%) Data Mining
5 6 (5.88%) Data Warehouse
6 4 (3.92%) Amazon RDS
6 4 (3.92%) FileMaker
6 4 (3.92%) NoSQL
6 4 (3.92%) PostgreSQL
7 3 (2.94%) Crystal Reports
7 3 (2.94%) MongoDB
7 3 (2.94%) MS Access
8 2 (1.96%) MySQL
8 2 (1.96%) OLAP
8 2 (1.96%) RDBMS
8 2 (1.96%) Tableau
8 2 (1.96%) ThoughtSpot
Development Applications
1 13 (12.75%) Git
2 6 (5.88%) GitLab
3 4 (3.92%) Jenkins
3 4 (3.92%) JIRA
3 4 (3.92%) Visual Studio
4 3 (2.94%) Postman
4 3 (2.94%) Team Foundation Server
5 2 (1.96%) Fiddler
5 2 (1.96%) TeamCity
6 1 (0.98%) Log4Net
6 1 (0.98%) Octopus Deploy
6 1 (0.98%) Rational Rhapsody
6 1 (0.98%) SQL Server Management Studio (SSMS)
6 1 (0.98%) Subversion
6 1 (0.98%) Visual Studio Code
General
1 39 (38.24%) Social Skills
2 20 (19.61%) Analytical Skills
3 16 (15.69%) Manufacturing
4 14 (13.73%) Finance
5 9 (8.82%) Documentation Skills
6 5 (4.90%) Advertising
7 4 (3.92%) Inclusion and Diversity
8 3 (2.94%) Aerospace
8 3 (2.94%) Retail
9 2 (1.96%) Aviation
9 2 (1.96%) Electronics
9 2 (1.96%) Games
9 2 (1.96%) Law
9 2 (1.96%) Legal
9 2 (1.96%) Marketing
9 2 (1.96%) Military
9 2 (1.96%) Public Sector
9 2 (1.96%) Telecoms
10 1 (0.98%) Back Office
10 1 (0.98%) Tech for Good
Job Titles
1 36 (35.29%) Developer
2 22 (21.57%) IT Support
3 20 (19.61%) Analyst
4 14 (13.73%) IT Analyst
4 14 (13.73%) IT Support Analyst
4 14 (13.73%) Support Analyst
5 12 (11.76%) Infrastructure Engineer
5 12 (11.76%) IT Engineer
5 12 (11.76%) Lead
6 10 (9.80%) Senior
7 9 (8.82%) .NET Developer
7 9 (8.82%) IT Infrastructure Engineer
8 8 (7.84%) IT Support Engineer
8 8 (7.84%) SQL Developer
8 8 (7.84%) Support Engineer
9 6 (5.88%) Business Analyst
9 6 (5.88%) Full-Stack Developer
9 6 (5.88%) Lead Developer
9 6 (5.88%) Network Engineer
10 5 (4.90%) Graduate IT Support
Libraries, Frameworks & Software Standards
1 33 (32.35%) .NET
2 16 (15.69%) .NET Core
3 11 (10.78%) .NET Framework
4 9 (8.82%) React
5 8 (7.84%) AngularJS
5 8 (7.84%) ASP.NET
5 8 (7.84%) HTML
5 8 (7.84%) REST
6 7 (6.86%) CSS
6 7 (6.86%) Web Services
7 6 (5.88%) HTML5
7 6 (5.88%) RESTful
8 5 (4.90%) 802.1X
8 5 (4.90%) Vue
9 4 (3.92%) Entity Framework
9 4 (3.92%) JSON
10 3 (2.94%) ASP.NET MVC
10 3 (2.94%) jQuery
10 3 (2.94%) Swagger
10 3 (2.94%) XML
Miscellaneous
1 12 (11.76%) Self-Motivation
2 8 (7.84%) Management Information System
3 5 (4.90%) Analytical Mindset
3 5 (4.90%) BYOD
3 5 (4.90%) Smartphone
4 4 (3.92%) IoT
5 3 (2.94%) Clustering
5 3 (2.94%) Robotics
6 2 (1.96%) Client/Server
6 2 (1.96%) Legacy Applications
6 2 (1.96%) Legacy Systems
6 2 (1.96%) Onboarding
6 2 (1.96%) Public Cloud
7 1 (0.98%) Mobile App
7 1 (0.98%) NHS
7 1 (0.98%) PACS
7 1 (0.98%) Product Ownership
7 1 (0.98%) Replication
Operating Systems
1 26 (25.49%) Windows
2 23 (22.55%) Windows Server
3 14 (13.73%) Linux
4 3 (2.94%) Windows Server 2019
5 2 (1.96%) Mac OS
5 2 (1.96%) Windows 10
5 2 (1.96%) Windows Server 2016
6 1 (0.98%) Windows Server 2012
Processes & Methodologies
1 27 (26.47%) Problem-Solving
2 26 (25.49%) Business Intelligence
3 24 (23.53%) Agile
4 20 (19.61%) DevOps
5 17 (16.67%) Mentoring
6 16 (15.69%) Migration
7 15 (14.71%) Computer Science
8 13 (12.75%) Microservices
9 12 (11.76%) Analytics
9 12 (11.76%) Disaster Recovery
9 12 (11.76%) ERP
9 12 (11.76%) Infrastructure Engineering
9 12 (11.76%) Software Engineering
10 10 (9.80%) Decision-Making
11 9 (8.82%) Business Analysis
11 9 (8.82%) CI/CD
11 9 (8.82%) Full-Stack Development
12 8 (7.84%) Cybersecurity
12 8 (7.84%) Database Security
12 8 (7.84%) Process Improvement
Programming Languages
1 51 (50.00%) SQL
2 31 (30.39%) C#
3 21 (20.59%) JavaScript
4 13 (12.75%) PowerShell
5 12 (11.76%) T-SQL
6 6 (5.88%) Python
6 6 (5.88%) TypeScript
7 5 (4.90%) VB
7 5 (4.90%) VBA
8 4 (3.92%) VB.NET
9 3 (2.94%) PHP
9 3 (2.94%) PL/SQL
10 2 (1.96%) VB6
11 1 (0.98%) C
11 1 (0.98%) Java
11 1 (0.98%) Shell Script
Qualifications
1 24 (23.53%) Degree
2 15 (14.71%) Computer Science Degree
3 12 (11.76%) Security Cleared
4 6 (5.88%) SC Cleared
5 2 (1.96%) ACMT
5 2 (1.96%) BPSS Clearance
5 2 (1.96%) CCNA
5 2 (1.96%) CCNP
5 2 (1.96%) Cisco Certification
5 2 (1.96%) CISSP
5 2 (1.96%) Microsoft Certification
5 2 (1.96%) Tableau Certification
5 2 (1.96%) VMware Certified Professional (VCP)
6 1 (0.98%) AWS Certification
6 1 (0.98%) Azure Certification
6 1 (0.98%) MCSA
6 1 (0.98%) SANS
Quality Assurance & Compliance
1 7 (6.86%) Cyber Essentials
2 6 (5.88%) ISO/IEC 27001
3 4 (3.92%) Data Quality
4 3 (2.94%) QA
5 2 (1.96%) Accessibility
6 1 (0.98%) DICOM
6 1 (0.98%) GDPR
6 1 (0.98%) HL7
6 1 (0.98%) ISO 9001
6 1 (0.98%) SLA
System Software
1 15 (14.71%) Hyper-V
2 14 (13.73%) Active Directory
2 14 (13.73%) VMware Infrastructure
3 6 (5.88%) Docker
4 5 (4.90%) vSphere
5 4 (3.92%) VMware ESXi
6 2 (1.96%) Virtual Machines
6 2 (1.96%) XenApp
Systems Management
1 9 (8.82%) Microsoft Intune
2 6 (5.88%) Terraform
3 5 (4.90%) Kubernetes
4 4 (3.92%) Ansible
5 2 (1.96%) Autotask
5 2 (1.96%) SCCM
5 2 (1.96%) vCenter Server
Vendors
1 53 (51.96%) Microsoft
2 22 (21.57%) VMware
3 13 (12.75%) Veeam
4 11 (10.78%) Cisco
5 7 (6.86%) Apple
5 7 (6.86%) Aruba
5 7 (6.86%) HP
6 5 (4.90%) Google
6 5 (4.90%) LexisNexis
6 5 (4.90%) Oracle
7 4 (3.92%) Citrix
7 4 (3.92%) Salesforce
8 3 (2.94%) IFS
8 3 (2.94%) Infor
9 2 (1.96%) Databricks
9 2 (1.96%) Datto
9 2 (1.96%) Extreme Networks
9 2 (1.96%) Fortinet
9 2 (1.96%) SolarWinds
9 2 (1.96%) Zscaler