High Availability Contracts in the City of London

High Availability
Central London > City of London

The table below provides summary statistics for contract job vacancies advertised in the City of London requiring High Availability skills. It includes a benchmarking guide to the contractor rates offered in vacancies that cited High Availability over the 6 months leading up to 3 July 2025, comparing them to the same period in the previous two years.

6 months to
3 Jul 2025
Same period 2024 Same period 2023
Rank 79 111 130
Rank change year-on-year +32 +19 +38
Contract jobs citing High Availability 36 14 39
As % of all contract jobs advertised in the City of London 2.00% 0.66% 1.13%
As % of the Processes & Methodologies category 2.13% 0.72% 1.24%
Number of daily rates quoted 24 8 33
10th Percentile £416 £333 £422
25th Percentile £513 £416 £481
Median daily rate (50th Percentile) £650 £593 £550
Median % change year-on-year +9.70% +7.73% -29.03%
75th Percentile £740 £819 £675
90th Percentile £757 £1,010 -
Central London median daily rate £650 £550 £550
% change year-on-year +18.18% - -29.03%

All Process and Methodology Skills
City of London

High Availability falls under the Processes and Methodologies category. For comparison with the information above, the following table provides summary statistics for all contract job vacancies requiring process or methodology skills in the City of London.

Contract vacancies with a requirement for process or methodology skills 1,687 1,944 3,153
As % of all contract IT jobs advertised in the City of London 93.88% 91.05% 91.15%
Number of daily rates quoted 1,080 1,349 2,115
10th Percentile £350 £363 £350
25th Percentile £450 £463 £478
Median daily rate (50th Percentile) £560 £575 £600
Median % change year-on-year -2.62% -4.17% +4.35%
75th Percentile £688 £688 £725
90th Percentile £775 £800 £825
Central London median daily rate £550 £560 £600
% change year-on-year -1.79% -6.67% +5.26%
Number of hourly rates quoted 20 15 24
10th Percentile £17.02 £20.04 £14.25
25th Percentile £24.43 £20.36 £16.33
Median hourly rate £29.75 £27.00 £35.00
Median % change year-on-year +10.19% -22.86% -18.83%
75th Percentile £50.75 £40.92 £57.50
90th Percentile £66.25 £67.35 £88.30
Central London median hourly rate £31.00 £27.81 £35.00
% change year-on-year +11.47% -20.54% -18.13%

High Availability
Job Vacancy Trend in the City of London

Job postings citing High Availability as a proportion of all IT jobs advertised in the City of London.
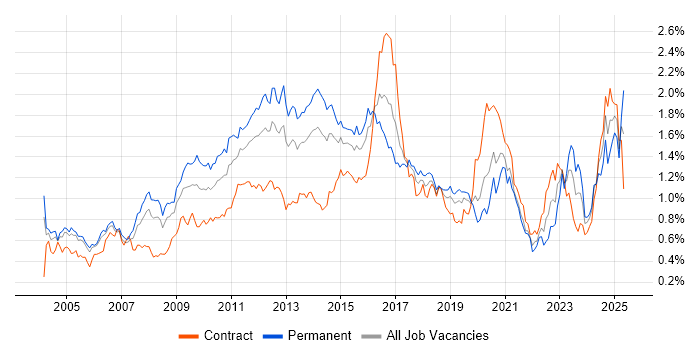
Job vacancy trend for High Availability in the City of London

High Availability
Contractor Daily Rate Trend in the City of London

3-month moving average daily rate quoted in jobs citing High Availability in the City of London.

Daily rate trend for High Availability in the City of London

High Availability
Daily Rate Histogram in the City of London

Daily rate distribution for jobs citing High Availability in the City of London over the 6 months to 3 July 2025.

Daily rate histogram for High Availability in the City of London

High Availability
Contractor Hourly Rate Trend in the City of London

3-month moving average hourly rates quoted in jobs citing High Availability in the City of London.

Hourly rate trend for High Availability in the City of London

High Availability
Co-occurring Skills and Capabilities in the City of London by Category

The follow tables expand on the table above by listing co-occurrences grouped by category. The same employment type, locality and period is covered with up to 20 co-occurrences shown in each of the following categories:

Application Platforms
1 2 (5.56%) SharePoint
2 1 (2.78%) Apache
2 1 (2.78%) Apache Spark
2 1 (2.78%) CICS
2 1 (2.78%) Confluence
2 1 (2.78%) Microsoft Exchange
Cloud Services
1 12 (33.33%) AWS
2 10 (27.78%) Azure
3 5 (13.89%) AWS CloudFormation
3 5 (13.89%) Microsoft 365
4 4 (11.11%) Entra ID
4 4 (11.11%) GitHub
5 3 (8.33%) Azure AKS
5 3 (8.33%) Cloud Computing
5 3 (8.33%) GCP
5 3 (8.33%) IaaS
5 3 (8.33%) PaaS
5 3 (8.33%) SaaS
5 3 (8.33%) Serverless
6 2 (5.56%) Azure Event Grid
6 2 (5.56%) Azure Logic Apps
6 2 (5.56%) Azure Monitor
6 2 (5.56%) Azure Sentinel
6 2 (5.56%) GitHub Actions
6 2 (5.56%) Power Automate
6 2 (5.56%) Power Platform
Communications & Networking
1 3 (8.33%) DNS
1 3 (8.33%) Firewall
2 2 (5.56%) VPN
3 1 (2.78%) BGP
3 1 (2.78%) Cisco Nexus
3 1 (2.78%) H.323
3 1 (2.78%) HTTP
3 1 (2.78%) IGMP
3 1 (2.78%) Kerberos
3 1 (2.78%) LAN
3 1 (2.78%) MGCP
3 1 (2.78%) Multicast
3 1 (2.78%) Network Security
3 1 (2.78%) OSPF
3 1 (2.78%) TCP/IP
3 1 (2.78%) Unified Communications
3 1 (2.78%) VXLAN
3 1 (2.78%) WAN
3 1 (2.78%) WebEx
3 1 (2.78%) Wi-Fi
Database & Business Intelligence
1 7 (19.44%) PostgreSQL
2 5 (13.89%) MySQL
2 5 (13.89%) Oracle Database
2 5 (13.89%) SQL Server
3 4 (11.11%) Relational Database
4 3 (8.33%) Azure SQL Database
5 2 (5.56%) Amazon RDS
5 2 (5.56%) CockroachDB
5 2 (5.56%) Data Warehouse
5 2 (5.56%) Oracle Exadata
5 2 (5.56%) Oracle Reports
6 1 (2.78%) Amazon Athena
6 1 (2.78%) Amazon Redshift
6 1 (2.78%) Data Lake
6 1 (2.78%) DynamoDB
6 1 (2.78%) MongoDB
6 1 (2.78%) NoSQL
6 1 (2.78%) Power BI
Development Applications
1 3 (8.33%) Git
1 3 (8.33%) Jenkins
1 3 (8.33%) JIRA
2 2 (5.56%) Atlassian Bamboo
2 2 (5.56%) GitLab
3 1 (2.78%) Sonatype Nexus
3 1 (2.78%) Subversion
3 1 (2.78%) TeamCity
General
1 14 (38.89%) Finance
2 10 (27.78%) Social Skills
3 7 (19.44%) Analytical Skills
4 4 (11.11%) Banking
5 2 (5.56%) Public Sector
6 1 (2.78%) Documentation Skills
6 1 (2.78%) Front Office
6 1 (2.78%) Investment Banking
6 1 (2.78%) Manufacturing
6 1 (2.78%) Multimedia
Job Titles
1 7 (19.44%) Senior
2 5 (13.89%) Administrator
2 5 (13.89%) DBA
2 5 (13.89%) Lead
3 3 (8.33%) Architect
3 3 (8.33%) Azure Engineer
3 3 (8.33%) Database Engineer
3 3 (8.33%) DevOps Engineer
3 3 (8.33%) Site Engineer
3 3 (8.33%) Site Reliability Engineer
4 2 (5.56%) AWS DevOps
4 2 (5.56%) AWS Specialist
4 2 (5.56%) Azure Architect
4 2 (5.56%) Cloud Architect
4 2 (5.56%) DevOps Specialist
4 2 (5.56%) Microsoft 365 Architect
4 2 (5.56%) PostgreSQL DBA
4 2 (5.56%) PostgreSQL Specialist
4 2 (5.56%) Senior Architect
4 2 (5.56%) Senior Cloud Architect
Libraries, Frameworks & Software Standards
1 4 (11.11%) REST
2 3 (8.33%) .NET
2 3 (8.33%) ARM Templates
2 3 (8.33%) Kafka
3 2 (5.56%) Azure Blueprints
4 1 (2.78%) .NET Core
4 1 (2.78%) ADO
4 1 (2.78%) Elastic Stack
4 1 (2.78%) JSON
4 1 (2.78%) LDAP
4 1 (2.78%) OAuth
4 1 (2.78%) OAuth2
4 1 (2.78%) OpenAPI
4 1 (2.78%) PySpark
4 1 (2.78%) RESTful
4 1 (2.78%) Swagger
Miscellaneous
1 5 (13.89%) Clustering
1 5 (13.89%) Distributed Systems
1 5 (13.89%) Replication
2 3 (8.33%) Cloud Native
2 3 (8.33%) Data Centre
2 3 (8.33%) Reinsurance
3 2 (5.56%) Data Structures
3 2 (5.56%) Distributed Applications
3 2 (5.56%) Distributed Architecture
3 2 (5.56%) Hybrid Cloud
3 2 (5.56%) Linux Command Line
3 2 (5.56%) Mainframe
3 2 (5.56%) Private Cloud
3 2 (5.56%) Product Ownership
3 2 (5.56%) Public Cloud
3 2 (5.56%) Virtual Team
4 1 (2.78%) CMDB
4 1 (2.78%) Digital Signage
4 1 (2.78%) Foreign Exchange (FX)
4 1 (2.78%) Greenfield Project
Operating Systems
1 9 (25.00%) Linux
2 5 (13.89%) Unix
3 3 (8.33%) Red Hat Enterprise Linux
4 2 (5.56%) Windows
4 2 (5.56%) Windows Server
4 2 (5.56%) zOS
5 1 (2.78%) Solaris
Processes & Methodologies
1 16 (44.44%) DevOps
2 14 (38.89%) CI/CD
3 10 (27.78%) Infrastructure as Code
3 10 (27.78%) Problem-Solving
4 8 (22.22%) Agile
4 8 (22.22%) Containerisation
4 8 (22.22%) Performance Tuning
5 7 (19.44%) Configuration Management
6 6 (16.67%) Cloud Security
6 6 (16.67%) Disaster Recovery
6 6 (16.67%) Microservices
7 5 (13.89%) Continuous Integration
7 5 (13.89%) Software Engineering
8 4 (11.11%) Database Tuning
8 4 (11.11%) Observability
8 4 (11.11%) Runbook
8 4 (11.11%) Site Reliability Engineering
8 4 (11.11%) Task Automation
8 4 (11.11%) Technical Leadership
8 4 (11.11%) Zero Trust
Programming Languages
1 17 (47.22%) Python
2 12 (33.33%) SQL
3 6 (16.67%) Bash
3 6 (16.67%) Java
4 5 (13.89%) PowerShell
4 5 (13.89%) Shell Script
5 4 (11.11%) Go
6 3 (8.33%) Bicep
6 3 (8.33%) C#
7 2 (5.56%) AWK
7 2 (5.56%) sed
8 1 (2.78%) Assembly Language
8 1 (2.78%) JavaScript
8 1 (2.78%) Perl
8 1 (2.78%) REXX
8 1 (2.78%) Scala
8 1 (2.78%) TypeScript
Qualifications
1 4 (11.11%) Security Cleared
2 3 (8.33%) AWS Certification
2 3 (8.33%) AWS Certified Solutions Architect
2 3 (8.33%) SC Cleared
3 2 (5.56%) AWS Certified Developer
3 2 (5.56%) AWS Certified DevOps Engineer
3 2 (5.56%) AWS Certified SysOps Administrator
3 2 (5.56%) Azure Certification
4 1 (2.78%) CCIE
4 1 (2.78%) CCNP
4 1 (2.78%) Cisco Certification
4 1 (2.78%) Microsoft Certification
Quality Assurance & Compliance
1 2 (5.56%) Actionable Recommendations
1 2 (5.56%) Data Quality
1 2 (5.56%) GDPR
1 2 (5.56%) SOC 2
2 1 (2.78%) ISO/IEC 27001
2 1 (2.78%) NIST
System Software
1 4 (11.11%) Active Directory
1 4 (11.11%) Docker
2 3 (8.33%) NFS
3 2 (5.56%) Firmware
3 2 (5.56%) GPFS
3 2 (5.56%) Virtual Machines
3 2 (5.56%) VMware ESXi
3 2 (5.56%) VMware Infrastructure
4 1 (2.78%) RACF
4 1 (2.78%) Veritas File System
4 1 (2.78%) Veritas Volume Manager
Systems Management
1 13 (36.11%) Terraform
2 9 (25.00%) Ansible
3 8 (22.22%) Kubernetes
4 5 (13.89%) Oracle Enterprise Manager
5 4 (11.11%) Grafana
5 4 (11.11%) Prometheus
6 2 (5.56%) Progress Chef
6 2 (5.56%) Puppet
7 1 (2.78%) Cisco CUCM
7 1 (2.78%) Cisco UCCE
7 1 (2.78%) Control-M
7 1 (2.78%) Microsoft Intune
7 1 (2.78%) Netcool
7 1 (2.78%) OMEGAMON
7 1 (2.78%) Oracle RMAN
7 1 (2.78%) QRadar
7 1 (2.78%) Red Hat Satellite
7 1 (2.78%) Tivoli
7 1 (2.78%) vCenter Server
7 1 (2.78%) vMotion
Vendors
1 8 (22.22%) Microsoft
1 8 (22.22%) Oracle
2 5 (13.89%) Red Hat
3 3 (8.33%) Cisco
3 3 (8.33%) Splunk
4 2 (5.56%) VMware
5 1 (2.78%) Arista
5 1 (2.78%) BMC
5 1 (2.78%) Confluent
5 1 (2.78%) CyberArk
5 1 (2.78%) F5
5 1 (2.78%) Fortinet
5 1 (2.78%) IBM
5 1 (2.78%) LogicMonitor
5 1 (2.78%) MobileIron
5 1 (2.78%) Palo Alto
5 1 (2.78%) Qualys
5 1 (2.78%) SaltStack
5 1 (2.78%) ServiceNow
5 1 (2.78%) SolarWinds