Decision-Making Jobs

Decision-Making
UK

The table below provides summary statistics for permanent job vacancies requiring Decision-Making skills. It includes a benchmarking guide to the annual salaries offered in vacancies that cited Decision-Making over the 6 months leading up to 26 July 2024, comparing them to the same period in the previous two years.

6 months to
26 Jul 2024
Same period 2023 Same period 2022
Rank 46 79 67
Rank change year-on-year +33 -12 +47
Permanent jobs citing Decision-Making 4,124 3,184 8,971
As % of all permanent jobs advertised in the UK 4.56% 3.95% 5.12%
As % of the Processes & Methodologies category 5.58% 4.14% 5.31%
Number of salaries quoted 1,951 1,821 3,275
10th Percentile £34,404 £35,000 £36,250
25th Percentile £41,411 £42,500 £44,889
Median annual salary (50th Percentile) £55,000 £59,556 £60,000
Median % change year-on-year -7.65% -0.74% +9.09%
75th Percentile £71,250 £77,500 £80,000
90th Percentile £90,000 £95,000 £93,900
UK excluding London median annual salary £50,000 £52,500 £51,500
% change year-on-year -4.76% +1.94% -

All Process and Methodology Skills
UK

Decision-Making falls under the Processes and Methodologies category. For comparison with the information above, the following table provides summary statistics for all permanent job vacancies requiring process or methodology skills.

Permanent vacancies with a requirement for process or methodology skills 73,969 76,929 168,958
As % of all permanent jobs advertised in the UK 81.84% 95.34% 96.40%
Number of salaries quoted 48,628 50,249 85,709
10th Percentile £30,000 £33,750 £33,750
25th Percentile £40,000 £45,000 £44,250
Median annual salary (50th Percentile) £55,000 £60,000 £60,000
Median % change year-on-year -8.33% - +9.09%
75th Percentile £73,750 £80,000 £80,000
90th Percentile £93,750 £100,000 £96,250
UK excluding London median annual salary £50,000 £55,000 £52,500
% change year-on-year -9.09% +4.76% +6.06%

Decision-Making
Job Vacancy Trend

Job postings citing Decision-Making as a proportion of all IT jobs advertised.
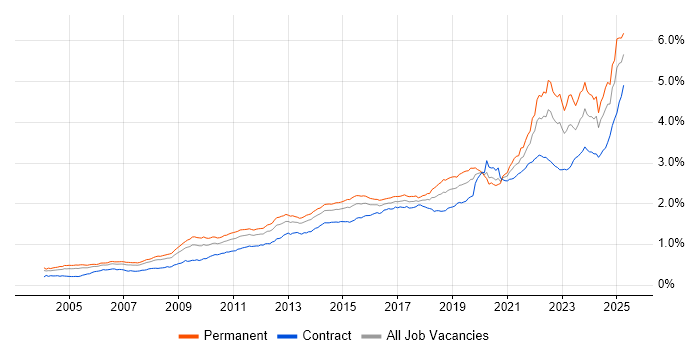
Job vacancy trend for Decision-Making in the UK

Decision-Making
Salary Trend

3-month moving average salary quoted in jobs citing Decision-Making.

Salary trend for Decision-Making in the UK

Decision-Making
Salary Histogram

Salary distribution for jobs citing Decision-Making over the 6 months to 26 July 2024.

Salary histogram for Decision-Making in the UK

Decision-Making
Top 18 Job Locations

The table below looks at the demand and provides a guide to the median salaries quoted in IT jobs citing Decision-Making within the UK over the 6 months to 26 July 2024. The 'Rank Change' column provides an indication of the change in demand within each location based on the same 6 month period last year.

Location Rank Change
on Same Period
Last Year
Matching
Permanent
IT Job Ads
Median Salary
Past 6 Months
Median Salary
% Change
on Same Period
Last Year
Live
Jobs
England +35 3,444 £55,000 -7.65% 718
UK excluding London +27 2,715 £50,000 -4.76% 582
Work from Home +28 1,544 £55,000 -8.52% 321
London +50 1,216 £65,000 -7.14% 217
South East +45 754 £50,000 -4.85% 143
North of England +26 565 £55,000 +0.22% 159
Scotland +65 484 £50,000 -14.97% 16
Midlands -3 399 £55,000 +27.91% 110
North West +34 348 £52,500 -4.55% 92
West Midlands -3 279 £55,000 +32.02% 68
East of England +27 238 £50,000 -9.09% 50
South West -37 221 £52,500 +2.94% 83
Yorkshire +16 165 £55,000 +0.22% 42
East Midlands +6 116 £50,000 -4.76% 42
North East +4 52 £50,662 -3.50% 28
Wales +12 41 £40,000 -27.12% 13
Northern Ireland +27 13 £30,000 -33.33% 32
Channel Islands - 2 £55,000 -

Decision-Making
Co-occurring Skills and Capabilities by Category

The follow tables expand on the table above by listing co-occurrences grouped by category. The same employment type, locality and period is covered with up to 20 co-occurrences shown in each of the following categories:

Application Platforms
1 80 (1.94%) Apache Spark
2 64 (1.55%) SharePoint
3 63 (1.53%) FileNet
4 62 (1.50%) SAS
5 40 (0.97%) Microsoft Exchange
6 38 (0.92%) Apache
6 38 (0.92%) Confluence
7 19 (0.46%) Apache Airflow
8 17 (0.41%) Cloud Foundry
9 15 (0.36%) CMS
10 13 (0.32%) Oracle Workflow
11 11 (0.27%) CICS
12 9 (0.22%) OpenStack
13 8 (0.19%) Jupyter
14 7 (0.17%) ArcGIS
15 6 (0.15%) nginx
16 5 (0.12%) WordPress
17 4 (0.097%) Drupal
17 4 (0.097%) Headless CMS
18 3 (0.073%) NServiceBus
Applications
1 912 (22.11%) Microsoft Excel
2 273 (6.62%) Microsoft Office
3 182 (4.41%) Microsoft PowerPoint
4 33 (0.80%) Microsoft Project
5 31 (0.75%) MS Visio
6 16 (0.39%) Spreadsheet
7 14 (0.34%) SPSS
8 8 (0.19%) Siemens NX
9 7 (0.17%) Sketch
10 6 (0.15%) InVision
11 4 (0.097%) Photoshop
12 3 (0.073%) AutoCAD
12 3 (0.073%) Chatbot
12 3 (0.073%) Simulink
13 2 (0.048%) Adobe After Effects
13 2 (0.048%) Adobe Illustrator
13 2 (0.048%) Adobe Premiere
13 2 (0.048%) EPLAN
13 2 (0.048%) Stateflow
14 1 (0.024%) Trello
Business Applications
1 33 (0.80%) Dynamics CRM
2 30 (0.73%) NEC Housing
3 21 (0.51%) Primavera
4 15 (0.36%) iTrent
5 13 (0.32%) Infor SunSystems
5 13 (0.32%) SAP S/4HANA
6 11 (0.27%) Salesforce CRM
7 8 (0.19%) Teamcenter
8 6 (0.15%) Dynamics AX
8 6 (0.15%) Oracle Applications
8 6 (0.15%) Oracle Financials
9 5 (0.12%) NetSuite
10 4 (0.097%) Magento
10 4 (0.097%) SAP APO
10 4 (0.097%) SAP ERP
10 4 (0.097%) SAP MM
10 4 (0.097%) SAP PP
10 4 (0.097%) SAP SD
10 4 (0.097%) SAP WM
10 4 (0.097%) Shopify
Cloud Services
1 425 (10.31%) Azure
2 410 (9.94%) AWS
3 383 (9.29%) Power Platform
4 151 (3.66%) Microsoft 365
5 114 (2.76%) GCP
6 99 (2.40%) Amazon S3
7 84 (2.04%) SaaS
8 81 (1.96%) GitHub
9 58 (1.41%) Dynamics 365
10 45 (1.09%) Serverless
11 41 (0.99%) Snowflake
12 38 (0.92%) IaaS
13 35 (0.85%) AWS Lambda
14 34 (0.82%) Azure DevOps
14 34 (0.82%) PowerApps
15 33 (0.80%) Azure Data Factory
16 32 (0.78%) Power Automate
17 28 (0.68%) Cloud Computing
18 24 (0.58%) Amazon EC2
18 24 (0.58%) PaaS
Communications & Networking
1 460 (11.15%) Broadband
2 52 (1.26%) Firewall
3 38 (0.92%) WAN
4 29 (0.70%) VoIP
5 27 (0.65%) DNS
6 22 (0.53%) 3GPP
6 22 (0.53%) LAN
7 20 (0.48%) Network Security
7 20 (0.48%) Unified Communications
8 17 (0.41%) Kerberos
9 14 (0.34%) Intranet
9 14 (0.34%) VPN
10 13 (0.32%) DHCP
10 13 (0.32%) TCP/IP
11 12 (0.29%) VLAN
12 9 (0.22%) OSPF
12 9 (0.22%) Remote Desktop
13 8 (0.19%) Internet
13 8 (0.19%) Wi-Fi
14 7 (0.17%) Wireless
Database & Business Intelligence
1 355 (8.61%) Power BI
2 246 (5.97%) Tableau
3 176 (4.27%) Data Warehouse
4 137 (3.32%) SQL Server
5 129 (3.13%) NoSQL
6 89 (2.16%) Big Data
7 79 (1.92%) Elasticsearch
8 65 (1.58%) Apache Cassandra
9 62 (1.50%) Data Lake
9 62 (1.50%) Relational Database
10 55 (1.33%) Hadoop
11 43 (1.04%) SQL Server Integration Services
12 41 (0.99%) BigQuery
13 37 (0.90%) SQL Server Reporting Services
14 36 (0.87%) Data Mining
14 36 (0.87%) MySQL
15 32 (0.78%) Amazon Redshift
16 29 (0.70%) Power Query
16 29 (0.70%) QlikView
17 24 (0.58%) Qlik Sense
Development Applications
1 126 (3.06%) Git
2 99 (2.40%) JIRA
3 87 (2.11%) JUnit
4 77 (1.87%) Jenkins
5 62 (1.50%) Jasmine
6 45 (1.09%) Mockito
7 20 (0.48%) JMeter
7 20 (0.48%) Selenium
7 20 (0.48%) SQL Server Management Studio (SSMS)
8 18 (0.44%) WebDriver
9 17 (0.41%) Cypress.io
9 17 (0.41%) Karma Test Runner
9 17 (0.41%) Protractor
10 15 (0.36%) LabVIEW
11 14 (0.34%) GitLab
11 14 (0.34%) Subversion
12 13 (0.32%) Maven
13 11 (0.27%) Artifactory
13 11 (0.27%) ChangeMan
14 8 (0.19%) Oracle Forms
General
1 1,990 (48.25%) Social Skills
2 1,751 (42.46%) Finance
3 1,413 (34.26%) Analytical Skills
4 650 (15.76%) Inclusion and Diversity
5 553 (13.41%) Influencing Skills
6 518 (12.56%) Marketing
7 475 (11.52%) Law
8 429 (10.40%) Legal
9 404 (9.80%) Retail
10 187 (4.53%) Presentation Skills
11 177 (4.29%) Public Sector
12 169 (4.10%) Banking
13 96 (2.33%) Organisational Skills
13 96 (2.33%) Telecoms
14 92 (2.23%) Manufacturing
15 64 (1.55%) Investment Banking
15 64 (1.55%) Local Government
16 58 (1.41%) Games
17 55 (1.33%) Police
18 47 (1.14%) Front Office
Job Titles
1 1,187 (28.78%) Analyst
2 875 (21.22%) Senior
3 338 (8.20%) Lead
4 335 (8.12%) Senior Analyst
5 326 (7.90%) Software Engineer
6 228 (5.53%) Development Manager
7 211 (5.12%) Business Manager
8 198 (4.80%) Project Manager
9 193 (4.68%) Architect
10 190 (4.61%) Business Development Manager
11 179 (4.34%) Financial Analyst
12 178 (4.32%) Data Analyst
13 177 (4.29%) Business Analyst
14 176 (4.27%) Senior Manager
15 139 (3.37%) Java Engineer
16 136 (3.30%) Java Software Engineer
17 131 (3.18%) Commercial Analyst
17 131 (3.18%) Developer
18 99 (2.40%) Data Engineer
19 86 (2.09%) Senior Software Engineer
Libraries, Frameworks & Software Standards
1 177 (4.29%) React
2 128 (3.10%) Spring
3 110 (2.67%) AngularJS
4 108 (2.62%) Kafka
5 101 (2.45%) .NET
6 97 (2.35%) J2EE
7 87 (2.11%) GraphQL
8 85 (2.06%) HTML
9 81 (1.96%) Hibernate
10 71 (1.72%) PySpark
11 70 (1.70%) CSS
12 63 (1.53%) Spring Integration
12 63 (1.53%) TensorFlow
13 59 (1.43%) Pandas
14 58 (1.41%) Node.js
15 51 (1.24%) scikit-learn
16 41 (0.99%) JSON
17 39 (0.95%) jQuery
18 35 (0.85%) JMS
18 35 (0.85%) Twitter Bootstrap
Miscellaneous
1 298 (7.23%) Management Information System
2 196 (4.75%) Cloud Native
3 172 (4.17%) Self-Motivation
4 142 (3.44%) Product Ownership
5 128 (3.10%) Algorithms
6 113 (2.74%) Onboarding
7 71 (1.72%) Public Cloud
8 68 (1.65%) Credit Risk
8 68 (1.65%) Driving Licence
9 66 (1.60%) Data Structures
10 50 (1.21%) Data Centre
10 50 (1.21%) Social Media
11 48 (1.16%) IoT
11 48 (1.16%) Mobile App
12 42 (1.02%) NHS
13 41 (0.99%) Analytical Mindset
14 39 (0.95%) PMI
15 30 (0.73%) Enterprise Software
16 28 (0.68%) Cyberattack
16 28 (0.68%) Derivative
Operating Systems
1 164 (3.98%) Windows
2 77 (1.87%) Linux
3 43 (1.04%) Windows Server
4 34 (0.82%) Windows 10
5 19 (0.46%) Android
5 19 (0.46%) Unix
6 18 (0.44%) Windows Server 2012
7 16 (0.39%) Apple iOS
7 16 (0.39%) Windows Server 2019
8 14 (0.34%) Windows Server 2016
9 13 (0.32%) Windows Vista
10 11 (0.27%) Windows 7
11 10 (0.24%) Mac OS
12 8 (0.19%) VME
13 3 (0.073%) Amazon Linux
13 3 (0.073%) Windows Server 2008
14 2 (0.048%) Ubuntu
14 2 (0.048%) VMS
15 1 (0.024%) CentOS
15 1 (0.024%) Embedded Linux
Processes & Methodologies
1 1,484 (35.98%) Agile
2 1,213 (29.41%) Problem-Solving
3 840 (20.37%) Mentoring
4 819 (19.86%) Actionable Insight
5 615 (14.91%) Project Management
6 604 (14.65%) Business Case
7 551 (13.36%) Analytics
8 534 (12.95%) Budgeting and Forecasting
9 506 (12.27%) Coaching
10 503 (12.20%) Budgeting
11 490 (11.88%) Software Engineering
12 471 (11.42%) Business Intelligence
13 468 (11.35%) Machine Learning
14 464 (11.25%) Artificial Intelligence
15 416 (10.09%) Risk Management
16 414 (10.04%) Data-Driven Decision Making
17 385 (9.34%) Continuous Improvement
18 376 (9.12%) Visualisation
19 355 (8.61%) SDLC
20 347 (8.41%) Computer Science
Programming Languages
1 780 (18.91%) SQL
2 545 (13.22%) Python
3 370 (8.97%) Java
4 141 (3.42%) JavaScript
5 116 (2.81%) C#
6 94 (2.28%) R
7 72 (1.75%) TypeScript
8 62 (1.50%) Scala
9 49 (1.19%) PowerShell
10 47 (1.14%) C++
11 41 (0.99%) Bash
12 38 (0.92%) C
13 35 (0.85%) T-SQL
14 34 (0.82%) Data Analysis Expressions
15 23 (0.56%) PL/1
16 19 (0.46%) COBOL
17 18 (0.44%) VBA
18 17 (0.41%) Go
19 16 (0.39%) Julia
20 15 (0.36%) Haskell
Qualifications
1 852 (20.66%) Degree
2 482 (11.69%) ACCA
3 465 (11.28%) CIMA
4 276 (6.69%) Security Cleared
5 205 (4.97%) Master's Degree
6 141 (3.42%) Computer Science Degree
7 137 (3.32%) DBS Check
8 129 (3.13%) SC Cleared
9 63 (1.53%) PMI Certification
10 59 (1.43%) PRINCE2 Practitioner
11 58 (1.41%) CISSP
12 51 (1.24%) PhD
13 37 (0.90%) APMP
14 36 (0.87%) CISM
15 35 (0.85%) HNC
16 32 (0.78%) Numerate Degree
17 31 (0.75%) Microsoft Certification
18 28 (0.68%) MBA
19 26 (0.63%) DV Cleared
19 26 (0.63%) PMP
Quality Assurance & Compliance
1 201 (4.87%) Data Quality
2 153 (3.71%) QA
3 112 (2.72%) Accessibility
4 96 (2.33%) SLA
5 94 (2.28%) PMO
6 85 (2.06%) GDPR
7 77 (1.87%) ISO/IEC 27001
8 61 (1.48%) NIST
9 38 (0.92%) NCSC
10 31 (0.75%) GAAP
11 30 (0.73%) IFRS
12 29 (0.70%) Cyber Essentials
13 24 (0.58%) GRC
14 23 (0.56%) Actionable Recommendations
15 20 (0.48%) Sarbanes-Oxley
16 16 (0.39%) PCI DSS
17 14 (0.34%) Solvency II
18 13 (0.32%) California Consumer Privacy Act
18 13 (0.32%) ISO 9001
18 13 (0.32%) NIST 800
System Software
1 82 (1.99%) Active Directory
2 53 (1.29%) Docker
3 45 (1.09%) VMware Infrastructure
4 19 (0.46%) Hyper-V
4 19 (0.46%) Virtual Machines
5 13 (0.32%) Firmware
6 11 (0.27%) Time Sharing Option
7 6 (0.15%) Virtual Desktop
8 5 (0.12%) VMware ESXi
9 4 (0.097%) NFS
10 2 (0.048%) KVM
11 1 (0.024%) Embedded Firmware
11 1 (0.024%) HDFS
11 1 (0.024%) Virtual Servers
Systems Management
1 167 (4.05%) Kubernetes
2 68 (1.65%) Terraform
3 23 (0.56%) Microsoft Intune
4 22 (0.53%) Ansible
5 17 (0.41%) SCCM
6 11 (0.27%) Grafana
7 9 (0.22%) Prometheus
8 8 (0.19%) Single Sign-On
9 7 (0.17%) Failover Clustering
9 7 (0.17%) Graphite
10 5 (0.12%) Puppet
11 4 (0.097%) Autotask
11 4 (0.097%) Jamf Pro
12 3 (0.073%) WSUS
13 2 (0.048%) Active Directory Federation Services
13 2 (0.048%) Argo
13 2 (0.048%) Functional Safety
13 2 (0.048%) Matomo
13 2 (0.048%) Progress Chef
14 1 (0.024%) Dell DRAC
Vendors
1 1,089 (26.41%) Microsoft
2 177 (4.29%) Oracle
3 128 (3.10%) Google
4 107 (2.59%) Databricks
5 80 (1.94%) SAP
6 63 (1.53%) VMware
7 58 (1.41%) Salesforce
8 41 (0.99%) ServiceNow
9 39 (0.95%) Alteryx
10 31 (0.75%) NEC
11 28 (0.68%) IBM
12 25 (0.61%) Adobe
13 22 (0.53%) CA
14 20 (0.48%) Splunk
15 19 (0.46%) Capita
16 17 (0.41%) BT
17 14 (0.34%) Cisco
17 14 (0.34%) Infor
17 14 (0.34%) Workday
17 14 (0.34%) YouTube