Senior
UK

The median Senior salary in the UK is £62,000 per year, according to job vacancies posted during the 6 months leading to 30 April 2025.

The table below provides salary benchmarking and summary statistics, comparing them to the same period in the previous two years.

6 months to
30 Apr 2025
Same period 2024 Same period 2023
Rank 4 6 10
Rank change year-on-year +2 +4 -3
Permanent jobs requiring a Senior 9,281 14,860 16,151
As % of all permanent jobs advertised in the UK 17.79% 15.11% 15.53%
As % of the Job Titles category 19.76% 15.97% 16.97%
Number of salaries quoted 4,996 10,192 9,802
10th Percentile £41,000 £42,500 £47,000
25th Percentile £50,000 £50,000 £55,000
Median annual salary (50th Percentile) £62,000 £62,500 £70,000
Median % change year-on-year -0.80% -10.71% -
75th Percentile £80,000 £77,500 £87,500
90th Percentile £97,528 £95,000 £102,500
UK excluding London median annual salary £55,000 £60,000 £60,899
% change year-on-year -8.33% -1.48% +1.50%

All Permanent IT Job Vacancies
UK

For comparison with the information above, the following table provides summary statistics for all permanent IT job vacancies. Most job vacancies include a discernible job title that can be normalized. As such, the figures in the second row provide an indication of the number of permanent jobs in our overall sample.

Permanent vacancies in the UK with a recognized job title 46,971 93,051 95,196
% of permanent jobs with a recognized job title 90.06% 94.62% 91.53%
Number of salaries quoted 27,308 66,827 59,871
10th Percentile £30,000 £28,500 £32,500
25th Percentile £42,500 £38,500 £45,000
Median annual salary (50th Percentile) £57,500 £52,750 £60,000
Median % change year-on-year +9.00% -12.08% -
75th Percentile £75,000 £71,250 £81,250
90th Percentile £97,500 £90,000 £100,000
UK excluding London median annual salary £52,344 £50,000 £52,500
% change year-on-year +4.69% -4.76% +5.00%

Senior
Job Vacancy Trend

Job postings that featured Senior in the job title as a proportion of all IT jobs advertised.
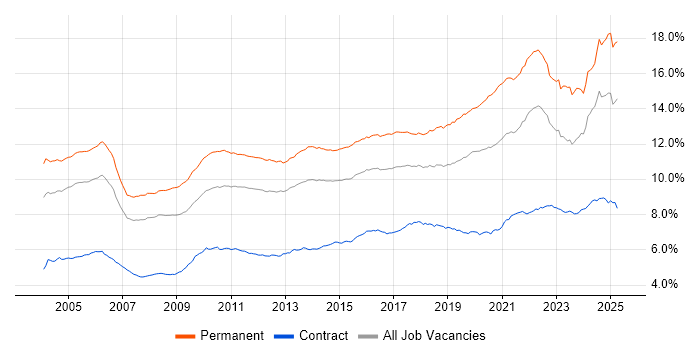
Job vacancy trend for Senior in the UK

Senior
Salary Trend

3-month moving average salary quoted in jobs citing Senior.

Salary trend for Senior in the UK

Senior
Salary Histogram

Salary distribution for jobs citing Senior over the 6 months to 30 April 2025.

Salary histogram for Senior in the UK

Senior
Top 19 Job Locations

The table below looks at the demand and provides a guide to the median salaries quoted in IT jobs citing Senior within the UK over the 6 months to 30 April 2025. The 'Rank Change' column provides an indication of the change in demand within each location based on the same 6 month period last year.

Location Rank Change
on Same Period
Last Year
Matching
Permanent
IT Job Ads
Median Salary
Past 6 Months
Median Salary
% Change
on Same Period
Last Year
Live
Jobs
England +3 7,991 £62,000 -1.25% 5,342
UK excluding London +5 6,805 £55,000 -8.33% 2,723
Work from Home -1 2,343 £67,500 +5.34% 3,068
North of England +2 2,245 £50,055 -16.58% 826
London -5 2,125 £80,000 +3.23% 2,922
North West +3 1,814 £50,055 -16.58% 530
South East +7 1,497 £62,000 +3.33% 577
Midlands 0 890 £60,000 +4.35% 401
South West +3 775 £55,000 -3.25% 310
Scotland +19 731 £55,000 -8.33% 245
West Midlands -3 509 £65,000 +11.62% 256
East of England +6 391 £55,000 -8.33% 276
East Midlands +4 380 £55,000 +2.61% 140
Yorkshire -4 363 £61,206 +5.59% 223
Wales -2 237 £61,000 +22.00% 71
North East -14 68 £61,000 +5.24% 78
Northern Ireland +2 56 £85,000 +54.55% 76
Isle of Man +12 3 - - 1
Channel Islands +1 1 £97,500 +14.71%

Senior Skill Set
Top 30 Co-occurring Skills and Capabilities

For the 6 months to 30 April 2025, Senior job roles required the following skills and capabilities in order of popularity. The figures indicate the absolute number co-occurrences and as a proportion of all permanent job ads featuring Senior in the job title.

1 3,728 (40.17%) Degree
2 2,930 (31.57%) BPSS Clearance
3 1,952 (21.03%) Social Skills
4 1,810 (19.50%) Finance
5 1,784 (19.22%) Agile
6 1,671 (18.00%) Systems Engineering
7 1,298 (13.99%) Problem-Solving
8 1,268 (13.66%) Azure
9 1,185 (12.77%) Mentoring
10 1,168 (12.58%) Python
11 1,088 (11.72%) Software Engineering
12 1,005 (10.83%) Mathematics
13 992 (10.69%) AWS
14 988 (10.65%) Microsoft
15 977 (10.53%) Analytical Skills
16 888 (9.57%) SQL
17 858 (9.24%) Project Management
18 821 (8.85%) Coaching
19 756 (8.15%) CI/CD
20 744 (8.02%) DevOps
21 714 (7.69%) JavaScript
22 669 (7.21%) Analytics
23 666 (7.18%) C#
24 602 (6.49%) Java
25 583 (6.28%) Physics
26 580 (6.25%) Computer Science
27 545 (5.87%) Risk Management
28 543 (5.85%) .NET
29 529 (5.70%) IEC 61508
30 524 (5.65%) HND

Senior Skill Set
Co-occurring Skills and Capabilities by Category

The follow tables expand on the table above by listing co-occurrences grouped by category. The same employment type, locality and period is covered with up to 20 co-occurrences shown in each of the following categories:

Application Platforms
1 205 (2.21%) SharePoint
2 108 (1.16%) Apache
3 99 (1.07%) Microsoft Exchange
4 98 (1.06%) Apache Airflow
5 96 (1.03%) Confluence
6 92 (0.99%) Apache Spark
7 51 (0.55%) CMS
8 27 (0.29%) SAS
9 24 (0.26%) Jupyter
10 19 (0.20%) IIS
11 18 (0.19%) nginx
12 13 (0.14%) WordPress
13 10 (0.11%) Drupal
14 9 (0.097%) Luigi
14 9 (0.097%) OpenStack
14 9 (0.097%) Umbraco
15 8 (0.086%) Apache Solr
15 8 (0.086%) Headless CMS
16 5 (0.054%) Liferay
17 4 (0.043%) Mule
Applications
1 278 (3.00%) Microsoft Office
2 258 (2.78%) Mathcad
3 187 (2.01%) Simulink
4 164 (1.77%) Microsoft Excel
5 158 (1.70%) Abaqus
6 73 (0.79%) Microsoft PowerPoint
7 69 (0.74%) SOLIDWORKS
8 42 (0.45%) Microsoft Project
9 40 (0.43%) Windchill
10 39 (0.42%) MS Visio
11 18 (0.19%) AutoCAD
11 18 (0.19%) Maya
12 14 (0.15%) Adobe XD
13 12 (0.13%) Sketch
14 11 (0.12%) Chatbot
15 10 (0.11%) Revit
15 10 (0.11%) Spreadsheet
16 8 (0.086%) Photoshop
17 6 (0.065%) Trello
18 5 (0.054%) Stata
Business Applications
1 124 (1.34%) Teamcenter
2 80 (0.86%) Dynamics CRM
3 46 (0.50%) SAP S/4HANA
4 42 (0.45%) SAP BPC
5 40 (0.43%) Infor LN
6 31 (0.33%) NetSuite
7 24 (0.26%) Dynamics AX
8 23 (0.25%) SAP FI
9 16 (0.17%) OpenText VIM for SAP
10 14 (0.15%) Payment Gateway
10 14 (0.15%) SAP IBP
11 13 (0.14%) Aladdin
12 12 (0.13%) NEC Housing
13 11 (0.12%) Shopify
14 10 (0.11%) Magento
14 10 (0.11%) Oracle Payroll
15 9 (0.097%) Oracle EBS
15 9 (0.097%) Oracle ERP
16 7 (0.075%) SAP CO
16 7 (0.075%) SAP FI/CO
Cloud Services
1 1,268 (13.66%) Azure
2 992 (10.69%) AWS
3 438 (4.72%) GCP
4 298 (3.21%) Power Platform
5 293 (3.16%) Microsoft 365
6 289 (3.11%) SaaS
7 217 (2.34%) Serverless
8 179 (1.93%) Azure DevOps
9 166 (1.79%) GitHub
10 146 (1.57%) AWS Lambda
11 138 (1.49%) Snowflake
12 120 (1.29%) Dynamics 365
13 94 (1.01%) PaaS
14 93 (1.00%) Amazon S3
15 92 (0.99%) dbt
16 91 (0.98%) Entra ID
17 89 (0.96%) Azure Data Factory
18 87 (0.94%) Cloud Computing
19 86 (0.93%) Amazon EC2
20 68 (0.73%) AWS CloudFormation
Communications & Networking
1 222 (2.39%) Firewall
2 115 (1.24%) WAN
3 113 (1.22%) VPN
4 111 (1.20%) DNS
5 105 (1.13%) Network Security
6 96 (1.03%) TCP/IP
7 86 (0.93%) Wireless
8 71 (0.77%) LAN
9 67 (0.72%) SD-WAN
10 64 (0.69%) Wi-Fi
11 58 (0.62%) DHCP
12 53 (0.57%) VLAN
13 51 (0.55%) HTTP
14 50 (0.54%) VoIP
15 41 (0.44%) Internet
16 38 (0.41%) BGP
16 38 (0.41%) OSPF
17 35 (0.38%) Cisco Nexus
18 33 (0.36%) IPsec
19 26 (0.28%) MPLS
Database & Business Intelligence
1 298 (3.21%) SQL Server
2 206 (2.22%) Power BI
3 181 (1.95%) MySQL
4 163 (1.76%) NoSQL
5 153 (1.65%) PostgreSQL
6 146 (1.57%) Tableau
7 142 (1.53%) Data Lake
8 133 (1.43%) Data Warehouse
9 113 (1.22%) Big Data
10 104 (1.12%) Relational Database
11 75 (0.81%) MongoDB
12 73 (0.79%) DynamoDB
13 70 (0.75%) Amazon Athena
14 63 (0.68%) SQL Server Integration Services
15 61 (0.66%) SQL Server Reporting Services
16 60 (0.65%) Apache Iceberg
17 57 (0.61%) Apache Arrow
17 57 (0.61%) Apache Ignite
17 57 (0.61%) Dremio
18 55 (0.59%) Amazon RDS
Development Applications
1 427 (4.60%) Git
2 349 (3.76%) JIRA
3 192 (2.07%) Rational DOORS
4 148 (1.59%) Jenkins
5 118 (1.27%) LabVIEW
6 90 (0.97%) Visual Studio
7 60 (0.65%) Selenium
8 59 (0.64%) Bitbucket
9 53 (0.57%) Oracle Forms
10 52 (0.56%) GitLab
11 48 (0.52%) Maven
12 44 (0.47%) JUnit
13 39 (0.42%) Cypress.io
14 28 (0.30%) IntelliJ
15 27 (0.29%) webpack
16 25 (0.27%) Postman
17 22 (0.24%) SonarQube
18 20 (0.22%) Atlassian Bamboo
19 19 (0.20%) Subversion
20 18 (0.19%) Mockito
General
1 1,952 (21.03%) Social Skills
2 1,810 (19.50%) Finance
3 977 (10.53%) Analytical Skills
4 522 (5.62%) Manufacturing
5 509 (5.48%) Inclusion and Diversity
6 460 (4.96%) Aerospace
7 455 (4.90%) Banking
8 416 (4.48%) Electronics
9 396 (4.27%) Retail
10 390 (4.20%) Law
11 319 (3.44%) Marketing
12 310 (3.34%) Telecoms
13 270 (2.91%) Automotive
14 262 (2.82%) Presentation Skills
15 257 (2.77%) Games
16 247 (2.66%) Public Sector
17 241 (2.60%) Legal
18 202 (2.18%) Avionics
19 151 (1.63%) Influencing Skills
20 144 (1.55%) Aeronautics
Libraries, Frameworks & Software Standards
1 543 (5.85%) .NET
2 512 (5.52%) React
3 385 (4.15%) HTML
4 308 (3.32%) CSS
5 230 (2.48%) Node.js
6 208 (2.24%) AngularJS
7 183 (1.97%) RESTful
8 166 (1.79%) REST
9 154 (1.66%) Kafka
10 146 (1.57%) .NET Core
11 134 (1.44%) .NET Framework
12 117 (1.26%) GraphQL
13 113 (1.22%) Spring
14 106 (1.14%) Spring Boot
15 104 (1.12%) ASP.NET
16 103 (1.11%) Web Services
17 98 (1.06%) XML
18 84 (0.91%) Vue
19 81 (0.87%) Laravel
19 81 (0.87%) Pandas
Miscellaneous
1 481 (5.18%) Management Information System
2 330 (3.56%) Algorithms
3 259 (2.79%) Driving Licence
4 175 (1.89%) SCADA
5 149 (1.61%) Cloud Native
6 131 (1.41%) Product Ownership
7 129 (1.39%) Mobile App
8 107 (1.15%) Equities
8 107 (1.15%) Self-Motivation
9 105 (1.13%) Distributed Systems
10 99 (1.07%) Hedge funds
11 94 (1.01%) Public Cloud
12 89 (0.96%) Onboarding
13 88 (0.95%) Greenfield Project
14 83 (0.89%) Derivative
15 75 (0.81%) Fixed Income
16 74 (0.80%) Enterprise Software
16 74 (0.80%) Foreign Exchange (FX)
17 68 (0.73%) Hybrid Cloud
18 61 (0.66%) Data Structures
Operating Systems
1 452 (4.87%) Linux
2 373 (4.02%) Windows
3 109 (1.17%) Windows Server
4 80 (0.86%) Android
5 78 (0.84%) Unix
6 76 (0.82%) Apple iOS
7 73 (0.79%) Windows 10
8 23 (0.25%) Embedded Linux
8 23 (0.25%) Red Hat Enterprise Linux
9 19 (0.20%) Windows Server 2016
10 17 (0.18%) Solaris
11 15 (0.16%) Mac OS
12 14 (0.15%) VMS
13 12 (0.13%) Windows Server 2019
14 10 (0.11%) zOS
15 8 (0.086%) FreeRTOS
15 8 (0.086%) Windows Server 2012
15 8 (0.086%) Windows Vista
16 7 (0.075%) Ubuntu
17 5 (0.054%) Robot Operating System
Processes & Methodologies
1 1,784 (19.22%) Agile
2 1,671 (18.00%) Systems Engineering
3 1,298 (13.99%) Problem-Solving
4 1,185 (12.77%) Mentoring
5 1,088 (11.72%) Software Engineering
6 1,005 (10.83%) Mathematics
7 858 (9.24%) Project Management
8 821 (8.85%) Coaching
9 756 (8.15%) CI/CD
10 744 (8.02%) DevOps
11 669 (7.21%) Analytics
12 583 (6.28%) Physics
13 580 (6.25%) Computer Science
14 545 (5.87%) Risk Management
15 495 (5.33%) Artificial Intelligence
16 474 (5.11%) Decision-Making
17 456 (4.91%) Test Automation
18 448 (4.83%) Stakeholder Management
19 414 (4.46%) Change Management
20 386 (4.16%) Collaborative Working
Programming Languages
1 1,168 (12.58%) Python
2 888 (9.57%) SQL
3 714 (7.69%) JavaScript
4 666 (7.18%) C#
5 602 (6.49%) Java
6 494 (5.32%) TypeScript
7 332 (3.58%) C++
8 289 (3.11%) MATLAB
9 268 (2.89%) C
10 180 (1.94%) R
11 174 (1.87%) PHP
12 170 (1.83%) PowerShell
13 105 (1.13%) Rust
14 102 (1.10%) Go
15 85 (0.92%) Bash
16 74 (0.80%) Ada
17 73 (0.79%) T-SQL
18 70 (0.75%) Scala
19 57 (0.61%) PL/SQL
20 45 (0.48%) Ruby
Qualifications
1 3,728 (40.17%) Degree
2 2,930 (31.57%) BPSS Clearance
3 524 (5.65%) HND
4 423 (4.56%) Chartered Engineer
5 416 (4.48%) Master's Degree
6 317 (3.42%) Security Cleared
7 313 (3.37%) HNC
8 239 (2.58%) Numerate Degree
9 204 (2.20%) Computer Science Degree
10 188 (2.03%) SC Cleared
11 132 (1.42%) CISSP
12 128 (1.38%) DBS Check
13 105 (1.13%) Cisco Certification
14 90 (0.97%) ACCA
15 87 (0.94%) Microsoft Certification
16 80 (0.86%) Azure Certification
17 72 (0.78%) DV Cleared
18 67 (0.72%) CCNP
19 63 (0.68%) CIMA
20 58 (0.62%) CISA
Quality Assurance & Compliance
1 529 (5.70%) IEC 61508
2 366 (3.94%) Def Stans
3 364 (3.92%) QA
4 194 (2.09%) ISO/IEC 15288
5 163 (1.76%) ARP4754
5 163 (1.76%) DO-254
6 142 (1.53%) Accessibility
7 130 (1.40%) Data Quality
8 122 (1.31%) ISO 9001
9 118 (1.27%) HAZOP
10 110 (1.19%) ISO/IEC 17025
11 83 (0.89%) ISO/IEC 27001
12 81 (0.87%) GDPR
13 78 (0.84%) ISO/IEC 12207
14 67 (0.72%) IFRS
15 65 (0.70%) GAAP
16 62 (0.67%) NIST
17 48 (0.52%) ITGC
18 45 (0.48%) PMO
19 43 (0.46%) SLA
System Software
1 412 (4.44%) Docker
2 197 (2.12%) Active Directory
3 112 (1.21%) Firmware
4 104 (1.12%) VMware Infrastructure
5 69 (0.74%) Embedded Firmware
6 56 (0.60%) Hyper-V
7 48 (0.52%) Virtual Desktop
8 30 (0.32%) Virtual Machines
9 28 (0.30%) VMware ESXi
10 16 (0.17%) vSphere
11 8 (0.086%) VMware NSX
12 5 (0.054%) Apache Flume
12 5 (0.054%) Virtual Servers
13 4 (0.043%) HDFS
13 4 (0.043%) Veritas Cluster Server
14 3 (0.032%) Squid
15 2 (0.022%) BitLocker
15 2 (0.022%) IAG
15 2 (0.022%) Oracle RAC
16 1 (0.011%) GPFS
Systems Management
1 484 (5.21%) Kubernetes
2 313 (3.37%) Terraform
3 149 (1.61%) Ansible
4 120 (1.29%) Functional Safety
5 97 (1.05%) Microsoft Intune
6 41 (0.44%) Grafana
7 39 (0.42%) Prometheus
8 33 (0.36%) SCCM
9 26 (0.28%) Single Sign-On
10 19 (0.20%) Istio
10 19 (0.20%) Progress Chef
11 18 (0.19%) Puppet
12 15 (0.16%) Argo
12 15 (0.16%) FortiGate
13 12 (0.13%) Nagios
14 11 (0.12%) AWS Copilot
15 10 (0.11%) WSUS
16 9 (0.097%) Avamar
16 9 (0.097%) Failover Clustering
16 9 (0.097%) vCenter Server
Vendors
1 988 (10.65%) Microsoft
2 224 (2.41%) Google
2 224 (2.41%) Oracle
3 213 (2.30%) IBM
4 183 (1.97%) SAP
5 179 (1.93%) Cisco
6 159 (1.71%) Databricks
7 152 (1.64%) VMware
8 119 (1.28%) MathWorks
9 102 (1.10%) ServiceNow
10 101 (1.09%) Salesforce
11 79 (0.85%) Adobe
11 79 (0.85%) BT
12 67 (0.72%) Apple
13 66 (0.71%) ANSYS
14 61 (0.66%) Siemens
15 48 (0.52%) Atlassian
16 45 (0.48%) Citrix
16 45 (0.48%) Meraki
17 43 (0.46%) Cognos