Local Government Jobs in the South East

Local Government (Local Authority, Local Council)
England > South East

The table below looks at the prevalence of the term Local Government in permanent job vacancies in the South East. Included is a benchmarking guide to the salaries offered in vacancies that cited Local Government over the 6 months leading up to 26 July 2024, comparing them to the same period in the previous two years.

6 months to
26 Jul 2024
Same period 2023 Same period 2022
Rank 216 314 387
Rank change year-on-year +98 +73 +2
Permanent jobs citing Local Government 145 47 123
As % of all permanent jobs advertised in the South East 0.96% 0.41% 0.56%
As % of the General category 1.79% 0.67% 0.87%
Number of salaries quoted 62 31 46
10th Percentile £31,558 £33,232 £32,500
25th Percentile £36,250 £41,250 £40,450
Median annual salary (50th Percentile) £42,000 £52,500 £47,201
Median % change year-on-year -20.00% +11.23% +11.06%
75th Percentile £50,101 £55,250 £59,925
90th Percentile £90,336 £66,250 £65,000
England median annual salary £41,711 £50,000 £42,773
% change year-on-year -16.58% +16.90% -4.95%

All General Skills
South East

Local Government falls under the General Skills category. For comparison with the information above, the following table provides summary statistics for all permanent job vacancies requiring common skills in the South East.

Permanent vacancies with a requirement for common skills 8,122 7,045 14,153
As % of all permanent jobs advertised in the South East 53.81% 60.80% 64.14%
Number of salaries quoted 4,765 4,014 6,830
10th Percentile £26,250 £29,000 £30,000
25th Percentile £35,000 £37,500 £40,000
Median annual salary (50th Percentile) £49,881 £52,500 £55,000
Median % change year-on-year -4.99% -4.55% +10.00%
75th Percentile £63,750 £68,750 £68,750
90th Percentile £77,500 £83,750 £81,250
England median annual salary £55,000 £60,000 £60,000
% change year-on-year -8.33% - +4.35%

Local Government
Job Vacancy Trend in the South East

Job postings citing Local Government as a proportion of all IT jobs advertised in the South East.
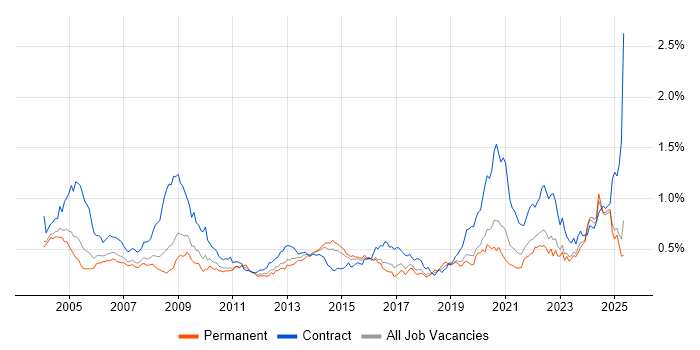
Job vacancy trend for Local Government in the South East

Local Government
Salary Trend in the South East

3-month moving average salary quoted in jobs citing Local Government in the South East.

Salary trend for Local Government in the South East

Local Government
Salary Histogram in the South East

Salary distribution for jobs citing Local Government in the South East over the 6 months to 26 July 2024.

Salary histogram for Local Government in the South East

Local Government
Job Locations in the South East

The table below looks at the demand and provides a guide to the median salaries quoted in IT jobs citing Local Government within the South East region over the 6 months to 26 July 2024. The 'Rank Change' column provides an indication of the change in demand within each location based on the same 6 month period last year.

Location Rank Change
on Same Period
Last Year
Matching
Permanent
IT Job Ads
Median Salary
Past 6 Months
Median Salary
% Change
on Same Period
Last Year
Live
Jobs
Thames Valley +52 49 £53,625 +2.14% 14
Surrey - 43 £43,923 - 5
Berkshire +38 36 £86,763 +65.26% 9
Hampshire - 22 £39,721 - 5
West Sussex - 22 £39,013 - 2
Buckinghamshire +17 13 £37,500 +8.41% 4
Kent -14 8 £49,737 +17.03% 6
East Sussex +8 1 £51,485 -15.20% 1
Local Government
England

Local Government
Co-occurring Skills and Capabilities in the South East by Category

The follow tables expand on the table above by listing co-occurrences grouped by category. The same employment type, locality and period is covered with up to 20 co-occurrences shown in each of the following categories:

Application Platforms
1 5 (3.45%) SharePoint
Applications
1 22 (15.17%) AutoCAD
2 5 (3.45%) Microsoft Excel
3 1 (0.69%) Microsoft Office
3 1 (0.69%) Photoshop
Business Applications
1 16 (11.03%) NEC Housing
2 4 (2.76%) Unit4 Business World
Cloud Services
1 18 (12.41%) SaaS
2 7 (4.83%) Power Platform
3 2 (1.38%) Boomi
3 2 (1.38%) iPaaS
3 2 (1.38%) Power Automate
4 1 (0.69%) Microsoft 365
Communications & Networking
1 4 (2.76%) Firewall
1 4 (2.76%) Wireless
2 3 (2.07%) LAN
2 3 (2.07%) Network Security
2 3 (2.07%) WAN
3 2 (1.38%) Structured Cabling
4 1 (0.69%) Cisco ISE
4 1 (0.69%) NGFW
4 1 (0.69%) VPN
4 1 (0.69%) Wi-Fi
Database & Business Intelligence
1 10 (6.90%) Oracle Database
2 6 (4.14%) Tableau
3 4 (2.76%) Power BI
4 3 (2.07%) Big Data
4 3 (2.07%) Data Warehouse
5 2 (1.38%) Data Hub
6 1 (0.69%) GIS
6 1 (0.69%) SQL Server Reporting Services
Development Applications
1 10 (6.90%) Oracle APEX
General
1 50 (34.48%) Social Skills
2 34 (23.45%) Inclusion and Diversity
3 33 (22.76%) Finance
4 28 (19.31%) Legal
5 26 (17.93%) Analytical Skills
6 23 (15.86%) Presentation Skills
7 20 (13.79%) Public Sector
7 20 (13.79%) Retail
8 10 (6.90%) Police
9 8 (5.52%) Influencing Skills
9 8 (5.52%) Telecoms
10 4 (2.76%) Marketing
11 3 (2.07%) Back Office
11 3 (2.07%) Law
11 3 (2.07%) Organisational Skills
12 2 (1.38%) Public Speaking
13 1 (0.69%) Fire and Rescue
Job Titles
1 20 (13.79%) Business Development Manager
1 20 (13.79%) Business Manager
1 20 (13.79%) Development Manager
2 17 (11.72%) Coordinator
3 16 (11.03%) Developer
3 16 (11.03%) Senior
3 16 (11.03%) Technical Coordinator
4 10 (6.90%) Oracle Developer
4 10 (6.90%) PL/SQL Developer
4 10 (6.90%) Project Manager
4 10 (6.90%) Software Developer
4 10 (6.90%) SQL Developer
5 9 (6.21%) Architect
5 9 (6.21%) Lead
6 7 (4.83%) Analyst
6 7 (4.83%) Data Analyst
7 6 (4.14%) Technical Manager
8 4 (2.76%) Account Executive
8 4 (2.76%) Digital Executive
9 3 (2.07%) Senior Technician
Libraries, Frameworks & Software Standards
1 12 (8.28%) CSS
1 12 (8.28%) HTML
1 12 (8.28%) JSON
1 12 (8.28%) SOAP
1 12 (8.28%) XML
2 10 (6.90%) REST
2 10 (6.90%) Ruby on Rails
3 2 (1.38%) .NET
3 2 (1.38%) .NET Core
3 2 (1.38%) .NET Framework
3 2 (1.38%) Code First Entity Framework
3 2 (1.38%) Entity Framework
3 2 (1.38%) OAuth
3 2 (1.38%) OAuth2
3 2 (1.38%) Razor View Engine
Miscellaneous
1 35 (24.14%) Onboarding
2 21 (14.48%) Housing Association
3 20 (13.79%) Driving Licence
4 18 (12.41%) iPad
5 15 (10.34%) NHS
6 8 (5.52%) Self-Motivation
7 5 (3.45%) Management Information System
8 4 (2.76%) IoT
8 4 (2.76%) PACS
9 3 (2.07%) Hybrid Cloud
9 3 (2.07%) Legacy Systems
9 3 (2.07%) Renewable Energy
9 3 (2.07%) Virtual Team
10 2 (1.38%) Freedom of Information
10 2 (1.38%) SystemC
11 1 (0.69%) Learning Management System
11 1 (0.69%) Social Media
Operating Systems
1 3 (2.07%) Windows
1 3 (2.07%) Windows Server
Processes & Methodologies
1 35 (24.14%) Agile
2 31 (21.38%) Problem-Solving
3 24 (16.55%) Business Development
4 22 (15.17%) Project Management
4 22 (15.17%) Time Management
5 21 (14.48%) Mathematics
6 20 (13.79%) Facilities Management
7 18 (12.41%) B2B
8 16 (11.03%) Project Delivery
9 15 (10.34%) Customer Service
10 14 (9.66%) Decision-Making
10 14 (9.66%) Line Management
11 12 (8.28%) Continuous Improvement
12 11 (7.59%) ITIL
13 10 (6.90%) Analytics
13 10 (6.90%) Computer Science
13 10 (6.90%) Data Security
13 10 (6.90%) ERP
13 10 (6.90%) Performance Tuning
13 10 (6.90%) Web Design
Programming Languages
1 24 (16.55%) SQL
2 12 (8.28%) C
3 10 (6.90%) Java
3 10 (6.90%) PL/SQL
3 10 (6.90%) Ruby
4 6 (4.14%) Python
4 6 (4.14%) R
5 2 (1.38%) C#
Qualifications
1 27 (18.62%) Degree
2 22 (15.17%) HNC
2 22 (15.17%) HND
3 19 (13.10%) DBS Check
4 10 (6.90%) Computer Science Degree
4 10 (6.90%) Security Cleared
5 1 (0.69%) CCNP
5 1 (0.69%) CISA
5 1 (0.69%) Cisco Certification
Quality Assurance & Compliance
1 12 (8.28%) Accessibility
2 7 (4.83%) QA
3 4 (2.76%) Cyber Essentials
3 4 (2.76%) SLA
4 3 (2.07%) PCI DSS
5 2 (1.38%) WCAG
6 1 (0.69%) COBIT
6 1 (0.69%) Cyber Essentials PLUS
6 1 (0.69%) GDPR
System Software
1 4 (2.76%) Active Directory
2 3 (2.07%) VMware Infrastructure
Systems Management
1 1 (0.69%) FortiGate
Vendors
1 16 (11.03%) NEC
2 10 (6.90%) Oracle
3 9 (6.21%) Microsoft
4 6 (4.14%) SAP
5 4 (2.76%) Cisco
5 4 (2.76%) HubSpot
6 3 (2.07%) Meraki
6 3 (2.07%) SolarWinds
6 3 (2.07%) VMware
7 1 (0.69%) GUPTA
7 1 (0.69%) Palo Alto
7 1 (0.69%) Samsung