Project Management Jobs in the South East

Project Management
England > South East

The following table provides summary statistics for permanent job vacancies advertised in the South East with a requirement for Project Management skills. Included is a benchmarking guide to the salaries offered in vacancies that have cited Project Management over the 6 months to 1 December 2023 with a comparison to the same period in the previous 2 years.

6 months to
1 Dec 2023
Same period 2022 Same period 2021
Rank 25 19 33
Rank change year-on-year -6 +14 +11
Permanent jobs citing Project Management 652 1,806 1,481
As % of all permanent jobs advertised in the South East 8.41% 10.37% 8.02%
As % of the Processes & Methodologies category 9.03% 10.91% 8.44%
Number of salaries quoted 377 1,018 923
10th Percentile £36,150 £36,250 £37,500
25th Percentile £42,250 £42,500 £42,500
Median annual salary (50th Percentile) £55,000 £55,000 £55,000
Median % change year-on-year - - +4.76%
75th Percentile £65,000 £70,000 £67,500
90th Percentile £78,000 £80,000 £77,500
England median annual salary £60,000 £59,500 £55,000
% change year-on-year +0.84% +8.18% -

All Process and Methodology Skills
South East

Project Management is in the Processes and Methodologies category. The following table is for comparison with the above and provides summary statistics for all permanent job vacancies advertised in the South East with a requirement for process or methodology skills.

Permanent vacancies with a requirement for process or methodology skills 7,222 16,558 17,546
As % of all permanent jobs advertised in the South East 93.16% 95.10% 94.99%
Number of salaries quoted 4,839 9,997 11,818
10th Percentile £30,500 £31,250 £31,250
25th Percentile £40,000 £41,750 £40,500
Median annual salary (50th Percentile) £54,500 £55,000 £52,500
Median % change year-on-year -0.91% +4.76% +5.00%
75th Percentile £67,500 £72,500 £67,500
90th Percentile £82,500 £85,000 £80,000
England median annual salary £60,000 £62,500 £60,000
% change year-on-year -4.00% +4.17% +9.09%

Project Management
Job Vacancy Trend in the South East

Job postings citing Project Management as a proportion of all IT jobs advertised in the South East.
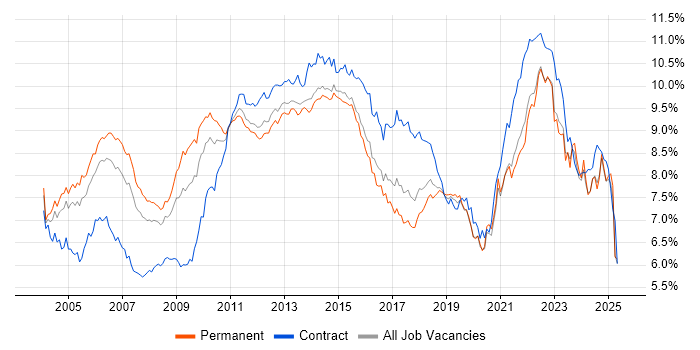
Job vacancy trend for Project Management in the South East

Project Management
Salary Trend in the South East

3-month moving average salary quoted in jobs citing Project Management in the South East.

Salary trend for Project Management in the South East

Project Management
Salary Histogram in the South East

Salary distribution for jobs citing Project Management in the South East over the 6 months to 1 December 2023.

Salary histogram for Project Management in the South East

Project Management
Job Locations in the South East

The table below looks at the demand and provides a guide to the median salaries quoted in IT jobs citing Project Management within the South East region over the 6 months to 1 December 2023. The 'Rank Change' column provides an indication of the change in demand within each location based on the same 6 month period last year.

Location Rank Change
on Same Period
Last Year
Matching
Permanent
IT Job Ads
Median Salary
Past 6 Months
Median Salary
% Change
on Same Period
Last Year
Live
Jobs
Thames Valley 0 295 £54,000 +3.85% 174
Berkshire -1 184 £54,500 +4.81% 91
Hampshire +3 153 £60,000 +20.00% 85
Surrey -11 79 £60,000 -2.83% 73
Buckinghamshire -7 57 £52,500 +0.48% 35
Oxfordshire +1 54 £55,750 +6.19% 48
West Sussex -4 52 £48,000 -20.00% 24
Kent -5 45 £45,000 - 42
East Sussex -4 19 £55,000 +10.00% 12
Middlesex +3 3 £38,500 -40.77% 1
Home Counties +4 1 - -
Project Management
England

Project Management
Co-occurring Skills and Capabilities in the South East by Category

The follow tables expand on the table above by listing co-occurrences grouped by category. The same employment type, locality and period is covered with up to 20 co-occurrences shown in each of the following categories:

Application Platforms
1 46 (7.06%) SAS
2 15 (2.30%) SharePoint
3 11 (1.69%) MS Exchange
4 8 (1.23%) Confluence
5 4 (0.61%) Adobe Experience Manager
6 3 (0.46%) CMS
7 1 (0.15%) Apache
7 1 (0.15%) Apache Airflow
7 1 (0.15%) Apache Spark
7 1 (0.15%) Jupyter
7 1 (0.15%) Luigi
7 1 (0.15%) MS Project Server
7 1 (0.15%) nginx
7 1 (0.15%) Oracle SOA Suite
7 1 (0.15%) Oracle Workflow
Applications
1 66 (10.12%) Microsoft Office
2 40 (6.13%) Microsoft Project
3 26 (3.99%) Microsoft Excel
4 11 (1.69%) Microsoft PowerPoint
5 7 (1.07%) MS Visio
6 5 (0.77%) AutoCAD
6 5 (0.77%) Autodesk Inventor
6 5 (0.77%) SOLIDWORKS
7 2 (0.31%) CATIA
7 2 (0.31%) LibreOffice
8 1 (0.15%) Adobe Creative Suite
Business Applications
1 7 (1.07%) SAP S/4HANA
2 3 (0.46%) SAP MM
2 3 (0.46%) Unit4 Business World
3 2 (0.31%) Dynamics NAV
3 2 (0.31%) Maximo
3 2 (0.31%) NetSuite
3 2 (0.31%) SAP CO
3 2 (0.31%) SAP ERP
3 2 (0.31%) SAP FI
3 2 (0.31%) SAP FI/CO
3 2 (0.31%) SAP PP
3 2 (0.31%) SAP SD
4 1 (0.15%) Dynamics AX
4 1 (0.15%) Dynamics CRM
4 1 (0.15%) Infor M3
4 1 (0.15%) Oracle EBS
4 1 (0.15%) Primavera
4 1 (0.15%) Sage X3
4 1 (0.15%) Salesforce CRM
4 1 (0.15%) SAP Business One
Cloud Services
1 89 (13.65%) Microsoft 365
2 62 (9.51%) Azure
3 22 (3.37%) SaaS
4 16 (2.45%) AWS
5 9 (1.38%) Cloud Computing
5 9 (1.38%) Power Platform
6 7 (1.07%) Azure Logic Apps
6 7 (1.07%) PaaS
7 6 (0.92%) IaaS
7 6 (0.92%) Smartsheet
8 5 (0.77%) Azure DevOps
8 5 (0.77%) WhatsApp
9 4 (0.61%) Azure ExpressRoute
10 3 (0.46%) Veeva
11 2 (0.31%) Amazon CloudWatch
11 2 (0.31%) Amazon ELB
11 2 (0.31%) Amazon Glacier
11 2 (0.31%) GCP
11 2 (0.31%) GitHub
11 2 (0.31%) Virtual Private Cloud
Communications & Networking
1 27 (4.14%) Firewall
1 27 (4.14%) VPN
2 24 (3.68%) SAN
3 19 (2.91%) WAN
4 13 (1.99%) iSCSI
5 12 (1.84%) LAN
6 11 (1.69%) DNS
6 11 (1.69%) VLAN
6 11 (1.69%) WLAN
7 9 (1.38%) Fibre Channel
7 9 (1.38%) NAS
8 8 (1.23%) DHCP
9 5 (0.77%) Internet
9 5 (0.77%) VoIP
9 5 (0.77%) Wireshark
10 4 (0.61%) ATM
10 4 (0.61%) BGP
10 4 (0.61%) Broadband
10 4 (0.61%) EIGRP
10 4 (0.61%) MPLS
Database & Business Intelligence
1 41 (6.29%) Base SAS
2 26 (3.99%) Metadata
3 14 (2.15%) SQL Server
4 8 (1.23%) Data Warehouse
5 7 (1.07%) Power BI
6 4 (0.61%) GIS
6 4 (0.61%) MySQL
6 4 (0.61%) Power Query
6 4 (0.61%) SAP HANA
6 4 (0.61%) SQL Server Analysis Services
6 4 (0.61%) SQL Server Integration Services
6 4 (0.61%) SQL Server Reporting Services
7 3 (0.46%) Jackrabbit
7 3 (0.46%) PostgreSQL
7 3 (0.46%) Relational Database
8 2 (0.31%) Amazon RDS
8 2 (0.31%) Data Lake
8 2 (0.31%) Elasticsearch
8 2 (0.31%) MongoDB
8 2 (0.31%) NoSQL
Development Applications
1 26 (3.99%) JIRA
2 19 (2.91%) MSI
3 17 (2.61%) AdminStudio
3 17 (2.61%) InstallShield
4 10 (1.53%) Git
5 7 (1.07%) Jenkins
6 2 (0.31%) LabVIEW
6 2 (0.31%) Subversion
6 2 (0.31%) Vagrant
7 1 (0.15%) Cucumber
7 1 (0.15%) GitLab
7 1 (0.15%) JMeter
7 1 (0.15%) JUnit
7 1 (0.15%) REST Assured
7 1 (0.15%) TestRail
General
1 270 (41.41%) Social Skills
2 135 (20.71%) Finance
3 110 (16.87%) Analytical Skills
4 76 (11.66%) Manufacturing
5 62 (9.51%) Inclusion and Diversity
6 57 (8.74%) Organisational Skills
7 48 (7.36%) Pharmaceutical
8 46 (7.06%) Presentation Skills
9 35 (5.37%) Retail
10 34 (5.21%) Marketing
10 34 (5.21%) Public Sector
11 25 (3.83%) Legal
12 15 (2.30%) Telecoms
13 14 (2.15%) Influencing Skills
14 9 (1.38%) Aerospace
15 8 (1.23%) Billing
15 8 (1.23%) Police
16 7 (1.07%) Documentation Skills
17 6 (0.92%) Law
18 5 (0.77%) Front Office
Job Titles
1 163 (25.00%) Project Manager
2 102 (15.64%) Analyst
3 73 (11.20%) Senior
4 37 (5.67%) IT Manager
5 33 (5.06%) Lead
6 32 (4.91%) Senior Manager
6 32 (4.91%) Senior Project Manager
7 31 (4.75%) IT Project Manager
8 28 (4.29%) Consultant
9 24 (3.68%) Principal Statistical Programmer
9 24 (3.68%) Programmer
9 24 (3.68%) SAS Programmer
9 24 (3.68%) SAS Statistical Programmer
9 24 (3.68%) Statistical Programmer
10 21 (3.22%) IT Analyst
11 20 (3.07%) Architect
12 19 (2.91%) Applications Packager
12 19 (2.91%) Developer
12 19 (2.91%) Project Engineer
13 18 (2.76%) Support Analyst
Libraries, Frameworks & Software Standards
1 28 (4.29%) XML
2 14 (2.15%) EDI
3 12 (1.84%) .NET
4 7 (1.07%) CSS
5 6 (0.92%) .NET Framework
5 6 (0.92%) Blazor
5 6 (0.92%) Entity Framework
6 5 (0.77%) Web Services
7 4 (0.61%) React
8 3 (0.46%) JSON
8 3 (0.46%) JSR 170
8 3 (0.46%) Kafka
8 3 (0.46%) OSGi
8 3 (0.46%) RESTful
9 2 (0.31%) ASP.NET
9 2 (0.31%) ODBC
9 2 (0.31%) OpenMP
9 2 (0.31%) SOAP
9 2 (0.31%) XSL
9 2 (0.31%) XSLT
Miscellaneous
1 51 (7.82%) Onboarding
2 42 (6.44%) Life Science
2 42 (6.44%) Management Information System
2 42 (6.44%) Self-Motivation
3 28 (4.29%) Virtual Team
4 18 (2.76%) Driving Licence
5 17 (2.61%) Shadow IT
6 14 (2.15%) PMI
7 12 (1.84%) Product Ownership
8 10 (1.53%) Data Centre
9 8 (1.23%) FMCG
9 8 (1.23%) Public Cloud
10 7 (1.07%) Enterprise Software
11 6 (0.92%) Mobile App
12 5 (0.77%) Augmented Reality
12 5 (0.77%) Blog
12 5 (0.77%) Graphic Design
12 5 (0.77%) Private Cloud
12 5 (0.77%) Social Media
12 5 (0.77%) Virtual Reality
Operating Systems
1 63 (9.66%) Windows
2 26 (3.99%) Windows 10
3 19 (2.91%) Windows 7
4 18 (2.76%) Linux
5 10 (1.53%) Windows Server
6 7 (1.07%) Windows Server 2016
7 6 (0.92%) Android
7 6 (0.92%) Windows Server 2012
7 6 (0.92%) Windows Server 2019
8 5 (0.77%) Windows XP
9 2 (0.31%) Embedded Linux
9 2 (0.31%) VMS
10 1 (0.15%) Apple iOS
10 1 (0.15%) Mac OS
10 1 (0.15%) Red Hat Enterprise Linux
10 1 (0.15%) Ubuntu
10 1 (0.15%) Windows Server 2008
Processes & Methodologies
1 204 (31.29%) Agile
2 201 (30.83%) Problem-Solving
3 177 (27.15%) Project Delivery
4 131 (20.09%) ITIL
5 125 (19.17%) PRINCE2
6 113 (17.33%) Change Management
7 100 (15.34%) Service Management
8 79 (12.12%) Collaborative Working
8 79 (12.12%) Stakeholder Management
9 78 (11.96%) Computer Science
10 76 (11.66%) Decision-Making
10 76 (11.66%) Waterfall
11 73 (11.20%) Mentoring
12 69 (10.58%) Line Management
13 67 (10.28%) Customer Service
14 59 (9.05%) Risk Assessment
15 55 (8.44%) Time Management
16 54 (8.28%) Data Management
17 53 (8.13%) ERP
18 52 (7.98%) SDLC
Programming Languages
1 41 (6.29%) SAS Macro
2 37 (5.67%) SQL
3 35 (5.37%) C#
3 35 (5.37%) PowerShell
4 21 (3.22%) Java
5 20 (3.07%) VB
6 14 (2.15%) Python
7 8 (1.23%) JavaScript
8 7 (1.07%) C
9 6 (0.92%) C++
9 6 (0.92%) T-SQL
10 4 (0.61%) ABAP
11 3 (0.46%) Tcl
12 2 (0.31%) Fortran
12 2 (0.31%) Groovy
12 2 (0.31%) MATLAB
12 2 (0.31%) Perl
12 2 (0.31%) Ruby
12 2 (0.31%) Shell Script
12 2 (0.31%) VBA
Qualifications
1 235 (36.04%) Degree
2 84 (12.88%) Security Cleared
3 65 (9.97%) SC Cleared
4 34 (5.21%) PMI Certification
5 28 (4.29%) Computer Science Degree
5 28 (4.29%) DV Cleared
6 25 (3.83%) PMP
7 24 (3.68%) Numerate Degree
8 18 (2.76%) DBS Check
8 18 (2.76%) PRINCE2 Practitioner
9 15 (2.30%) Microsoft Certification
10 12 (1.84%) ITIL Certification
11 11 (1.69%) Master's Degree
12 10 (1.53%) MCSE
12 10 (1.53%) PRINCE2 Certification
13 9 (1.38%) APMP
14 7 (1.07%) Cisco Certification
14 7 (1.07%) CISSP
15 6 (0.92%) BPSS Clearance
15 6 (0.92%) CCNP
Quality Assurance & Compliance
1 66 (10.12%) QA
2 41 (6.29%) CDISC
2 41 (6.29%) PMO
3 19 (2.91%) Accessibility
4 8 (1.23%) ISO 9001
5 7 (1.07%) Sarbanes-Oxley
6 6 (0.92%) SLA
7 5 (0.77%) GDPR
7 5 (0.77%) HIPAA
8 2 (0.31%) Data Quality
8 2 (0.31%) ISO/IEC 27001
8 2 (0.31%) NIST
9 1 (0.15%) Cyber Essentials
9 1 (0.15%) FISMA
9 1 (0.15%) GRC
9 1 (0.15%) IFRS
9 1 (0.15%) ISO/IEC 27005
9 1 (0.15%) P3O
9 1 (0.15%) PCI DSS
9 1 (0.15%) PMBOK
System Software
1 49 (7.52%) Active Directory
2 28 (4.29%) VMware Infrastructure
3 17 (2.61%) Microsoft App-V
4 10 (1.53%) Terminal Server
5 8 (1.23%) Hyper-V
6 5 (0.77%) VMware ESXi
7 4 (0.61%) Firmware
8 3 (0.46%) Docker
9 2 (0.31%) Embedded Firmware
9 2 (0.31%) Virtual Machines
10 1 (0.15%) Microsoft Virtual Server
10 1 (0.15%) Virtual Servers
Systems Management
1 36 (5.52%) SCCM
2 22 (3.37%) WSUS
3 9 (1.38%) Microsoft Intune
4 8 (1.23%) Terraform
5 7 (1.07%) Ansible
6 6 (0.92%) NetBackup
7 5 (0.77%) EMC NetWorker
7 5 (0.77%) SCOM
7 5 (0.77%) vCenter Server
8 4 (0.61%) FortiGate
9 2 (0.31%) Kubernetes
9 2 (0.31%) Nagios
10 1 (0.15%) Kibana
10 1 (0.15%) Oozie
10 1 (0.15%) PaperCut
10 1 (0.15%) Progress Chef
10 1 (0.15%) Puppet
10 1 (0.15%) Single Sign-On
Vendors
1 116 (17.79%) Microsoft
2 47 (7.21%) NEC
3 35 (5.37%) VMware
4 29 (4.45%) Salesforce
4 29 (4.45%) ServiceNow
5 19 (2.91%) Autodesk
5 19 (2.91%) Dell
5 19 (2.91%) Oracle
5 19 (2.91%) SAP
6 18 (2.76%) HP
7 17 (2.61%) Cisco
8 14 (2.15%) Sun
9 11 (1.69%) Bloomberg
10 10 (1.53%) Adobe
11 9 (1.38%) Palo Alto
12 8 (1.23%) Google
12 8 (1.23%) Veeam
13 7 (1.07%) Citrix
14 5 (0.77%) EMC
14 5 (0.77%) Symantec