SaaS Jobs in the South East

Software as a Service (SaaS)
England > South East

The following table provides summary statistics for permanent job vacancies advertised in the South East with a requirement for SaaS skills. Included is a benchmarking guide to the salaries offered in vacancies that have cited SaaS over the 6 months to 27 April 2024 with a comparison to the same period in the previous 2 years.

6 months to
27 Apr 2024
Same period 2023 Same period 2022
Rank 91 34 43
Rank change year-on-year -57 +9 +5
Permanent jobs citing SaaS 482 1,023 1,223
As % of all permanent jobs advertised in the South East 2.90% 6.78% 6.21%
As % of the Cloud Services category 9.35% 18.33% 14.62%
Number of salaries quoted 390 739 940
10th Percentile £36,250 £37,500 £36,250
25th Percentile £42,500 £46,250 £42,500
Median annual salary (50th Percentile) £55,710 £60,000 £60,000
Median % change year-on-year -7.15% - +9.09%
75th Percentile £75,000 £77,500 £76,938
90th Percentile £91,250 £92,500 £87,500
England median annual salary £65,000 £67,500 £65,000
% change year-on-year -3.70% +3.85% +8.33%

All Cloud Skills
South East

SaaS is in the Cloud Services category. The following table is for comparison with the above and provides summary statistics for all permanent job vacancies advertised in the South East with a requirement for cloud computing skills.

Permanent vacancies with a requirement for cloud computing skills 5,157 5,581 8,368
As % of all permanent jobs advertised in the South East 31.06% 37.01% 42.46%
Number of salaries quoted 4,035 3,860 5,788
10th Percentile £27,750 £29,975 £31,250
25th Percentile £36,500 £41,250 £42,500
Median annual salary (50th Percentile) £50,000 £55,000 £55,000
Median % change year-on-year -9.09% - +3.77%
75th Percentile £65,000 £75,000 £73,750
90th Percentile £80,000 £90,000 £85,000
England median annual salary £57,500 £65,000 £62,500
% change year-on-year -11.54% +4.00% +4.17%

SaaS
Job Vacancy Trend in the South East

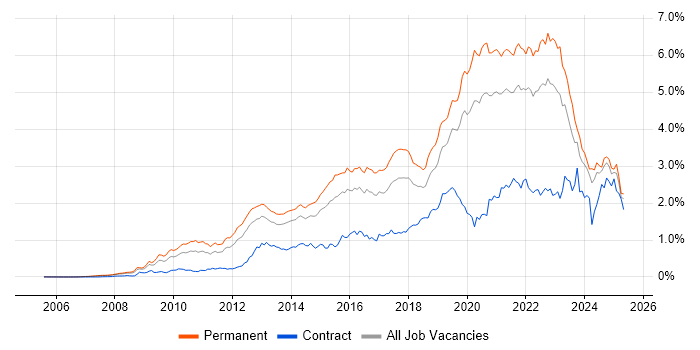
Job postings citing SaaS as a proportion of all IT jobs advertised in the South East.

Job vacancy trend for SaaS in the South East

SaaS
Salary Trend in the South East

3-month moving average salary quoted in jobs citing SaaS in the South East.

Salary trend for SaaS in the South East

SaaS
Salary Histogram in the South East

Salary distribution for jobs citing SaaS in the South East over the 6 months to 27 April 2024.

Salary histogram for SaaS in the South East

SaaS
Job Locations in the South East

The table below looks at the demand and provides a guide to the median salaries quoted in IT jobs citing SaaS within the South East region over the 6 months to 27 April 2024. The 'Rank Change' column provides an indication of the change in demand within each location based on the same 6 month period last year.

Location Rank Change
on Same Period
Last Year
Matching
Permanent
IT Job Ads
Median Salary
Past 6 Months
Median Salary
% Change
on Same Period
Last Year
Live
Jobs
Thames Valley -61 158 £55,000 -12.00% 81
Hampshire -29 150 £57,500 - 32
Surrey -33 96 £55,000 -29.03% 39
Berkshire -37 81 £55,000 -8.33% 37
Oxfordshire -34 47 £52,500 -25.00% 22
Buckinghamshire -31 30 £57,500 +21.05% 22
East Sussex -34 30 £75,000 +36.36% 5
West Sussex +10 18 £50,000 -9.09%
Kent -36 17 £44,500 -31.54% 7
Isle of Wight - 4 £42,500 -
Home Counties +15 2 £90,000 -
Middlesex - 2 £100,000 - 1
SaaS
England

SaaS
Co-occurring Skills and Capabilities in the South East by Category

The follow tables expand on the table above by listing co-occurrences grouped by category. The same employment type, locality and period is covered with up to 20 co-occurrences shown in each of the following categories:

Application Platforms
1 12 (2.49%) SharePoint
2 10 (2.07%) Microsoft Exchange
3 4 (0.83%) Confluence
4 2 (0.41%) IIS
4 2 (0.41%) Kinematics
5 1 (0.21%) CMS
Applications
1 17 (3.53%) Microsoft Excel
2 10 (2.07%) Microsoft Project
3 8 (1.66%) Spreadsheet
4 6 (1.24%) Microsoft Office
5 5 (1.04%) Microsoft PowerPoint
6 2 (0.41%) Notion
7 1 (0.21%) Adobe Creative Suite
7 1 (0.21%) InVision
7 1 (0.21%) Sketch
Business Applications
1 7 (1.45%) Salesforce CRM
2 3 (0.62%) Remedy ITSM
3 2 (0.41%) Dynamics CRM
4 1 (0.21%) SAP ERP
Cloud Services
1 128 (26.56%) Azure
2 115 (23.86%) AWS
3 40 (8.30%) Microsoft 365
4 36 (7.47%) PaaS
5 27 (5.60%) IaaS
6 21 (4.36%) Azure DevOps
7 20 (4.15%) GitHub
8 19 (3.94%) GCP
9 10 (2.07%) Cloud Computing
10 7 (1.45%) Amazon S3
10 7 (1.45%) Cloudflare
10 7 (1.45%) OneDrive
10 7 (1.45%) Serverless
11 6 (1.24%) Amazon ECS
11 6 (1.24%) Amazon EKS
11 6 (1.24%) AWS CloudFormation
11 6 (1.24%) AWS Fargate
11 6 (1.24%) AWS Lambda
11 6 (1.24%) Azure AKS
11 6 (1.24%) Azure Functions
Communications & Networking
1 29 (6.02%) Firewall
2 18 (3.73%) VPN
3 12 (2.49%) VoIP
4 11 (2.28%) LAN
4 11 (2.28%) Network Security
4 11 (2.28%) WAN
5 10 (2.07%) VLAN
6 8 (1.66%) SAN
7 6 (1.24%) Internet
7 6 (1.24%) TCP/IP
8 4 (0.83%) DNS
8 4 (0.83%) HTTP
9 3 (0.62%) 5G
9 3 (0.62%) Broadband
9 3 (0.62%) RFID
9 3 (0.62%) Unified Communications
9 3 (0.62%) Wi-Fi
10 2 (0.41%) DHCP
11 1 (0.21%) DECT
11 1 (0.21%) SSL
Database & Business Intelligence
1 47 (9.75%) SQL Server
2 22 (4.56%) MySQL
3 12 (2.49%) MariaDB
4 8 (1.66%) Relational Database
5 7 (1.45%) PostgreSQL
6 5 (1.04%) Elasticsearch
6 5 (1.04%) Oracle Database
6 5 (1.04%) RDBMS
7 4 (0.83%) Amazon RDS
7 4 (0.83%) Redis
7 4 (0.83%) Tableau
8 3 (0.62%) Geospatial Data
8 3 (0.62%) GIS
9 2 (0.41%) Big Data
9 2 (0.41%) Data Warehouse
9 2 (0.41%) NoSQL
10 1 (0.21%) SAP HANA
10 1 (0.21%) SQL Server Integration Services
10 1 (0.21%) SQL Server Reporting Services
10 1 (0.21%) SQLite
Development Applications
1 49 (10.17%) Git
2 38 (7.88%) Selenium
3 28 (5.81%) JIRA
4 25 (5.19%) Jenkins
5 15 (3.11%) JUnit
6 13 (2.70%) JMeter
7 10 (2.07%) Cucumber
8 8 (1.66%) Bitbucket Server
8 8 (1.66%) Postman
8 8 (1.66%) Serenity BDD
9 7 (1.45%) Bitbucket
9 7 (1.45%) REST Assured
9 7 (1.45%) SoapUI
10 6 (1.24%) Newman
11 5 (1.04%) Oracle APEX
12 4 (0.83%) MSBuild
12 4 (0.83%) TeamCity
13 3 (0.62%) GitLab
13 3 (0.62%) Hudson
14 2 (0.41%) Visual Studio Code
General
1 156 (32.37%) Social Skills
2 58 (12.03%) Finance
3 48 (9.96%) Analytical Skills
4 30 (6.22%) Marketing
5 28 (5.81%) Organisational Skills
6 25 (5.19%) Inclusion and Diversity
7 14 (2.90%) Presentation Skills
8 13 (2.70%) Pharmaceutical
8 13 (2.70%) Public Sector
8 13 (2.70%) Telecoms
9 12 (2.49%) Legal
10 11 (2.28%) Manufacturing
11 9 (1.87%) Automotive
11 9 (1.87%) Local Government
12 7 (1.45%) Aviation
12 7 (1.45%) Documentation Skills
12 7 (1.45%) Law
12 7 (1.45%) Retail
13 6 (1.24%) Advertising
14 3 (0.62%) Electronics
Job Titles
1 102 (21.16%) Developer
2 82 (17.01%) Senior
3 46 (9.54%) Analyst
4 41 (8.51%) Architect
5 40 (8.30%) Lead
5 40 (8.30%) Senior Developer
6 31 (6.43%) Software Engineer
7 29 (6.02%) PHP Developer
8 28 (5.81%) DevOps Engineer
9 22 (4.56%) Azure Engineer
10 21 (4.36%) C++ Software Engineer
10 21 (4.36%) Full Stack Developer
11 20 (4.15%) Azure DevOps Engineer
11 20 (4.15%) Project Manager
12 15 (3.11%) Senior Manager
13 14 (2.90%) PHP Laravel Developer
13 14 (2.90%) Software Developer
14 13 (2.70%) Infrastructure Engineer
14 13 (2.70%) Java Developer
14 13 (2.70%) Senior Java Developer
Libraries, Frameworks & Software Standards
1 61 (12.66%) .NET
2 42 (8.71%) React
3 37 (7.68%) HTML
3 37 (7.68%) Laravel
4 35 (7.26%) CSS
5 30 (6.22%) Vue
6 29 (6.02%) Web Services
7 28 (5.81%) RESTful
8 25 (5.19%) jQuery
9 24 (4.98%) JSON
10 23 (4.77%) SOAP
11 22 (4.56%) AngularJS
11 22 (4.56%) XML
12 21 (4.36%) REST
13 16 (3.32%) OAuth
14 13 (2.70%) Hibernate
14 13 (2.70%) Spring
15 11 (2.28%) Yii
16 10 (2.07%) .NET Core
16 10 (2.07%) Node.js
Miscellaneous
1 42 (8.71%) Greenfield Project
2 25 (5.19%) Product Ownership
3 21 (4.36%) Enterprise Software
3 21 (4.36%) Management Information System
3 21 (4.36%) Satnav
4 14 (2.90%) Onboarding
5 13 (2.70%) Algorithms
6 12 (2.49%) Data Structures
6 12 (2.49%) Mobile App
6 12 (2.49%) Self-Motivation
7 11 (2.28%) IoT
7 11 (2.28%) Public Cloud
7 11 (2.28%) Security Posture
8 9 (1.87%) BYOD
9 7 (1.45%) Hybrid Cloud
9 7 (1.45%) Low-Code
9 7 (1.45%) PKI
10 6 (1.24%) Client/Server
10 6 (1.24%) Operational Technology
11 4 (0.83%) Linux Command Line
Operating Systems
1 58 (12.03%) Windows
2 37 (7.68%) Windows Server
3 16 (3.32%) Linux
4 13 (2.70%) Unix
5 8 (1.66%) Windows Server 2019
6 7 (1.45%) Windows 10
6 7 (1.45%) Windows Server 2012
6 7 (1.45%) Windows Server 2016
7 6 (1.24%) Ubuntu
8 4 (0.83%) CentOS
8 4 (0.83%) Windows 7
8 4 (0.83%) Windows Server 2003
9 2 (0.41%) Mac OS
10 1 (0.21%) Red Hat Enterprise Linux
10 1 (0.21%) Windows Server 2008
Processes & Methodologies
1 132 (27.39%) Agile
2 120 (24.90%) Problem-Solving
3 104 (21.58%) DevOps
4 82 (17.01%) Test Automation
5 65 (13.49%) CI/CD
6 62 (12.86%) Software Engineering
7 52 (10.79%) User Experience
8 51 (10.58%) Scrum
9 47 (9.75%) Roadmaps
10 44 (9.13%) Project Management
11 43 (8.92%) Computer Science
12 41 (8.51%) SDLC
13 36 (7.47%) Code Quality
14 34 (7.05%) E-Commerce
14 34 (7.05%) Microservices
14 34 (7.05%) OOP
15 33 (6.85%) ITIL
15 33 (6.85%) Web Development
16 31 (6.43%) Actionable Insight
16 31 (6.43%) Software Testing
Programming Languages
1 83 (17.22%) JavaScript
2 71 (14.73%) SQL
3 66 (13.69%) C#
4 62 (12.86%) Java
5 46 (9.54%) PHP
6 32 (6.64%) PowerShell
7 28 (5.81%) C
8 27 (5.60%) Python
9 23 (4.77%) C++
10 7 (1.45%) Go
10 7 (1.45%) PL/SQL
11 5 (1.04%) Bicep
11 5 (1.04%) Ruby
12 4 (0.83%) Bash
12 4 (0.83%) Groovy
12 4 (0.83%) R
13 3 (0.62%) TypeScript
14 2 (0.41%) Tcl
14 2 (0.41%) VBScript
14 2 (0.41%) XAML
Qualifications
1 98 (20.33%) Degree
2 40 (8.30%) Security Cleared
3 33 (6.85%) SC Cleared
4 21 (4.36%) ISTQB
5 17 (3.53%) Computer Science Degree
6 12 (2.49%) Master's Degree
7 11 (2.28%) MBA
8 8 (1.66%) ISEB
9 5 (1.04%) Microsoft Certification
9 5 (1.04%) PMI Certification
9 5 (1.04%) PRINCE2 Certification
10 4 (0.83%) CSPO
11 3 (0.62%) CCNA
11 3 (0.62%) Cisco Certification
11 3 (0.62%) DV Cleared
12 2 (0.41%) ITIL Certification
13 1 (0.21%) MCSE
13 1 (0.21%) PMP
13 1 (0.21%) Project+ Certification
13 1 (0.21%) TOGAF Certification
Quality Assurance & Compliance
1 74 (15.35%) QA
2 21 (4.36%) Software Quality Assurance
3 19 (3.94%) SLA
4 10 (2.07%) ISO/IEC 27001
5 8 (1.66%) PCI DSS
6 6 (1.24%) COBIT
6 6 (1.24%) NIST
7 2 (0.41%) Data Quality
8 1 (0.21%) Actionable Recommendations
8 1 (0.21%) ISO 9001
8 1 (0.21%) SOC 2
System Software
1 54 (11.20%) Docker
2 27 (5.60%) Active Directory
3 19 (3.94%) VMware Infrastructure
4 16 (3.32%) Hyper-V
4 16 (3.32%) Virtual Machines
5 10 (2.07%) vSphere
6 3 (0.62%) VirtualBox
7 2 (0.41%) Firmware
7 2 (0.41%) KVM
7 2 (0.41%) QEMU
7 2 (0.41%) Xen
Systems Management
1 58 (12.03%) Kubernetes
2 28 (5.81%) Terraform
3 5 (1.04%) Puppet
4 4 (0.83%) Ansible
4 4 (0.83%) EMC NetWorker
4 4 (0.83%) NetCrunch
5 3 (0.62%) Dell DRAC
5 3 (0.62%) Docker Swarm
5 3 (0.62%) Nessus
5 3 (0.62%) Single Sign-On
5 3 (0.62%) vCenter Server
6 1 (0.21%) Grafana
6 1 (0.21%) Nagios
6 1 (0.21%) PaperCut
6 1 (0.21%) Prometheus
6 1 (0.21%) systemd
Vendors
1 88 (18.26%) Microsoft
2 25 (5.19%) VMware
3 17 (3.53%) Google
4 12 (2.49%) Oracle
4 12 (2.49%) Salesforce
5 10 (2.07%) Adobe
5 10 (2.07%) Cisco
6 7 (1.45%) Palo Alto
6 7 (1.45%) ServiceNow
7 6 (1.24%) Apple
7 6 (1.24%) ForgeRock
7 6 (1.24%) Red Hat
7 6 (1.24%) Sitecore
8 5 (1.04%) Commvault
8 5 (1.04%) Dell
8 5 (1.04%) EMC
8 5 (1.04%) HubSpot
9 4 (0.83%) Meraki
9 4 (0.83%) Nimble Storage
9 4 (0.83%) Zerto