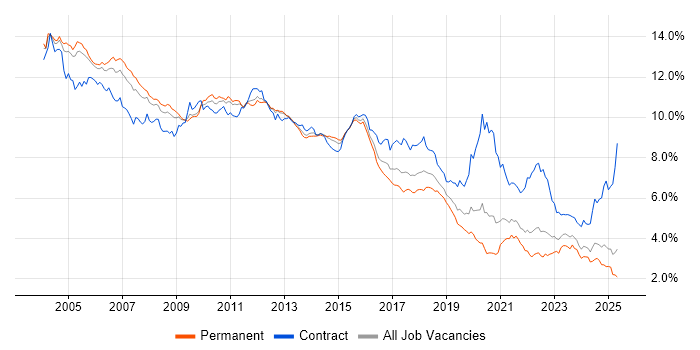
Oracle Jobs in the South East

Oracle
England > South East

The table below provides summary statistics for permanent job vacancies advertised in the South East requiring knowledge or experience of Oracle products and/or services. It includes a benchmarking guide to the annual salaries offered in vacancies that cited Oracle over the 6 months leading up to 26 July 2024, comparing them to the same period in the previous two years.

The figures below represent the IT labour market in general and are not representative of salaries within the Oracle Corporation.

6 months to
26 Jul 2024
Same period 2023 Same period 2022
Rank 86 94 128
Rank change year-on-year +8 +34 -55
Permanent jobs citing Oracle 425 384 621
As % of all permanent jobs advertised in the South East 2.82% 3.31% 2.81%
As % of the Vendors category 7.63% 8.22% 7.34%
Number of salaries quoted 183 210 376
10th Percentile £41,250 £36,713 £35,625
25th Percentile £42,532 £38,000 £47,500
Median annual salary (50th Percentile) £50,000 £54,250 £55,000
Median % change year-on-year -7.83% -1.36% +4.76%
75th Percentile £65,000 £71,250 £68,750
90th Percentile £71,250 £75,000 £75,000
England median annual salary £60,500 £60,000 £60,000
% change year-on-year +0.83% - +4.35%

All Vendors
South East

Oracle falls under the Vendor Products and Services category. For comparison with the information above, the following table provides summary statistics for all permanent job vacancies requiring knowledge or experience of all vendor products and services in the South East.

Permanent vacancies with a requirement for knowledge or experience of vendor products and services 5,572 4,670 8,455
As % of all permanent jobs advertised in the South East 36.92% 40.30% 38.32%
Number of salaries quoted 3,394 3,072 4,761
10th Percentile £27,500 £27,500 £27,501
25th Percentile £36,250 £36,250 £36,250
Median annual salary (50th Percentile) £48,000 £50,000 £50,000
Median % change year-on-year -4.00% - -
75th Percentile £62,500 £65,000 £66,250
90th Percentile £77,275 £77,500 £80,000
England median annual salary £52,500 £57,500 £55,000
% change year-on-year -8.70% +4.55% +0.92%

Oracle
Job Vacancy Trend in the South East

Job postings citing Oracle as a proportion of all IT jobs advertised in the South East.

Job vacancy trend for Oracle in the South East

Oracle
Salary Trend in the South East

3-month moving average salary quoted in jobs citing Oracle in the South East.

Salary trend for Oracle in the South East

Oracle
Salary Histogram in the South East

Salary distribution for jobs citing Oracle in the South East over the 6 months to 26 July 2024.

Salary histogram for Oracle in the South East

Oracle
Job Locations in the South East

The table below looks at the demand and provides a guide to the median salaries quoted in IT jobs citing Oracle within the South East region over the 6 months to 26 July 2024. The 'Rank Change' column provides an indication of the change in demand within each location based on the same 6 month period last year.

Location Rank Change
on Same Period
Last Year
Matching
Permanent
IT Job Ads
Median Salary
Past 6 Months
Median Salary
% Change
on Same Period
Last Year
Live
Jobs
Thames Valley -5 184 £50,000 -4.76% 14
Berkshire -31 100 £67,500 +28.57% 10
Hampshire -6 75 £45,000 -18.18% 10
Surrey -4 71 £60,000 -2.04% 4
Middlesex +14 51 - -
Buckinghamshire +42 46 £44,309 -1.54% 2
Oxfordshire +6 38 £50,000 - 2
Kent -7 22 £38,000 -15.56% 2
East Sussex +28 17 £65,000 +36.84% 6
West Sussex +17 4 £70,000 +47.37% 1
Sussex - 1 £52,500 -
Oracle
England

Oracle
Co-occurring Skills and Capabilities in the South East by Category

The follow tables expand on the table above by listing co-occurrences grouped by category. The same employment type, locality and period is covered with up to 20 co-occurrences shown in each of the following categories:

Application Platforms
1 77 (18.12%) SAS
2 33 (7.76%) Camunda
2 33 (7.76%) nginx
3 20 (4.71%) WebLogic
4 8 (1.88%) JBoss
5 7 (1.65%) Oracle Workflow
6 5 (1.18%) WebSphere
7 4 (0.94%) Apache
7 4 (0.94%) Confluence
8 3 (0.71%) Oracle Service Bus
8 3 (0.71%) Oracle SOA Suite
9 2 (0.47%) IIS
9 2 (0.47%) Mule
9 2 (0.47%) Red Hat Fuse
10 1 (0.24%) CMS
10 1 (0.24%) Oracle Spatial
10 1 (0.24%) Sitecore CMS
10 1 (0.24%) WildFly
Applications
1 40 (9.41%) Microsoft Excel
2 7 (1.65%) Spreadsheet
3 6 (1.41%) Microsoft Office
4 5 (1.18%) MS Visio
5 2 (0.47%) SPSS
6 1 (0.24%) Microsoft PowerPoint
6 1 (0.24%) Microsoft Project
6 1 (0.24%) Oracle Smart View
Business Applications
1 75 (17.65%) SAP ERP
2 36 (8.47%) Siebel CRM
3 17 (4.00%) NetSuite
3 17 (4.00%) Oracle Receivables
4 14 (3.29%) Oracle Applications
5 10 (2.35%) NEC Housing
5 10 (2.35%) Oracle ERP
6 9 (2.12%) Primavera
7 7 (1.65%) Oracle EBS
7 7 (1.65%) Oracle Financials
8 4 (0.94%) Sparx Enterprise Architect
9 3 (0.71%) Oracle Assets
9 3 (0.71%) Oracle EBS R12
9 3 (0.71%) Oracle General Ledger
9 3 (0.71%) Oracle Payables
9 3 (0.71%) Remedy ITSM
10 2 (0.47%) Oracle E-Business Tax
10 2 (0.47%) SAP WM
11 1 (0.24%) Demantra
11 1 (0.24%) JDE OneWorld
Cloud Services
1 43 (10.12%) Azure
2 36 (8.47%) OpenShift
3 35 (8.24%) Power Platform
4 33 (7.76%) IBM Cloud
5 24 (5.65%) OCI
6 21 (4.94%) AWS
7 11 (2.59%) SaaS
8 10 (2.35%) Microsoft 365
9 9 (2.12%) Azure DevOps
10 7 (1.65%) Amazon EKS
11 5 (1.18%) GitHub
12 4 (0.94%) Amazon SQS
12 4 (0.94%) Serverless
13 3 (0.71%) Cloud Computing
13 3 (0.71%) Entra ID
13 3 (0.71%) Snowflake
14 2 (0.47%) AWS Lambda
14 2 (0.47%) dbt
14 2 (0.47%) GCP
14 2 (0.47%) WhatsApp
Communications & Networking
1 79 (18.59%) Broadband
2 11 (2.59%) Firewall
3 10 (2.35%) DNS
4 7 (1.65%) TCP/IP
5 6 (1.41%) DHCP
6 5 (1.18%) SAN
7 4 (0.94%) 5G
7 4 (0.94%) BGP
7 4 (0.94%) SSL
8 3 (0.71%) DMZ
8 3 (0.71%) Modbus
8 3 (0.71%) VLAN
8 3 (0.71%) VPN
8 3 (0.71%) WLAN
9 2 (0.47%) SNMP
9 2 (0.47%) SSH
10 1 (0.24%) Network Security
10 1 (0.24%) RNC
10 1 (0.24%) SGSN
10 1 (0.24%) Wireless
Database & Business Intelligence
1 82 (19.29%) Oracle Database
2 48 (11.29%) SQL Server
3 39 (9.18%) MongoDB
4 36 (8.47%) Oracle BI EE
4 36 (8.47%) Siebel EIM
5 35 (8.24%) Power BI
6 17 (4.00%) Relational Database
7 15 (3.53%) MySQL
7 15 (3.53%) OLTP
8 14 (3.29%) Data Warehouse
8 14 (3.29%) PostgreSQL
9 13 (3.06%) Oracle Reports
10 12 (2.82%) Elasticsearch
11 10 (2.35%) SQL Server Integration Services
11 10 (2.35%) SQL Server Reporting Services
12 9 (2.12%) NoSQL
13 7 (1.65%) Oracle Database 11g
14 6 (1.41%) MS Access
14 6 (1.41%) RDBMS
15 5 (1.18%) Oracle Database 12c
Development Applications
1 12 (2.82%) PowerBuilder
2 11 (2.59%) Oracle APEX
3 10 (2.35%) Git
4 9 (2.12%) Jenkins
4 9 (2.12%) Oracle Forms
5 6 (1.41%) JIRA
6 5 (1.18%) JMeter
7 4 (0.94%) JUnit
7 4 (0.94%) Selenium
8 3 (0.71%) Eclipse
8 3 (0.71%) IntelliJ
8 3 (0.71%) LoadRunner
9 2 (0.47%) Cucumber
9 2 (0.47%) SQL Server Management Studio (SSMS)
9 2 (0.47%) Visual Studio
10 1 (0.24%) Ant
10 1 (0.24%) Apache Ivy
10 1 (0.24%) Bitbucket
10 1 (0.24%) Gradle
10 1 (0.24%) Maven
General
1 182 (42.82%) Social Skills
2 138 (32.47%) Finance
3 100 (23.53%) Analytical Skills
4 45 (10.59%) Public Sector
5 40 (9.41%) Aerospace
6 35 (8.24%) Inclusion and Diversity
7 22 (5.18%) Police
8 20 (4.71%) Manufacturing
9 11 (2.59%) Presentation Skills
10 10 (2.35%) Local Government
11 9 (2.12%) Legal
12 4 (0.94%) German Language
13 3 (0.71%) Retail
14 2 (0.47%) Billing
14 2 (0.47%) Environmental Health
14 2 (0.47%) General Ledger
14 2 (0.47%) Law
14 2 (0.47%) Organisational Skills
14 2 (0.47%) Telecoms
15 1 (0.24%) Military
Job Titles
1 106 (24.94%) Senior
2 89 (20.94%) Developer
3 88 (20.71%) Architect
4 84 (19.76%) Solutions Architect
5 61 (14.35%) Senior Developer
6 52 (12.24%) Consultant
7 44 (10.35%) Analyst
8 36 (8.47%) Senior Siebel Developer
8 36 (8.47%) Siebel Developer
9 34 (8.00%) Full Stack Engineer
10 32 (7.53%) Lead
11 30 (7.06%) Oracle Developer
12 26 (6.12%) Technical Consultant
13 25 (5.88%) Senior Analyst
14 24 (5.65%) Technical Support
15 22 (5.18%) Support Consultant
15 22 (5.18%) Technical Support Consultant
16 18 (4.24%) Support Analyst
17 17 (4.00%) Applications Support
17 17 (4.00%) DBA
Libraries, Frameworks & Software Standards
1 41 (9.65%) XML
2 40 (9.41%) React
3 34 (8.00%) HTML
3 34 (8.00%) SOAP
4 33 (7.76%) KeystoneJS
4 33 (7.76%) Node.js
4 33 (7.76%) Swagger
5 26 (6.12%) Web Services
6 24 (5.65%) .NET
7 22 (5.18%) REST
8 20 (4.71%) CSS
9 19 (4.47%) Spring
10 14 (3.29%) Java EE
11 12 (2.82%) J2EE
12 11 (2.59%) JSON
13 10 (2.35%) Ruby on Rails
14 9 (2.12%) AngularJS
15 7 (1.65%) Spring Boot
16 6 (1.41%) Oracle Fusion
17 5 (1.18%) RabbitMQ
Miscellaneous
1 48 (11.29%) Enterprise Software
2 33 (7.76%) Blockchain
2 33 (7.76%) e-Learning
2 33 (7.76%) Hybrid Cloud
3 22 (5.18%) Management Information System
4 13 (3.06%) Data Structures
5 10 (2.35%) NHS
6 9 (2.12%) Product Ownership
7 8 (1.88%) Self-Motivation
8 7 (1.65%) Data Centre
9 6 (1.41%) Pricing Data
9 6 (1.41%) Public Cloud
10 5 (1.18%) Data Protection Act
11 4 (0.94%) Chip and PIN
11 4 (0.94%) EMC VNX
11 4 (0.94%) Mobile Payment
11 4 (0.94%) SCADA
12 3 (0.71%) Distributed Systems
12 3 (0.71%) Driving Licence
12 3 (0.71%) Renewable Energy
Operating Systems
1 34 (8.00%) Linux
2 30 (7.06%) Unix
3 24 (5.65%) Windows
4 10 (2.35%) Windows Server
5 9 (2.12%) VMS
6 8 (1.88%) AIX
7 7 (1.65%) Windows Server 2016
8 6 (1.41%) Windows Server 2012
8 6 (1.41%) Windows Server 2019
9 5 (1.18%) Red Hat Enterprise Linux
9 5 (1.18%) Windows 10
10 4 (0.94%) CentOS
10 4 (0.94%) Rocky
10 4 (0.94%) Solaris
10 4 (0.94%) Windows XP
11 2 (0.47%) Oracle Linux
12 1 (0.24%) Mac OS
Processes & Methodologies
1 150 (35.29%) Problem-Solving
2 142 (33.41%) ERP
3 130 (30.59%) Agile
4 88 (20.71%) Enterprise Architecture
5 85 (20.00%) Data Management
6 83 (19.53%) Roadmaps
7 82 (19.29%) Change Management
8 80 (18.82%) TOGAF
9 76 (17.88%) Strategic Roadmap
10 75 (17.65%) Performance Management
11 59 (13.88%) Customer Service
12 57 (13.41%) Actionable Insight
13 53 (12.47%) Mentoring
14 46 (10.82%) Collaborative Working
15 43 (10.12%) Coaching
16 42 (9.88%) Artificial Intelligence
17 40 (9.41%) SDLC
18 38 (8.94%) CRM
19 37 (8.71%) Migration
19 37 (8.71%) Performance Tuning
Programming Languages
1 172 (40.47%) SQL
2 86 (20.24%) Java
3 76 (17.88%) PL/SQL
4 50 (11.76%) JavaScript
5 33 (7.76%) Lua
6 20 (4.71%) Shell Script
7 19 (4.47%) C
7 19 (4.47%) C#
8 17 (4.00%) PowerShell
9 14 (3.29%) Python
10 12 (2.82%) VB.NET
11 10 (2.35%) Ruby
12 8 (1.88%) C++
13 7 (1.65%) VB
14 5 (1.18%) T-SQL
15 2 (0.47%) Go
15 2 (0.47%) Groovy
15 2 (0.47%) Perl
15 2 (0.47%) R
16 1 (0.24%) TypeScript
Qualifications
1 109 (25.65%) Security Cleared
2 79 (18.59%) SC Cleared
3 56 (13.18%) Degree
4 20 (4.71%) CIPD
5 17 (4.00%) Computer Science Degree
6 14 (3.29%) DBS Check
7 6 (1.41%) BPSS Clearance
8 5 (1.18%) DV Cleared
8 5 (1.18%) HNC
8 5 (1.18%) HND
9 4 (0.94%) AWS Certification
9 4 (0.94%) AWS Certified Solutions Architect
9 4 (0.94%) Azure Certification
9 4 (0.94%) CCNA
9 4 (0.94%) CCNP
9 4 (0.94%) Cisco Certification
9 4 (0.94%) CTC Cleared
9 4 (0.94%) Master's Degree
9 4 (0.94%) OCP
9 4 (0.94%) Oracle Certification
Quality Assurance & Compliance
1 17 (4.00%) SLA
2 12 (2.82%) QA
3 10 (2.35%) Accessibility
4 3 (0.71%) Data Quality
4 3 (0.71%) NIST
5 1 (0.24%) GDPR
System Software
1 44 (10.35%) Docker
2 14 (3.29%) Active Directory
3 8 (1.88%) VMware ESXi
4 5 (1.18%) Hyper-V
5 4 (0.94%) Oracle RAC
5 4 (0.94%) VMware Infrastructure
6 1 (0.24%) Virtual Machines
Systems Management
1 12 (2.82%) OpenSSO
1 12 (2.82%) Single Sign-On
2 10 (2.35%) Kubernetes
3 8 (1.88%) EMC NetWorker
3 8 (1.88%) Oracle RMAN
3 8 (1.88%) vCenter Server
4 7 (1.65%) SCCM
5 5 (1.18%) WSUS
6 4 (0.94%) Data Guard
6 4 (0.94%) Grafana
6 4 (0.94%) NetBackup
6 4 (0.94%) SCOM
7 3 (0.71%) Ansible
7 3 (0.71%) Nagios
7 3 (0.71%) Oracle Enterprise Manager
7 3 (0.71%) Terraform
8 2 (0.47%) Kibana
8 2 (0.47%) Prometheus
8 2 (0.47%) WMI
9 1 (0.24%) Tivoli
Vendors
1 99 (23.29%) SAP
2 77 (18.12%) Anaplan
3 76 (17.88%) Hyperion
4 42 (9.88%) Microsoft
5 36 (8.47%) Red Hat
5 36 (8.47%) Siebel
6 35 (8.24%) IBM
7 17 (4.00%) Remedy
8 14 (3.29%) Sage
9 13 (3.06%) VMware
10 12 (2.82%) Epicor
11 10 (2.35%) NEC
12 8 (1.88%) EMC
12 8 (1.88%) Veeam
13 5 (1.18%) Infor
14 4 (0.94%) 3PAR
14 4 (0.94%) Extreme Networks
14 4 (0.94%) Meraki
14 4 (0.94%) Palo Alto
14 4 (0.94%) Splunk