Retail Jobs in the South East

Retailing
England > South East

The table below looks at the prevalence of the term Retail in permanent job vacancies advertised in the South East. Included is a benchmarking guide to the salaries offered in vacancies that have cited Retail over the 6 months to 2 December 2023 with a comparison to the same period over the previous 2 years.

6 months to
2 Dec 2023
Same period 2022 Same period 2021
Rank 91 66 53
Rank change year-on-year -25 -13 +100
Permanent jobs citing Retail 234 822 1,040
As % of all permanent jobs advertised in the South East 3.04% 4.72% 5.64%
As % of the General category 4.94% 7.32% 10.19%
Number of salaries quoted 161 425 510
10th Percentile £28,500 £31,250 £25,675
25th Percentile £38,000 £41,250 £37,500
Median annual salary (50th Percentile) £52,500 £52,000 £50,000
Median % change year-on-year +0.96% +4.00% -4.76%
75th Percentile £62,500 £70,000 £63,750
90th Percentile £78,750 £85,000 £82,500
England median annual salary £57,500 £60,000 £57,500
% change year-on-year -4.17% +4.35% -

All General Skills
South East

Retail is in the General Skills category. The following table is for comparison with the above and provides summary statistics for all permanent job vacancies advertised in the South East with a requirement for common skills.

Permanent vacancies with a requirement for common skills 4,740 11,230 10,208
As % of all permanent jobs advertised in the South East 61.49% 64.51% 55.33%
Number of salaries quoted 2,877 5,817 6,098
10th Percentile £28,000 £30,000 £29,337
25th Percentile £37,250 £40,000 £38,000
Median annual salary (50th Percentile) £52,000 £55,000 £50,845
Median % change year-on-year -5.45% +8.17% +1.69%
75th Percentile £67,500 £71,250 £67,500
90th Percentile £82,200 £83,850 £80,000
England median annual salary £60,000 £60,000 £60,000
% change year-on-year - - +4.35%

Retail
Job Vacancy Trend in the South East

Job postings citing Retail as a proportion of all IT jobs advertised in the South East.
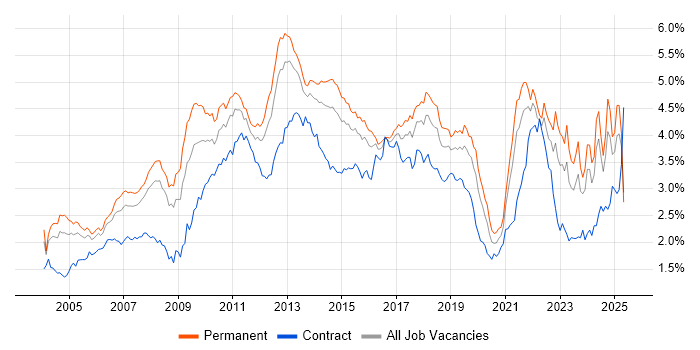
Job vacancy trend for Retail in the South East

Retail
Salary Trend in the South East

3-month moving average salary quoted in jobs citing Retail in the South East.

Salary trend for Retail in the South East

Retail
Salary Histogram in the South East

Salary distribution for jobs citing Retail in the South East over the 6 months to 2 December 2023.

Salary histogram for Retail in the South East

Retail
Job Locations in the South East

The table below looks at the demand and provides a guide to the median salaries quoted in IT jobs citing Retail within the South East region over the 6 months to 2 December 2023. The 'Rank Change' column provides an indication of the change in demand within each location based on the same 6 month period last year.

Location Rank Change
on Same Period
Last Year
Matching
Permanent
IT Job Ads
Median Salary
Past 6 Months
Median Salary
% Change
on Same Period
Last Year
Live
Jobs
Thames Valley -19 92 £50,000 -23.08% 127
Surrey +27 55 £60,000 +26.32% 49
Berkshire +2 48 £50,000 -24.53% 73
Buckinghamshire +6 39 £60,000 - 39
Hampshire -36 30 £47,000 -14.55% 32
Kent +28 27 £51,250 +12.64% 22
West Sussex -6 14 £48,750 +35.53% 20
East Sussex +24 13 £55,000 -7.60% 9
Oxfordshire +15 5 £70,000 +2.56% 15
Middlesex +18 2 - - 1
Retail
England

Retail
Co-occurring Skills and Capabilities in the South East by Category

The follow tables expand on the table above by listing co-occurrences grouped by category. The same employment type, locality and period is covered with up to 20 co-occurrences shown in each of the following categories:

Application Platforms
1 8 (3.42%) CMS
2 6 (2.56%) SharePoint
3 5 (2.14%) WordPress
4 4 (1.71%) MS Exchange
5 2 (0.85%) Adobe Experience Manager
5 2 (0.85%) Umbraco
6 1 (0.43%) Confluence
Applications
1 26 (11.11%) Microsoft Office
2 24 (10.26%) Microsoft Excel
3 5 (2.14%) Microsoft PowerPoint
4 2 (0.85%) Microsoft Project
4 2 (0.85%) Spreadsheet
5 1 (0.43%) Adobe Creative Suite
5 1 (0.43%) InDesign
5 1 (0.43%) Photoshop
Business Applications
1 6 (2.56%) Dynamics AX
2 3 (1.28%) SAP S/4HANA
3 2 (0.85%) Cognos Controller
3 2 (0.85%) Cognos Planning
3 2 (0.85%) IBM Planning Analytics
3 2 (0.85%) Sage X3
3 2 (0.85%) SAP SD
4 1 (0.43%) SAP Hybris
Cloud Services
1 52 (22.22%) Azure
2 37 (15.81%) Microsoft 365
3 23 (9.83%) AWS
4 13 (5.56%) Serverless
5 7 (2.99%) Dynamics 365
5 7 (2.99%) Entra ID
5 7 (2.99%) Power Platform
6 5 (2.14%) GitHub
6 5 (2.14%) Smartsheet
7 4 (1.71%) GCP
7 4 (1.71%) Google Analytics
8 3 (1.28%) Azure Data Factory
8 3 (1.28%) Azure DevOps
8 3 (1.28%) Contentsquare
9 2 (0.85%) Cloud Computing
9 2 (0.85%) SaaS
10 1 (0.43%) Amazon EC2
10 1 (0.43%) Amazon S3
10 1 (0.43%) AWS CloudFormation
10 1 (0.43%) SAP Commerce Cloud
Communications & Networking
1 6 (2.56%) Firewall
2 4 (1.71%) LAN
2 4 (1.71%) TCP/IP
2 4 (1.71%) VPN
2 4 (1.71%) WAN
3 3 (1.28%) BGP
3 3 (1.28%) DHCP
3 3 (1.28%) DNS
3 3 (1.28%) Ethernet
3 3 (1.28%) OSPF
4 2 (0.85%) Converged Networks
4 2 (0.85%) FTP
4 2 (0.85%) Network Security
4 2 (0.85%) SAN
4 2 (0.85%) VoIP
5 1 (0.43%) Cisco ASA
5 1 (0.43%) NGFW
5 1 (0.43%) PuTTY
5 1 (0.43%) WinSCP
5 1 (0.43%) WLAN
Database & Business Intelligence
1 11 (4.70%) NoSQL
2 7 (2.99%) Power BI
3 6 (2.56%) MySQL
3 6 (2.56%) SQL Server
4 4 (1.71%) Big Data
4 4 (1.71%) Data Lake
4 4 (1.71%) PostgreSQL
5 3 (1.28%) Data Warehouse
6 2 (0.85%) Amazon Redshift
6 2 (0.85%) RDBMS
6 2 (0.85%) Relational Database
7 1 (0.43%) Amazon Aurora
7 1 (0.43%) Amazon RDS
7 1 (0.43%) Azure SQL Database
7 1 (0.43%) MongoDB
7 1 (0.43%) SAP BW
7 1 (0.43%) SQL Server Integration Services
7 1 (0.43%) SQL Server Reporting Services
7 1 (0.43%) Tableau
Development Applications
1 10 (4.27%) Cypress.io
2 8 (3.42%) Selenium
3 7 (2.99%) JIRA
3 7 (2.99%) Postman
4 6 (2.56%) Cucumber
4 6 (2.56%) JMeter
5 5 (2.14%) SpecFlow
6 3 (1.28%) Git
7 2 (0.85%) GitLab
8 1 (0.43%) Ant
8 1 (0.43%) Apache Continuum
8 1 (0.43%) Bitbucket
8 1 (0.43%) Eclipse
8 1 (0.43%) JUnit
8 1 (0.43%) REST Assured
8 1 (0.43%) SoapUI
8 1 (0.43%) SQL Server Management Studio (SSMS)
8 1 (0.43%) Team Foundation Server
8 1 (0.43%) TestNG
8 1 (0.43%) Visual Studio
General
1 88 (37.61%) Social Skills
2 60 (25.64%) Finance
3 38 (16.24%) Analytical Skills
4 21 (8.97%) Inclusion and Diversity
4 21 (8.97%) Marketing
5 16 (6.84%) Automotive
6 13 (5.56%) Legal
7 11 (4.70%) Presentation Skills
7 11 (4.70%) Telecoms
8 10 (4.27%) Manufacturing
9 9 (3.85%) Police
10 7 (2.99%) Billing
11 6 (2.56%) Law
12 5 (2.14%) Influencing Skills
13 4 (1.71%) Advertising
14 3 (1.28%) Digital Economy
14 3 (1.28%) Electronics
14 3 (1.28%) Games
14 3 (1.28%) Public Sector
14 3 (1.28%) Wearables
Job Titles
1 42 (17.95%) Analyst
2 32 (13.68%) Senior
3 30 (12.82%) IT Engineer
3 30 (12.82%) Support Engineer
4 27 (11.54%) IT Support
4 27 (11.54%) IT Support Engineer
4 27 (11.54%) Junior
5 23 (9.83%) Junior IT Engineer
5 23 (9.83%) Junior IT Support
5 23 (9.83%) Junior Support Engineer
6 16 (6.84%) Consultant
7 14 (5.98%) Service Analyst
7 14 (5.98%) Service Desk Analyst
8 13 (5.56%) Developer
8 13 (5.56%) Project Manager
9 12 (5.13%) Business Analyst
10 10 (4.27%) Python Engineer
11 9 (3.85%) Architect
12 8 (3.42%) Delivery Manager
12 8 (3.42%) Digital Business Analyst
Libraries, Frameworks & Software Standards
1 12 (5.13%) CSS
1 12 (5.13%) HTML
2 11 (4.70%) Playwright
3 10 (4.27%) Django
4 9 (3.85%) Web Services
5 6 (2.56%) .NET
5 6 (2.56%) jQuery
6 5 (2.14%) CSS3
6 5 (2.14%) HTML5
7 2 (0.85%) AngularJS
7 2 (0.85%) EDI
7 2 (0.85%) Elastic Stack
7 2 (0.85%) hapi
7 2 (0.85%) IDoc
7 2 (0.85%) JSON
7 2 (0.85%) Node.js
7 2 (0.85%) RESTful
7 2 (0.85%) SAP ALE
7 2 (0.85%) SAP Fiori
7 2 (0.85%) XML
Miscellaneous
1 13 (5.56%) Management Information System
1 13 (5.56%) Self-Motivation
2 12 (5.13%) Product Ownership
3 8 (3.42%) FMCG
3 8 (3.42%) IoT
4 7 (2.99%) EPoS
5 6 (2.56%) Hybrid Cloud
5 6 (2.56%) NHS
6 5 (2.14%) Smart Meter
7 4 (1.71%) Data Centre
7 4 (1.71%) Enterprise Software
8 3 (1.28%) Driving Licence
8 3 (1.28%) Greenfield Project
8 3 (1.28%) Security Operations Centre
9 2 (0.85%) CCTV
9 2 (0.85%) Data Protection Act
9 2 (0.85%) IPTV
9 2 (0.85%) Mobile App
9 2 (0.85%) Multi-touch
9 2 (0.85%) Social Media
Operating Systems
1 39 (16.67%) Windows
2 25 (10.68%) Android
3 7 (2.99%) Linux
4 5 (2.14%) Windows Server
5 3 (1.28%) Windows 10
6 2 (0.85%) Debian
7 1 (0.43%) Apple iOS
7 1 (0.43%) Windows 7
7 1 (0.43%) Windows Server 2016
7 1 (0.43%) Windows Server 2019
Processes & Methodologies
1 49 (20.94%) Customer Service
2 37 (15.81%) Problem-Solving
3 35 (14.96%) Project Management
4 32 (13.68%) E-Commerce
5 26 (11.11%) Agile
6 23 (9.83%) Statistical Analysis
7 21 (8.97%) Stakeholder Management
8 18 (7.69%) Collaborative Working
9 16 (6.84%) Microservices
10 15 (6.41%) ERP
10 15 (6.41%) Project Delivery
10 15 (6.41%) User Experience
11 14 (5.98%) DevOps
12 13 (5.56%) Business Case
12 13 (5.56%) Coaching
12 13 (5.56%) ITIL
12 13 (5.56%) Line Management
12 13 (5.56%) Logistics
13 12 (5.13%) Incident Management
13 12 (5.13%) Risk Management
Programming Languages
1 24 (10.26%) JavaScript
2 20 (8.55%) SQL
3 13 (5.56%) C#
4 12 (5.13%) Python
5 10 (4.27%) Java
6 4 (1.71%) PHP
7 1 (0.43%) Bash
7 1 (0.43%) C
7 1 (0.43%) C++
7 1 (0.43%) Data Analysis Expressions
7 1 (0.43%) Kusto Query Language
7 1 (0.43%) PowerShell
7 1 (0.43%) Ruby
7 1 (0.43%) VBScript
Qualifications
1 32 (13.68%) DBS Check
2 16 (6.84%) Degree
3 7 (2.99%) Security Cleared
4 6 (2.56%) SC Cleared
5 4 (1.71%) PRINCE2 Certification
6 3 (1.28%) CCNA
6 3 (1.28%) Cisco Certification
6 3 (1.28%) VMware Certified Professional (VCP)
7 2 (0.85%) ACCA
7 2 (0.85%) CIMA
7 2 (0.85%) CISSP
7 2 (0.85%) GIAC
7 2 (0.85%) PRINCE2 Practitioner
7 2 (0.85%) SANS
8 1 (0.43%) BPSS Clearance
8 1 (0.43%) Computer Science Degree
8 1 (0.43%) DV Cleared
8 1 (0.43%) ISTQB
8 1 (0.43%) ISTQB Advanced Certification
8 1 (0.43%) ISTQB Foundation Certification
Quality Assurance & Compliance
1 7 (2.99%) Accessibility
2 4 (1.71%) GDPR
2 4 (1.71%) QA
2 4 (1.71%) SLA
3 3 (1.28%) PMO
4 2 (0.85%) ISO/IEC 27001
4 2 (0.85%) NEBOSH
4 2 (0.85%) NIST
4 2 (0.85%) PCI DSS
5 1 (0.43%) COSHH
System Software
1 14 (5.98%) Active Directory
2 5 (2.14%) Docker
3 4 (1.71%) VMware Infrastructure
4 2 (0.85%) Firmware
5 1 (0.43%) Virtual Machines
Systems Management
1 6 (2.56%) Kubernetes
2 5 (2.14%) Terraform
3 4 (1.71%) Microsoft Intune
4 3 (1.28%) Ansible
5 1 (0.43%) CSIRT
5 1 (0.43%) FortiGate
5 1 (0.43%) SCCM
Vendors
1 54 (23.08%) Microsoft
2 6 (2.56%) Cisco
2 6 (2.56%) Google
3 5 (2.14%) Adobe
3 5 (2.14%) SAP
4 4 (1.71%) Oracle
4 4 (1.71%) VMware
5 3 (1.28%) Apple
6 2 (0.85%) Cognos
6 2 (0.85%) Sage
6 2 (0.85%) Salesforce
6 2 (0.85%) SolarWinds
6 2 (0.85%) Veeam
7 1 (0.43%) Facebook
7 1 (0.43%) Meraki
7 1 (0.43%) MuleSoft
7 1 (0.43%) Palo Alto
7 1 (0.43%) ServiceNow
7 1 (0.43%) Spiceworks
7 1 (0.43%) Twitter