VMware Infrastructure Jobs in the South East

VMware Infrastructure (VI3)
England > South East

The table below provides summary statistics for permanent job vacancies advertised in the South East requiring VMware Infrastructure skills. It includes a benchmarking guide to the annual salaries offered in vacancies that cited VMware Infrastructure over the 6 months leading up to 26 July 2024, comparing them to the same period in the previous two years.

6 months to
26 Jul 2024
Same period 2023 Same period 2022
Rank 115 98 152
Rank change year-on-year -17 +54 -64
Permanent jobs citing VMware Infrastructure 338 371 544
As % of all permanent jobs advertised in the South East 2.24% 3.20% 2.47%
As % of the System Software category 17.69% 18.37% 15.03%
Number of salaries quoted 288 240 397
10th Percentile £32,500 £31,250 £31,250
25th Percentile £37,500 £37,500 £36,250
Median annual salary (50th Percentile) £47,500 £47,500 £46,500
Median % change year-on-year - +2.15% +3.33%
75th Percentile £55,750 £60,000 £55,000
90th Percentile £62,500 £67,625 £70,000
England median annual salary £47,250 £51,000 £50,000
% change year-on-year -7.35% +2.00% +5.26%

All System Software Skills
South East

VMware Infrastructure falls under the System Software category. For comparison with the information above, the following table provides summary statistics for all permanent job vacancies requiring system software skills in the South East.

Permanent vacancies with a requirement for system software skills 1,911 2,020 3,620
As % of all permanent jobs advertised in the South East 12.66% 17.43% 16.41%
Number of salaries quoted 1,458 1,475 2,423
10th Percentile £27,000 £26,250 £27,500
25th Percentile £35,000 £31,734 £36,000
Median annual salary (50th Percentile) £50,000 £49,750 £50,000
Median % change year-on-year +0.50% -0.50% -4.76%
75th Percentile £63,750 £67,500 £72,500
90th Percentile £78,750 £80,000 £85,000
England median annual salary £50,000 £55,000 £55,000
% change year-on-year -9.09% - -4.35%

VMware Infrastructure
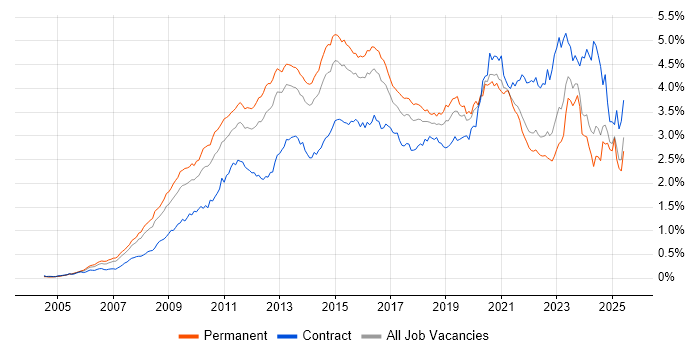
Job Vacancy Trend in the South East

Job postings citing VMware Infrastructure as a proportion of all IT jobs advertised in the South East.

Job vacancy trend for VMware Infrastructure in the South East

VMware Infrastructure
Salary Trend in the South East

3-month moving average salary quoted in jobs citing VMware Infrastructure in the South East.

Salary trend for VMware Infrastructure in the South East

VMware Infrastructure
Salary Histogram in the South East

Salary distribution for jobs citing VMware Infrastructure in the South East over the 6 months to 26 July 2024.

Salary histogram for VMware Infrastructure in the South East

VMware Infrastructure
Job Locations in the South East

The table below looks at the demand and provides a guide to the median salaries quoted in IT jobs citing VMware Infrastructure within the South East region over the 6 months to 26 July 2024. The 'Rank Change' column provides an indication of the change in demand within each location based on the same 6 month period last year.

Location Rank Change
on Same Period
Last Year
Matching
Permanent
IT Job Ads
Median Salary
Past 6 Months
Median Salary
% Change
on Same Period
Last Year
Live
Jobs
Hampshire -9 123 £48,125 -1.28% 18
Thames Valley +3 115 £42,500 -5.56% 19
Surrey -1 65 £47,500 - 3
Oxfordshire +10 51 £42,000 -1.18% 2
Berkshire -24 48 £52,550 +7.57% 8
East Sussex +21 17 £50,000 -23.08% 3
Buckinghamshire -3 16 £55,000 +14.58% 9
Kent -34 14 £39,000 -22.00% 5
Middlesex - 6 £35,000 - 1
West Sussex +4 4 £46,250 +14.91% 2
VMware Infrastructure
England

VMware Infrastructure
Co-occurring Skills and Capabilities in the South East by Category

The follow tables expand on the table above by listing co-occurrences grouped by category. The same employment type, locality and period is covered with up to 20 co-occurrences shown in each of the following categories:

Application Platforms
1 83 (24.56%) Microsoft Exchange
2 48 (14.20%) SharePoint
3 8 (2.37%) IIS
4 6 (1.78%) Exchange Server 2013
5 5 (1.48%) Apache
5 5 (1.48%) OpenStack
6 4 (1.18%) Confluence
6 4 (1.18%) Exchange Server 2010
7 3 (0.89%) nginx
8 2 (0.59%) SAS
8 2 (0.59%) SharePoint Server
Applications
1 40 (11.83%) Microsoft Office
2 21 (6.21%) Microsoft Excel
3 8 (2.37%) MS Visio
4 3 (0.89%) Microsoft PowerPoint
5 1 (0.30%) Spreadsheet
Cloud Services
1 152 (44.97%) Microsoft 365
2 129 (38.17%) Azure
3 25 (7.40%) OneDrive
4 23 (6.80%) AWS
5 22 (6.51%) Entra ID
6 20 (5.92%) SaaS
7 16 (4.73%) IaaS
8 15 (4.44%) Nutanix
9 8 (2.37%) Power Platform
10 5 (1.48%) Amazon S3
10 5 (1.48%) Mimecast
11 4 (1.18%) Azure Monitor
11 4 (1.18%) Cloudflare
11 4 (1.18%) GCP
11 4 (1.18%) OCI
11 4 (1.18%) PaaS
12 3 (0.89%) Azure Data Factory
12 3 (0.89%) Azure Table
12 3 (0.89%) Power Automate
12 3 (0.89%) PowerApps
Communications & Networking
1 109 (32.25%) Firewall
2 44 (13.02%) DNS
3 37 (10.95%) WAN
4 35 (10.36%) LAN
5 34 (10.06%) SAN
6 29 (8.58%) Internet
7 28 (8.28%) DHCP
7 28 (8.28%) Wi-Fi
8 25 (7.40%) VPN
9 23 (6.80%) NAS
10 20 (5.92%) TCP/IP
11 15 (4.44%) SNMP
12 13 (3.85%) VLAN
12 13 (3.85%) Wireless
13 12 (3.55%) VoIP
14 10 (2.96%) iSCSI
14 10 (2.96%) Unified Communications
15 5 (1.48%) BGP
15 5 (1.48%) IPsec
15 5 (1.48%) OSPF
Database & Business Intelligence
1 56 (16.57%) SQL Server
2 13 (3.85%) MySQL
3 9 (2.66%) MariaDB
4 6 (1.78%) Power BI
5 5 (1.48%) Elasticsearch
5 5 (1.48%) InfluxDB
5 5 (1.48%) MongoDB
5 5 (1.48%) PostgreSQL
6 4 (1.18%) Amazon RDS
6 4 (1.18%) Relational Database
Development Applications
1 19 (5.62%) MSI
2 13 (3.85%) AdminStudio
2 13 (3.85%) InstallShield
3 11 (3.25%) Visual Studio
4 9 (2.66%) Git
5 8 (2.37%) Jenkins
6 6 (1.78%) Robot Framework
6 6 (1.78%) Sonatype Nexus
7 4 (1.18%) Bitbucket
7 4 (1.18%) JIRA
8 3 (0.89%) GitLab
9 1 (0.30%) Hudson
9 1 (0.30%) Team Foundation Server
General
1 96 (28.40%) Social Skills
2 65 (19.23%) Finance
3 31 (9.17%) Organisational Skills
4 24 (7.10%) Analytical Skills
5 22 (6.51%) Documentation Skills
6 17 (5.03%) Presentation Skills
7 16 (4.73%) Law
8 9 (2.66%) Legal
9 4 (1.18%) Inclusion and Diversity
10 3 (0.89%) Local Government
10 3 (0.89%) Manufacturing
11 2 (0.59%) Military
11 2 (0.59%) Pharmaceutical
11 2 (0.59%) Telecoms
12 1 (0.30%) Advertising
12 1 (0.30%) Games
12 1 (0.30%) Marketing
Job Titles
1 105 (31.07%) Infrastructure Engineer
2 79 (23.37%) Support Engineer
3 51 (15.09%) IT Engineer
4 41 (12.13%) 3rd Line Support
5 38 (11.24%) Senior
6 37 (10.95%) 3rd Line Engineer
7 35 (10.36%) IT Support
8 32 (9.47%) 3rd Line Support Engineer
9 30 (8.88%) Infrastructure Support
9 30 (8.88%) IT Support Engineer
10 28 (8.28%) Infrastructure Support Engineer
11 21 (6.21%) 2nd Line Support
11 21 (6.21%) IT Infrastructure Engineer
12 18 (5.33%) 2nd Line Engineer
12 18 (5.33%) Senior Infrastructure Engineer
13 17 (5.03%) Administrator
14 16 (4.73%) VMware Engineer
14 16 (4.73%) VMware Infrastructure Engineer
15 15 (4.44%) VMware Support Engineer
16 13 (3.85%) 2nd Line Support Engineer
Libraries, Frameworks & Software Standards
1 13 (3.85%) .NET
2 5 (1.48%) RabbitMQ
2 5 (1.48%) YAML
3 4 (1.18%) ASP.NET
3 4 (1.18%) CSS
3 4 (1.18%) HTML
3 4 (1.18%) jQuery
3 4 (1.18%) WPF
4 1 (0.30%) ASP.NET MVC 5
4 1 (0.30%) CSS3
4 1 (0.30%) LDAP
4 1 (0.30%) LESS
4 1 (0.30%) React
4 1 (0.30%) Twitter Bootstrap
Miscellaneous
1 28 (8.28%) Data Centre
1 28 (8.28%) PKI
2 23 (6.80%) Clustering
3 21 (6.21%) Management Information System
3 21 (6.21%) Self-Motivation
4 19 (5.62%) Replication
5 13 (3.85%) Shadow IT
6 11 (3.25%) Blackberry
6 11 (3.25%) BYOD
6 11 (3.25%) IoT
7 10 (2.96%) Video Conferencing
8 8 (2.37%) PMI
9 7 (2.07%) Data Protection Act
10 6 (1.78%) Raspberry Pi
11 5 (1.48%) Driving Licence
12 4 (1.18%) Enterprise Software
12 4 (1.18%) Hybrid Cloud
12 4 (1.18%) NHS
13 3 (0.89%) Arduino
13 3 (0.89%) Private Cloud
Operating Systems
1 264 (78.11%) Windows
2 151 (44.67%) Windows Server
3 78 (23.08%) Linux
4 65 (19.23%) Windows 10
5 58 (17.16%) Windows Server 2016
6 52 (15.38%) Windows Server 2012
7 45 (13.31%) Windows Server 2019
8 42 (12.43%) Windows 7
9 22 (6.51%) Ubuntu
10 19 (5.62%) CentOS
11 16 (4.73%) Windows 8
12 8 (2.37%) Apple iOS
13 6 (1.78%) Windows XP
14 5 (1.48%) Data ONTAP
14 5 (1.48%) Red Hat Enterprise Linux
15 4 (1.18%) Android
15 4 (1.18%) Debian
15 4 (1.18%) Mac OS
15 4 (1.18%) Windows Server 2008
16 3 (0.89%) VxWorks
Processes & Methodologies
1 119 (35.21%) Infrastructure Engineering
2 92 (27.22%) ITIL
3 85 (25.15%) Problem-Solving
4 51 (15.09%) Cybersecurity
5 48 (14.20%) Customer Service
6 44 (13.02%) Agile
7 42 (12.43%) Project Management
8 33 (9.76%) Change Control
8 33 (9.76%) Change Management
9 31 (9.17%) Problem Management
10 28 (8.28%) Disaster Recovery
11 26 (7.69%) Kalman Filter
12 23 (6.80%) Antivirus Management
12 23 (6.80%) Decision-Making
12 23 (6.80%) Storage Management
13 22 (6.51%) Service Management
14 21 (6.21%) Capacity Planning
15 20 (5.92%) Customer Requirements
15 20 (5.92%) Migration
16 19 (5.62%) Technical Leadership
Programming Languages
1 94 (27.81%) PowerShell
2 50 (14.79%) SQL
3 31 (9.17%) Python
4 30 (8.88%) VB
5 26 (7.69%) C#
6 19 (5.62%) Bash
7 17 (5.03%) ActionScript
8 16 (4.73%) Perl
9 7 (2.07%) VB.NET
10 5 (1.48%) Java
11 4 (1.18%) C
11 4 (1.18%) C++
11 4 (1.18%) JavaScript
12 1 (0.30%) T-SQL
Qualifications
1 88 (26.04%) Degree
2 86 (25.44%) Security Cleared
3 55 (16.27%) DV Cleared
4 52 (15.38%) SC Cleared
5 24 (7.10%) Microsoft Certification
6 17 (5.03%) Cisco Certification
7 16 (4.73%) CCNA
8 11 (3.25%) HNC
8 11 (3.25%) HND
9 8 (2.37%) CCNP
9 8 (2.37%) PMI Certification
10 7 (2.07%) DBS Check
11 6 (1.78%) VMware Certified Professional (VCP)
12 5 (1.48%) MCSE
13 4 (1.18%) Computer Science Degree
14 3 (0.89%) MCSA
14 3 (0.89%) Network+ Certification
15 2 (0.59%) A+ Certification
15 2 (0.59%) CISSP
15 2 (0.59%) MCP
Quality Assurance & Compliance
1 38 (11.24%) SLA
2 11 (3.25%) Data Quality
3 6 (1.78%) Cyber Essentials
3 6 (1.78%) GDPR
4 4 (1.18%) ISO/IEC 27001
5 3 (0.89%) Cyber Essentials PLUS
6 2 (0.59%) HIPAA
6 2 (0.59%) PCI DSS
7 1 (0.30%) ISO 9001
7 1 (0.30%) NIST
7 1 (0.30%) QA
System Software
1 224 (66.27%) Active Directory
2 94 (27.81%) Hyper-V
3 49 (14.50%) vSphere
4 37 (10.95%) VMware ESXi
5 31 (9.17%) XenApp
6 19 (5.62%) Virtual Machines
7 17 (5.03%) OpenSSH
8 16 (4.73%) VirtualBox
9 15 (4.44%) Docker
10 14 (4.14%) XenDesktop
11 13 (3.85%) Microsoft App-V
11 13 (3.85%) Virtual Desktop
12 11 (3.25%) Firmware
13 5 (1.48%) Citrix Hypervisor
13 5 (1.48%) pfSense
13 5 (1.48%) Virtual Servers
14 4 (1.18%) KVM
14 4 (1.18%) NFS
14 4 (1.18%) VMware NSX
15 2 (0.59%) Xen
Systems Management
1 59 (17.46%) vCenter Server
2 44 (13.02%) SCCM
3 26 (7.69%) Kubernetes
4 23 (6.80%) WSUS
5 18 (5.33%) Ansible
5 18 (5.33%) Microsoft Intune
6 17 (5.03%) IBM BigFix
6 17 (5.03%) PowerCLI
6 17 (5.03%) Terraform
7 6 (1.78%) Nessus
7 6 (1.78%) NetBackup
7 6 (1.78%) WMI
8 5 (1.48%) Prometheus
8 5 (1.48%) Puppet
8 5 (1.48%) Red Hat Spacewalk
8 5 (1.48%) SCOM
9 4 (1.18%) EMC NetWorker
10 2 (0.59%) Dell DRAC
10 2 (0.59%) SmoothWall
11 1 (0.30%) Network Intrusion Detection System
Vendors
1 338 (100.00%) VMware
2 195 (57.69%) Microsoft
3 71 (21.01%) Citrix
4 59 (17.46%) Veeam
5 37 (10.95%) Cisco
6 24 (7.10%) Red Hat
7 18 (5.33%) Fortinet
8 17 (5.03%) IBM
8 17 (5.03%) Palo Alto
9 15 (4.44%) Dell
9 15 (4.44%) HP
9 15 (4.44%) Juniper
9 15 (4.44%) Mitel
10 13 (3.85%) Autodesk
10 13 (3.85%) ServiceNow
11 12 (3.55%) NetApp
12 11 (3.25%) McAfee
13 9 (2.66%) Aruba
14 8 (2.37%) CheckPoint
15 7 (2.07%) BT