Stakeholder Management Jobs in the South East

Stakeholder Management
England > South East

The table below provides summary statistics for permanent job vacancies advertised in the South East requiring Stakeholder Management skills. It includes a benchmarking guide to the annual salaries offered in vacancies that cited Stakeholder Management over the 6 months leading up to 13 May 2025, comparing them to the same period in the previous two years.

6 months to
13 May 2025
Same period 2024 Same period 2023
Rank 51 101 50
Rank change year-on-year +50 -51 +4
Permanent jobs citing Stakeholder Management 435 458 809
As % of all permanent jobs advertised in the South East 4.62% 2.72% 5.57%
As % of the Processes & Methodologies category 5.03% 3.22% 5.89%
Number of salaries quoted 154 305 432
10th Percentile £41,433 £37,695 £43,075
25th Percentile £51,993 £46,250 £52,065
Median annual salary (50th Percentile) £62,500 £57,500 £62,500
Median % change year-on-year +8.70% -8.00% +4.17%
75th Percentile £77,500 £72,500 £84,750
90th Percentile £88,375 £86,500 £95,000
England median annual salary £62,500 £62,500 £65,000
% change year-on-year - -3.85% +4.00%

All Process and Methodology Skills
South East

Stakeholder Management falls under the Processes and Methodologies category. For comparison with the information above, the following table provides summary statistics for all permanent job vacancies requiring process or methodology skills in the South East.

Permanent vacancies with a requirement for process or methodology skills 8,645 14,205 13,734
As % of all permanent jobs advertised in the South East 91.79% 84.51% 94.52%
Number of salaries quoted 4,288 9,899 8,009
10th Percentile £29,750 £27,500 £30,500
25th Percentile £41,250 £36,250 £41,250
Median annual salary (50th Percentile) £56,837 £50,000 £55,000
Median % change year-on-year +13.67% -9.09% -
75th Percentile £70,000 £65,000 £72,500
90th Percentile £80,000 £77,500 £86,250
England median annual salary £57,500 £55,000 £62,500
% change year-on-year +4.55% -12.00% +4.17%

Stakeholder Management
Job Vacancy Trend in the South East

Job postings citing Stakeholder Management as a proportion of all IT jobs advertised in the South East.
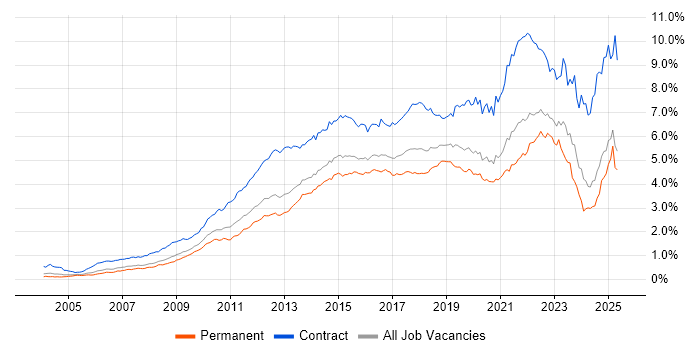
Job vacancy trend for Stakeholder Management in the South East

Stakeholder Management
Salary Trend in the South East

3-month moving average salary quoted in jobs citing Stakeholder Management in the South East.

Salary trend for Stakeholder Management in the South East

Stakeholder Management
Salary Histogram in the South East

Salary distribution for jobs citing Stakeholder Management in the South East over the 6 months to 13 May 2025.

Salary histogram for Stakeholder Management in the South East

Stakeholder Management
Job Locations in the South East

The table below looks at the demand and provides a guide to the median salaries quoted in IT jobs citing Stakeholder Management within the South East region over the 6 months to 13 May 2025. The 'Rank Change' column provides an indication of the change in demand within each location based on the same 6 month period last year.

Location Rank Change
on Same Period
Last Year
Matching
Permanent
IT Job Ads
Median Salary
Past 6 Months
Median Salary
% Change
on Same Period
Last Year
Live
Jobs
Thames Valley +48 236 £67,250 +24.54% 127
Berkshire +50 201 £60,000 +11.58% 69
Hampshire +76 63 £63,750 +6.25% 71
Surrey -13 34 £52,500 -19.23% 59
Middlesex - 26 - - 5
Kent +21 22 £53,215 -14.51% 21
West Sussex +35 21 £70,000 +27.27% 21
Oxfordshire +14 18 £65,000 +18.18% 43
Buckinghamshire -13 17 £73,833 +36.73% 29
Isle of Wight - 17 - -
East Sussex +30 15 £59,250 -12.22% 14
Sussex +10 1 - - 13
Stakeholder Management
England

Stakeholder Management
Co-occurring Skills and Capabilities in the South East by Category

The follow tables expand on the table above by listing co-occurrences grouped by category. The same employment type, locality and period is covered with up to 20 co-occurrences shown in each of the following categories:

Application Platforms
1 27 (6.21%) SharePoint
2 3 (0.69%) Confluence
3 2 (0.46%) Apache Spark
3 2 (0.46%) ThingWorx
4 1 (0.23%) BizTalk Server
4 1 (0.23%) Microsoft Exchange
4 1 (0.23%) Oracle Workflow
Applications
1 15 (3.45%) Microsoft Excel
2 12 (2.76%) Microsoft Office
3 10 (2.30%) Microsoft Project
4 7 (1.61%) Microsoft PowerPoint
5 3 (0.69%) Productboard
6 2 (0.46%) MS Visio
7 1 (0.23%) Notion
7 1 (0.23%) Trello
Business Applications
1 16 (3.68%) OpenText VIM for SAP
1 16 (3.68%) SAP FI
2 8 (1.84%) Dynamics CRM
3 7 (1.61%) Oracle ERP
4 2 (0.46%) SAP S/4HANA
5 1 (0.23%) Dynamics AX
5 1 (0.23%) Oracle EBS
5 1 (0.23%) Oracle EBS R12
5 1 (0.23%) Oracle Financials
Cloud Services
1 76 (17.47%) Azure
2 43 (9.89%) Power Platform
3 34 (7.82%) AWS
4 29 (6.67%) Power Automate
4 29 (6.67%) PowerApps
5 27 (6.21%) GCP
6 24 (5.52%) Snowflake
7 22 (5.06%) Salesforce Sales Cloud
8 10 (2.30%) SaaS
9 7 (1.61%) Dynamics 365
10 6 (1.38%) Azure DevOps
10 6 (1.38%) Microsoft 365
11 5 (1.15%) Smartsheet
12 4 (0.92%) Azure Data Factory
13 2 (0.46%) Amazon EC2
13 2 (0.46%) Amazon S3
13 2 (0.46%) Amazon SQS
13 2 (0.46%) Asana
13 2 (0.46%) GitHub Actions
13 2 (0.46%) Microsoft Purview
Communications & Networking
1 3 (0.69%) Network Security
2 2 (0.46%) DNS
2 2 (0.46%) Firewall
2 2 (0.46%) iSCSI
2 2 (0.46%) MPLS
2 2 (0.46%) SAN
2 2 (0.46%) VPN
3 1 (0.23%) Broadband
3 1 (0.23%) DHCP
3 1 (0.23%) Ethernet
3 1 (0.23%) Fibre Channel
3 1 (0.23%) Internet
3 1 (0.23%) Intrusion Detection
3 1 (0.23%) LAN
3 1 (0.23%) NAS
3 1 (0.23%) Remote Desktop
3 1 (0.23%) VSAN
3 1 (0.23%) WAN
3 1 (0.23%) Wi-Fi
Database & Business Intelligence
1 52 (11.95%) Data Lake
2 42 (9.66%) Power BI
3 29 (6.67%) Big Data
4 28 (6.44%) Data Warehouse
4 28 (6.44%) Tableau
5 24 (5.52%) Metadata
6 6 (1.38%) SQL Server Integration Services
7 5 (1.15%) Azure SQL Database
7 5 (1.15%) Oracle Reports
7 5 (1.15%) SQL Server Reporting Services
8 3 (0.69%) Hadoop
9 2 (0.46%) Amazon Aurora
9 2 (0.46%) Amazon RDS
9 2 (0.46%) MongoDB
9 2 (0.46%) NoSQL
9 2 (0.46%) PostgreSQL
9 2 (0.46%) SQL Server
10 1 (0.23%) DynamoDB
10 1 (0.23%) Oracle BI Publisher
Development Applications
1 44 (10.11%) Rational DOORS
2 7 (1.61%) JIRA
3 3 (0.69%) Jenkins
4 2 (0.46%) Git
4 2 (0.46%) JUnit
4 2 (0.46%) Maven
4 2 (0.46%) Mockito
4 2 (0.46%) SonarQube
5 1 (0.23%) Bitbucket Server
5 1 (0.23%) Burp Suite
5 1 (0.23%) DbUnit
5 1 (0.23%) jMock
5 1 (0.23%) Metasploit
5 1 (0.23%) Oracle Forms
5 1 (0.23%) SQL Server Management Studio (SSMS)
General
1 168 (38.62%) Social Skills
2 158 (36.32%) Law
3 79 (18.16%) Finance
4 61 (14.02%) Legal
5 46 (10.57%) Analytical Skills
6 25 (5.75%) Influencing Skills
7 24 (5.52%) Marketing
8 18 (4.14%) Public Sector
9 15 (3.45%) Retail
10 13 (2.99%) Manufacturing
11 11 (2.53%) Local Government
11 11 (2.53%) Organisational Skills
12 8 (1.84%) Presentation Skills
13 7 (1.61%) Social Housing
14 5 (1.15%) Military
14 5 (1.15%) Telecoms
15 4 (0.92%) Automotive
15 4 (0.92%) Billing
16 3 (0.69%) Advertising
16 3 (0.69%) Aviation
Job Titles
1 114 (26.21%) Lead
2 74 (17.01%) Senior
3 46 (10.57%) Engineering Manager
4 44 (10.11%) Requirements Manager
5 41 (9.43%) Analyst
6 34 (7.82%) Project Manager
7 32 (7.36%) Architect
8 23 (5.29%) Enterprise Architect
9 22 (5.06%) Salesforce Architect
10 21 (4.83%) IT Manager
11 20 (4.60%) Senior Analyst
12 17 (3.91%) Financial Analyst
13 16 (3.68%) IT Analyst
13 16 (3.68%) Senior Financial Analyst
13 16 (3.68%) Service Analyst
14 12 (2.76%) Security Analyst
15 10 (2.30%) Programme Manager
15 10 (2.30%) Senior Manager
15 10 (2.30%) Systems Engineer
16 7 (1.61%) Developer
Libraries, Frameworks & Software Standards
1 24 (5.52%) REST
2 23 (5.29%) SOAP
3 22 (5.06%) Lightning Web Components
3 22 (5.06%) Middleware
4 4 (0.92%) Kafka
4 4 (0.92%) XML
5 3 (0.69%) Oracle Fusion
5 3 (0.69%) Spring
5 3 (0.69%) Spring Boot
5 3 (0.69%) Web Services
6 2 (0.46%) ActiveMQ
6 2 (0.46%) AngularJS
6 2 (0.46%) Bootstrap
6 2 (0.46%) FHIR
6 2 (0.46%) JPA
6 2 (0.46%) Spring Cloud
7 1 (0.23%) Android Jetpack
7 1 (0.23%) Jetpack Compose
7 1 (0.23%) RESTful
7 1 (0.23%) SwiftUI
Miscellaneous
1 35 (8.05%) Management Information System
2 27 (6.21%) Enterprise Software
3 10 (2.30%) Product Ownership
3 10 (2.30%) Security Posture
3 10 (2.30%) Self-Motivation
4 9 (2.07%) Analytical Mindset
5 8 (1.84%) Cloud Native
5 8 (1.84%) Data Centre
5 8 (1.84%) Onboarding
6 7 (1.61%) Data Protection Act
6 7 (1.61%) Housing Association
7 5 (1.15%) Cloud Security Posture
7 5 (1.15%) Cyber Security Posture
7 5 (1.15%) FMCG
7 5 (1.15%) PMI
8 4 (0.92%) CMDB
8 4 (0.92%) Legacy Systems
8 4 (0.92%) Operational Technology
8 4 (0.92%) Virtual Team
9 3 (0.69%) Renewable Energy
Operating Systems
1 8 (1.84%) Windows
2 3 (0.69%) Linux
3 2 (0.46%) Mac OS
4 1 (0.23%) Android
4 1 (0.23%) Apple iOS
4 1 (0.23%) CentOS
4 1 (0.23%) Kali Linux
4 1 (0.23%) Red Hat Enterprise Linux
4 1 (0.23%) VMS
4 1 (0.23%) Windows Server
Processes & Methodologies
1 127 (29.20%) Project Management
2 123 (28.28%) Continuous Improvement
3 114 (26.21%) Agile
4 86 (19.77%) Data Management
5 83 (19.08%) Computer Science
6 82 (18.85%) Validation
7 80 (18.39%) Mentoring
8 77 (17.70%) Analytics
9 76 (17.47%) Project Delivery
10 72 (16.55%) Problem-Solving
11 63 (14.48%) Business Strategy
11 63 (14.48%) Data Governance
12 61 (14.02%) Information Security
13 58 (13.33%) Strategic Thinking
14 56 (12.87%) Risk Management
15 55 (12.64%) Data Engineering
15 55 (12.64%) Data Modelling
15 55 (12.64%) Requirements Management
15 55 (12.64%) Systems Engineering
16 53 (12.18%) Verification and Validation
Programming Languages
1 40 (9.20%) SQL
2 30 (6.90%) Python
3 22 (5.06%) Apex Code
4 9 (2.07%) R
5 4 (0.92%) C#
5 4 (0.92%) T-SQL
6 3 (0.69%) Data Analysis Expressions
6 3 (0.69%) Java
6 3 (0.69%) PowerShell
6 3 (0.69%) VBA
7 1 (0.23%) Delphi
7 1 (0.23%) JavaScript
7 1 (0.23%) PL/SQL
7 1 (0.23%) Swift
7 1 (0.23%) TypeScript
7 1 (0.23%) VBScript
Qualifications
1 151 (34.71%) Degree
2 53 (12.18%) BPSS Clearance
3 38 (8.74%) Computer Science Degree
4 37 (8.51%) Master's Degree
5 29 (6.67%) CISSP
6 23 (5.29%) PMP
7 22 (5.06%) CISM
8 21 (4.83%) CRISC
9 20 (4.60%) PMI Certification
10 18 (4.14%) Security Cleared
11 14 (3.22%) SC Cleared
12 9 (2.07%) HNC
13 8 (1.84%) Azure Certification
13 8 (1.84%) Microsoft Certification
14 7 (1.61%) MRICS
15 6 (1.38%) ITIL Certification
16 5 (1.15%) DBS Check
16 5 (1.15%) PRINCE2 Certification
17 3 (0.69%) AWS Certification
17 3 (0.69%) DV Cleared
Quality Assurance & Compliance
1 73 (16.78%) Data Quality
2 35 (8.05%) ISO/IEC 27001
3 34 (7.82%) Accessibility
4 31 (7.13%) QA
5 14 (3.22%) SOC 2
6 11 (2.53%) GDPR
7 9 (2.07%) Cyber Essentials
7 9 (2.07%) PMO
8 8 (1.84%) PCI DSS
8 8 (1.84%) SLA
9 7 (1.61%) Cyber Essentials PLUS
9 7 (1.61%) GRC
9 7 (1.61%) ISO/IEC 27002 (supersedes ISO/IEC 17799)
10 6 (1.38%) NIST
11 3 (0.69%) Sarbanes-Oxley
12 2 (0.46%) 21 CFR Part 11
12 2 (0.46%) California Consumer Privacy Act
12 2 (0.46%) Def Stans
12 2 (0.46%) Good Clinical Practice
13 1 (0.23%) ISO 22301
System Software
1 3 (0.69%) Docker
1 3 (0.69%) VMware Infrastructure
2 2 (0.46%) Active Directory
3 1 (0.23%) Hyper-V
3 1 (0.23%) KVM
3 1 (0.23%) Postfix
Systems Management
1 5 (1.15%) CASB
2 3 (0.69%) Grafana
2 3 (0.69%) Prometheus
3 2 (0.46%) Terraform
4 1 (0.23%) Ansible
4 1 (0.23%) FortiGate
4 1 (0.23%) Kubernetes
4 1 (0.23%) Nessus
4 1 (0.23%) OpenVAS
Vendors
1 88 (20.23%) Microsoft
2 32 (7.36%) ServiceNow
3 26 (5.98%) Salesforce
4 21 (4.83%) Salesforce Marketing Cloud
4 21 (4.83%) SAP
5 11 (2.53%) Oracle
6 5 (1.15%) PeopleSoft
6 5 (1.15%) VMware
7 4 (0.92%) Cisco
7 4 (0.92%) IBM
8 3 (0.69%) Ariba
8 3 (0.69%) Atlassian
8 3 (0.69%) Infor
9 2 (0.46%) BT
9 2 (0.46%) Cognos
9 2 (0.46%) Dell
9 2 (0.46%) Google
9 2 (0.46%) NEC
10 1 (0.23%) Genesys
10 1 (0.23%) HP