Analytical Skills Jobs in the South East

Analytical Skills
England > South East

The table below looks at the prevalence of the term Analytical Skills in permanent job vacancies advertised in the South East. Included is a benchmarking guide to the salaries offered in vacancies that have cited Analytical Skills over the 6 months to 2 December 2023 with a comparison to the same period over the previous 2 years.

6 months to
2 Dec 2023
Same period 2022 Same period 2021
Rank 24 22 28
Rank change year-on-year -2 +6 +23
Permanent jobs citing Analytical Skills 667 1,698 1,575
As % of all permanent jobs advertised in the South East 8.65% 9.75% 8.54%
As % of the General category 14.07% 15.12% 15.43%
Number of salaries quoted 409 883 880
10th Percentile £31,250 £30,000 £30,000
25th Percentile £38,000 £40,000 £37,875
Median annual salary (50th Percentile) £50,000 £52,500 £50,000
Median % change year-on-year -4.76% +5.00% -
75th Percentile £63,110 £66,000 £67,500
90th Percentile £78,750 £77,500 £80,000
England median annual salary £57,500 £55,000 £52,500
% change year-on-year +4.55% +4.76% -

All General Skills
South East

Analytical Skills is in the General Skills category. The following table is for comparison with the above and provides summary statistics for all permanent job vacancies advertised in the South East with a requirement for common skills.

Permanent vacancies with a requirement for common skills 4,740 11,230 10,208
As % of all permanent jobs advertised in the South East 61.49% 64.51% 55.33%
Number of salaries quoted 2,877 5,817 6,098
10th Percentile £28,000 £30,000 £29,337
25th Percentile £37,250 £40,000 £38,000
Median annual salary (50th Percentile) £52,000 £55,000 £50,845
Median % change year-on-year -5.45% +8.17% +1.69%
75th Percentile £67,500 £71,250 £67,500
90th Percentile £82,200 £83,850 £80,000
England median annual salary £60,000 £60,000 £60,000
% change year-on-year - - +4.35%

Analytical Skills
Job Vacancy Trend in the South East

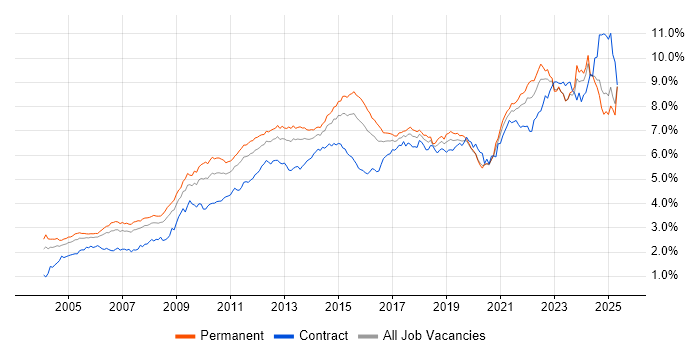
Job postings citing Analytical Skills as a proportion of all IT jobs advertised in the South East.

Job vacancy trend for Analytical Skills in the South East

Analytical Skills
Salary Trend in the South East

3-month moving average salary quoted in jobs citing Analytical Skills in the South East.

Salary trend for Analytical Skills in the South East

Analytical Skills
Salary Histogram in the South East

Salary distribution for jobs citing Analytical Skills in the South East over the 6 months to 2 December 2023.

Salary histogram for Analytical Skills in the South East

Analytical Skills
Job Locations in the South East

The table below looks at the demand and provides a guide to the median salaries quoted in IT jobs citing Analytical Skills within the South East region over the 6 months to 2 December 2023. The 'Rank Change' column provides an indication of the change in demand within each location based on the same 6 month period last year.

Location Rank Change
on Same Period
Last Year
Matching
Permanent
IT Job Ads
Median Salary
Past 6 Months
Median Salary
% Change
on Same Period
Last Year
Live
Jobs
Thames Valley -5 255 £51,000 -0.97% 210
Hampshire +11 188 £55,000 - 104
Berkshire -11 147 £51,000 -5.56% 108
Surrey -4 89 £52,500 -4.55% 89
Buckinghamshire +6 71 £55,000 +10.00% 47
West Sussex -5 50 £55,000 - 15
Kent +1 47 £45,000 -10.00% 39
East Sussex +14 37 £47,500 -5.00% 14
Oxfordshire -3 37 £42,796 -4.90% 55
Home Counties +7 1 £30,000 -42.86%
Isle of Wight +3 1 £35,000 - 1
Analytical Skills
England

Analytical Skills
Co-occurring Skills and Capabilities in the South East by Category

The follow tables expand on the table above by listing co-occurrences grouped by category. The same employment type, locality and period is covered with up to 20 co-occurrences shown in each of the following categories:

Application Platforms
1 36 (5.40%) WebLogic
2 14 (2.10%) SharePoint
3 9 (1.35%) Confluence
4 8 (1.20%) Oracle Service Bus
5 7 (1.05%) Apache Spark
6 5 (0.75%) CMS
6 5 (0.75%) ThingWorx
7 3 (0.45%) IIS
8 2 (0.30%) Apache
8 2 (0.30%) NServiceBus
8 2 (0.30%) Sitecore CMS
8 2 (0.30%) Umbraco
9 1 (0.15%) Adobe Experience Manager
9 1 (0.15%) BizTalk Server
9 1 (0.15%) MQSeries
9 1 (0.15%) Mule
9 1 (0.15%) nginx
9 1 (0.15%) SAS
9 1 (0.15%) WebSphere
9 1 (0.15%) WebSphere Application Server
Applications
1 54 (8.10%) Microsoft Excel
2 50 (7.50%) Microsoft Office
3 24 (3.60%) Microsoft PowerPoint
4 14 (2.10%) MS Visio
5 10 (1.50%) Microsoft Project
6 8 (1.20%) Windchill
7 5 (0.75%) Autodesk Inventor
7 5 (0.75%) SOLIDWORKS
8 3 (0.45%) Spreadsheet
9 1 (0.15%) FileZilla
Business Applications
1 10 (1.50%) Dynamics CRM
2 8 (1.20%) Remedy ITSM
3 5 (0.75%) Dynamics NAV
4 4 (0.60%) Front Arena
4 4 (0.60%) NetSuite
5 3 (0.45%) Cognos Controller
5 3 (0.45%) IBM Planning Analytics
6 2 (0.30%) Cognos Planning
6 2 (0.30%) Hyperion Planning
6 2 (0.30%) Sage X3
6 2 (0.30%) Salesforce CRM
7 1 (0.15%) iTrent
7 1 (0.15%) JDE EnterpriseOne
7 1 (0.15%) SAP S/4HANA
7 1 (0.15%) Workday HCM
Cloud Services
1 147 (22.04%) Azure
2 62 (9.30%) Power Platform
3 45 (6.75%) Microsoft 365
4 40 (6.00%) AWS
4 40 (6.00%) Azure DevOps
5 38 (5.70%) SaaS
6 23 (3.45%) Salesforce Sales Cloud
7 16 (2.40%) Azure Synapse Analytics
8 13 (1.95%) Snowflake
9 11 (1.65%) Serverless
10 10 (1.50%) GCP
11 8 (1.20%) Azure Data Factory
12 7 (1.05%) Matillion
12 7 (1.05%) WhatsApp
13 6 (0.90%) Azure Sentinel
13 6 (0.90%) Dynamics 365
13 6 (0.90%) Entra ID
14 5 (0.75%) Smartsheet
15 4 (0.60%) Azure ExpressRoute
15 4 (0.60%) Nutanix
Communications & Networking
1 38 (5.70%) VPN
2 29 (4.35%) Firewall
3 26 (3.90%) DNS
4 22 (3.30%) WAN
5 20 (3.00%) DHCP
6 19 (2.85%) Internet
7 15 (2.25%) LAN
7 15 (2.25%) SAN
7 15 (2.25%) TCP/IP
8 13 (1.95%) Wireshark
9 12 (1.80%) Wireless
10 11 (1.65%) Structured Cabling
11 10 (1.50%) Network Security
12 8 (1.20%) BGP
13 7 (1.05%) HTTP
14 5 (0.75%) Broadband
14 5 (0.75%) MPLS
14 5 (0.75%) OSPF
15 4 (0.60%) EIGRP
15 4 (0.60%) Wi-Fi
Database & Business Intelligence
1 57 (8.55%) Power BI
2 49 (7.35%) Looker
3 37 (5.55%) SQL Server
4 29 (4.35%) Elasticsearch
5 28 (4.20%) Data Warehouse
6 15 (2.25%) Data Lake
7 14 (2.10%) Tableau
8 13 (1.95%) Relational Database
9 11 (1.65%) Amazon RDS
10 10 (1.50%) MySQL
10 10 (1.50%) Oracle Database
11 9 (1.35%) Metadata
11 9 (1.35%) SQL Server Analysis Services
11 9 (1.35%) SQL Server Reporting Services
12 8 (1.20%) Big Data
12 8 (1.20%) Microsoft Analysis Services
12 8 (1.20%) Oracle Database 10g
12 8 (1.20%) Oracle Database 11g
12 8 (1.20%) SQL Server Integration Services
12 8 (1.20%) VLDB
Development Applications
1 26 (3.90%) JIRA
1 26 (3.90%) Selenium
2 23 (3.45%) Robot Framework
3 19 (2.85%) Git
4 8 (1.20%) AutoIt
4 8 (1.20%) eggPlant
4 8 (1.20%) GitLab
5 7 (1.05%) JMeter
6 6 (0.90%) Jenkins
6 6 (0.90%) Postman
7 4 (0.60%) Subversion
8 3 (0.45%) Gradle
8 3 (0.45%) Sonatype Nexus
8 3 (0.45%) Visual Studio
9 2 (0.30%) Cucumber
9 2 (0.30%) Maven
9 2 (0.30%) REST Assured
9 2 (0.30%) SoapUI
9 2 (0.30%) SpecFlow
9 2 (0.30%) Visual Studio Code
General
1 318 (47.68%) Social Skills
2 158 (23.69%) Finance
3 109 (16.34%) Manufacturing
4 55 (8.25%) Marketing
5 38 (5.70%) Retail
6 33 (4.95%) Telecoms
7 28 (4.20%) Legal
8 18 (2.70%) Organisational Skills
9 16 (2.40%) Presentation Skills
10 15 (2.25%) Inclusion and Diversity
11 14 (2.10%) Law
11 14 (2.10%) Public Sector
12 13 (1.95%) Aerospace
12 13 (1.95%) Influencing Skills
13 12 (1.80%) Automotive
14 11 (1.65%) Pharmaceutical
15 10 (1.50%) Electronics
16 8 (1.20%) Games
17 5 (0.75%) Financial Institution
18 4 (0.60%) Advertising
Job Titles
1 254 (38.08%) Analyst
2 82 (12.29%) Senior
3 55 (8.25%) Support Analyst
4 47 (7.05%) Developer
5 46 (6.90%) Senior Analyst
6 44 (6.60%) Applications Support
7 40 (6.00%) Applications Support Analyst
8 38 (5.70%) Lead
9 32 (4.80%) Business Analyst
10 29 (4.35%) Applications Engineer
11 28 (4.20%) Senior Support Analyst
11 28 (4.20%) Support Engineer
12 27 (4.05%) Solutions Analyst
13 25 (3.75%) Senior Applications Support
13 25 (3.75%) Senior Applications Support Analyst
14 23 (3.45%) Salesforce Analyst
15 22 (3.30%) Consultant
16 21 (3.15%) Development Manager
16 21 (3.15%) Project Manager
17 20 (3.00%) HR Analyst
Libraries, Frameworks & Software Standards
1 38 (5.70%) .NET
2 33 (4.95%) Spring
3 30 (4.50%) Java EE
4 28 (4.20%) J2EE
5 26 (3.90%) HTML
6 20 (3.00%) React
7 17 (2.55%) CSS
8 14 (2.10%) XML
9 11 (1.65%) AngularJS
10 10 (1.50%) JSON
10 10 (1.50%) Laravel
11 7 (1.05%) ASP.NET
11 7 (1.05%) REST
11 7 (1.05%) Web Services
12 6 (0.90%) .NET Framework
12 6 (0.90%) Kafka
13 5 (0.75%) HTML5
13 5 (0.75%) ModSecurity
13 5 (0.75%) Symfony
13 5 (0.75%) Vue
Miscellaneous
1 50 (7.50%) Self-Motivation
2 44 (6.60%) Management Information System
3 33 (4.95%) Analytical Mindset
4 23 (3.45%) Client/Server
5 19 (2.85%) Data Structures
5 19 (2.85%) IoT
6 17 (2.55%) Product Ownership
7 14 (2.10%) Smart Meter
8 13 (1.95%) Greenfield Project
9 11 (1.65%) Algorithms
10 8 (1.20%) Private Cloud
11 7 (1.05%) FMCG
11 7 (1.05%) Legacy Systems
12 6 (0.90%) Enterprise Software
13 5 (0.75%) Augmented Reality
13 5 (0.75%) Distributed Systems
13 5 (0.75%) Driving Licence
13 5 (0.75%) Industrial Internet of Things
13 5 (0.75%) Mobile App
13 5 (0.75%) Operational Technology
Operating Systems
1 101 (15.14%) Windows
2 60 (9.00%) Linux
3 51 (7.65%) Windows Server
4 37 (5.55%) Unix
5 24 (3.60%) Red Hat Enterprise Linux
6 8 (1.20%) Solaris
7 7 (1.05%) Android
8 6 (0.90%) Mac OS
8 6 (0.90%) Windows 10
9 5 (0.75%) Windows Server 2019
10 4 (0.60%) Windows Server 2016
11 3 (0.45%) Apple iOS
11 3 (0.45%) VMS
12 1 (0.15%) Data ONTAP
12 1 (0.15%) Ubuntu
12 1 (0.15%) Windows Server 2008
12 1 (0.15%) Windows Server 2012
Processes & Methodologies
1 313 (46.93%) Problem-Solving
2 132 (19.79%) Agile
3 113 (16.94%) Business Intelligence
4 110 (16.49%) Project Management
5 106 (15.89%) Analytics
6 91 (13.64%) Stakeholder Management
7 89 (13.34%) ITIL
8 75 (11.24%) Project Delivery
9 74 (11.09%) Actionable Insight
10 73 (10.94%) ERP
11 69 (10.34%) Customer Service
12 65 (9.75%) DevOps
13 59 (8.85%) Computer Science
14 54 (8.10%) Continuous Improvement
14 54 (8.10%) Data Analysis
15 53 (7.95%) Incident Management
16 49 (7.35%) Case Management
17 48 (7.20%) Stakeholder and Relationship Management
18 47 (7.05%) Scrum
19 45 (6.75%) SDLC
Programming Languages
1 117 (17.54%) SQL
2 91 (13.64%) Python
3 56 (8.40%) PowerShell
4 51 (7.65%) Java
5 41 (6.15%) JavaScript
6 40 (6.00%) C#
7 26 (3.90%) Shell Script
8 24 (3.60%) VBScript
9 19 (2.85%) C++
10 17 (2.55%) T-SQL
11 15 (2.25%) R
12 13 (1.95%) PHP
13 12 (1.80%) Bash
13 12 (1.80%) TypeScript
14 11 (1.65%) PL/SQL
15 8 (1.20%) Bicep
16 7 (1.05%) VBA
17 6 (0.90%) Go
18 5 (0.75%) C
18 5 (0.75%) Perl
Qualifications
1 221 (33.13%) Degree
2 109 (16.34%) Security Cleared
3 67 (10.04%) SC Cleared
4 26 (3.90%) Computer Science Degree
5 16 (2.40%) Master's Degree
6 15 (2.25%) Microsoft Certification
7 14 (2.10%) Azure Certification
7 14 (2.10%) CISSP
8 11 (1.65%) Cisco Certification
8 11 (1.65%) DV Cleared
9 10 (1.50%) ACCA
9 10 (1.50%) CISM
10 9 (1.35%) CISMP
10 9 (1.35%) Numerate Degree
11 8 (1.20%) PMI Certification
12 7 (1.05%) CCNA
12 7 (1.05%) ISTQB
13 6 (0.90%) CIMA
13 6 (0.90%) ITIL Certification
14 5 (0.75%) CISA
Quality Assurance & Compliance
1 50 (7.50%) SLA
2 23 (3.45%) QA
3 15 (2.25%) Data Quality
4 13 (1.95%) ISO/IEC 27001
5 12 (1.80%) Accessibility
5 12 (1.80%) GDPR
6 10 (1.50%) NIST
7 6 (0.90%) PMO
8 5 (0.75%) GRC
8 5 (0.75%) HIPAA
8 5 (0.75%) ISO 22301
8 5 (0.75%) Sarbanes-Oxley
9 4 (0.60%) Cyber Essentials
9 4 (0.60%) Def Stans
10 3 (0.45%) PCI DSS
11 2 (0.30%) GMP
11 2 (0.30%) ISO 9001
12 1 (0.15%) COSHH
12 1 (0.15%) ISO 14001
12 1 (0.15%) WCAG
System Software
1 42 (6.30%) VMware Infrastructure
2 41 (6.15%) Active Directory
3 8 (1.20%) Oracle RAC
4 4 (0.60%) Docker
4 4 (0.60%) Firmware
4 4 (0.60%) Hyper-V
4 4 (0.60%) Virtual Machines
4 4 (0.60%) vSphere
5 1 (0.15%) GPFS
5 1 (0.15%) Snort
5 1 (0.15%) XenApp
Systems Management
1 30 (4.50%) Single Sign-On
2 28 (4.20%) OpenSSO
3 18 (2.70%) SCCM
4 10 (1.50%) Oracle RMAN
5 8 (1.20%) Data Guard
6 7 (1.05%) Microsoft Intune
7 6 (0.90%) Kubernetes
8 4 (0.60%) FortiGate
9 3 (0.45%) AirWatch
9 3 (0.45%) Computer Emergency Response Teams
9 3 (0.45%) Progress Chef
9 3 (0.45%) SCOM
10 2 (0.30%) Ansible
10 2 (0.30%) Jamf Pro
10 2 (0.30%) Terraform
11 1 (0.15%) Autotask
11 1 (0.15%) Control-M
11 1 (0.15%) PaperCut
Vendors
1 136 (20.39%) Microsoft
2 55 (8.25%) Oracle
3 47 (7.05%) VMware
4 33 (4.95%) Remedy
5 30 (4.50%) Salesforce
6 26 (3.90%) Cisco
7 24 (3.60%) HP
8 23 (3.45%) Databricks
9 21 (3.15%) SAP
10 13 (1.95%) Google
11 12 (1.80%) Dell
11 12 (1.80%) Nimble Storage
11 12 (1.80%) Veeam
12 11 (1.65%) Bloomberg
12 11 (1.65%) Mitel
12 11 (1.65%) Zerto
13 8 (1.20%) CA
13 8 (1.20%) IBM
13 8 (1.20%) Sun
14 7 (1.05%) Juniper