Management Information System Job Trends in England

Management Information Systems
UK > England

The table below looks at the prevalence of the term Management Information System in permanent job vacancies in England. Included is a benchmarking guide to the salaries offered in vacancies that cited Management Information System over the 6 months leading up to 5 November 2025, comparing them to the same period in the previous two years.

6 months to
5 Nov 2025
Same period 2024 Same period 2023
Rank 110 91 70
Rank change year-on-year -19 -21 +21
Permanent jobs citing Management Information System 1,124 1,735 1,962
As % of all permanent jobs in England 2.59% 2.85% 4.15%
As % of the Miscellaneous category 6.78% 8.63% 10.68%
Number of salaries quoted 519 717 1,250
10th Percentile £26,500 £32,500 £35,000
25th Percentile £34,250 £42,415 £45,000
Median annual salary (50th Percentile) £50,000 £55,000 £60,000
Median % change year-on-year -9.09% -8.33% +9.09%
75th Percentile £75,000 £70,000 £75,000
90th Percentile £90,000 £90,000 £97,500
UK median annual salary £48,712 £55,213 £60,000
% change year-on-year -11.77% -7.98% +9.09%

All Generic Skills
England

Management Information System falls under the General and Transferable Skills category. For comparison with the information above, the following table provides summary statistics for all permanent job vacancies requiring generic IT skills in England.

Permanent vacancies with a requirement for generic IT skills 16,566 20,100 18,370
As % of all permanent jobs advertised in England 38.18% 33.06% 38.90%
Number of salaries quoted 9,531 9,669 13,748
10th Percentile £27,750 £33,750 £34,000
25th Percentile £36,250 £46,250 £46,250
Median annual salary (50th Percentile) £54,793 £60,000 £62,500
Median % change year-on-year -8.68% -4.00% -0.79%
75th Percentile £77,500 £85,000 £85,000
90th Percentile £105,000 £112,500 £110,000
UK median annual salary £53,500 £60,000 £62,500
% change year-on-year -10.83% -4.00% -

Management Information System
Job Vacancy Trend in England

Historical trend showing the proportion of permanent IT job postings citing Management Information System relative to all permanent IT jobs advertised in England.
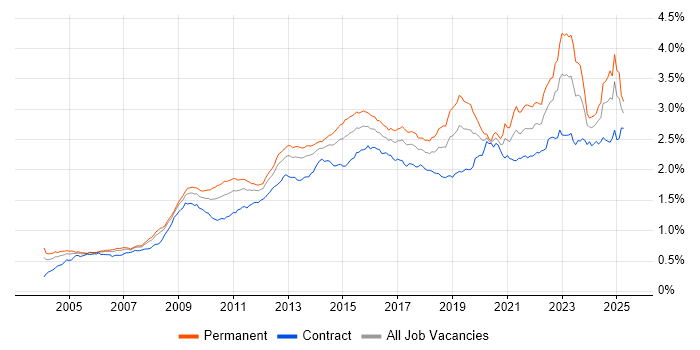
Management Information System job vacancy trend in England

Management Information System
Salary Trend in England

Salary distribution trend for jobs in England citing Management Information System.

Salary distribution trend for jobs in England citing Management Information System

Management Information System
Salary Histogram in England

Salary distribution for jobs citing Management Information System in England over the 6 months to 5 November 2025.

Salary histogram for Management Information System in England

Management Information System
Job Locations in England

The table below looks at the demand and provides a guide to the median salaries quoted in IT jobs citing Management Information System within the England region over the 6 months to 5 November 2025. The 'Rank Change' column provides an indication of the change in demand within each location based on the same 6 month period last year.

Location Rank Change
on Same Period
Last Year
Matching
Permanent
IT Job Ads
Median Salary
Past 6 Months
Median Salary
% Change
on Same Period
Last Year
Live
Jobs
London +16 435 £75,000 +15.38% 374
North of England -42 224 £37,000 -26.08% 140
South East -16 219 £50,000 -8.26% 348
North West -37 115 £40,500 -22.86% 62
Yorkshire 0 99 £25,000 -45.65% 45
Midlands -42 87 £41,645 -21.87% 105
South West +4 84 £45,000 -10.00% 81
East of England -17 55 £35,000 -22.22% 69
East Midlands -6 45 £40,000 -20.00% 39
West Midlands -42 41 £42,500 -21.51% 61
North East -11 10 £78,000 +108.00% 34
Management Information System
UK

Management Information System
Co-Occurring Skills & Capabilities in England by Category

The following tables expand on the one above by listing co-occurrences grouped by category. They cover the same employment type, locality and period, with up to 20 co-occurrences shown in each category:

Application Platforms
1 27 (2.40%) Microsoft Exchange
1 27 (2.40%) SharePoint
2 17 (1.51%) Confluence
3 16 (1.42%) IIS
4 15 (1.33%) Apache Spark
5 13 (1.16%) WebSphere
6 12 (1.07%) CMS
7 10 (0.89%) SugarCRM
7 10 (0.89%) Tomcat
7 10 (0.89%) WebSphere Application Server
8 5 (0.44%) Apache
9 3 (0.27%) Headless CMS
9 3 (0.27%) JBoss
9 3 (0.27%) Magnolia
9 3 (0.27%) WordPress
10 2 (0.18%) Apache Airflow
10 2 (0.18%) ArcGIS
10 2 (0.18%) Skype for Business
11 1 (0.089%) Oracle Workflow
11 1 (0.089%) SharePoint Server
Applications
1 90 (8.01%) Microsoft Office
2 87 (7.74%) Microsoft Excel
3 30 (2.67%) Microsoft PowerPoint
4 15 (1.33%) Spreadsheet
5 9 (0.80%) Microsoft Project
6 7 (0.62%) Navisworks
7 6 (0.53%) MS Visio
7 6 (0.53%) Revit
8 4 (0.36%) Simulink
9 3 (0.27%) Trello
10 2 (0.18%) UserZoom
11 1 (0.089%) Adobe Captivate
11 1 (0.089%) Civil 3D
11 1 (0.089%) ProjectWise
11 1 (0.089%) Windchill
Business Applications
1 11 (0.98%) SAP S/4HANA
2 6 (0.53%) Oracle EBS
2 6 (0.53%) Salesforce CRM
3 5 (0.44%) Exchequer
3 5 (0.44%) NetSuite
4 3 (0.27%) Dynamics AX
4 3 (0.27%) Dynamics CRM
4 3 (0.27%) ResourceLink
4 3 (0.27%) Sage X3
5 2 (0.18%) iTrent
5 2 (0.18%) SAP GRC
5 2 (0.18%) SAP IBP
6 1 (0.089%) Cognos Business Intelligence
6 1 (0.089%) Infor M3
6 1 (0.089%) Integrated Workplace Management System
6 1 (0.089%) Oracle EBS R12
6 1 (0.089%) SAP ERP
6 1 (0.089%) SAP MII
6 1 (0.089%) Shopify
6 1 (0.089%) TRIRIGA
Cloud Services
1 175 (15.57%) Azure
2 145 (12.90%) AWS
3 93 (8.27%) Power Platform
4 68 (6.05%) Microsoft 365
5 55 (4.89%) GCP
6 36 (3.20%) SaaS
7 34 (3.02%) Entra ID
8 30 (2.67%) Azure DevOps
8 30 (2.67%) Cloud Computing
9 23 (2.05%) Amazon EKS
10 21 (1.87%) Dynamics 365
10 21 (1.87%) Power Automate
11 20 (1.78%) OpenShift
12 19 (1.69%) Serverless
13 17 (1.51%) GitHub
14 15 (1.33%) Slack
15 13 (1.16%) H2O.ai
16 12 (1.07%) IaaS
17 8 (0.71%) Amazon EMR
17 8 (0.71%) PaaS
Communications & Networking
1 73 (6.49%) Firewall
2 28 (2.49%) LAN
3 27 (2.40%) WAN
4 25 (2.22%) TCP/IP
5 24 (2.14%) Network Security
6 22 (1.96%) VPN
7 20 (1.78%) Internet
8 19 (1.69%) Wireless
9 18 (1.60%) SSL
10 16 (1.42%) DNS
11 15 (1.33%) DHCP
11 15 (1.33%) VoIP
12 14 (1.25%) Remote Desktop
12 14 (1.25%) SD-WAN
13 13 (1.16%) SAN
14 11 (0.98%) Wireshark
15 10 (0.89%) Intrusion Detection
16 9 (0.80%) iSCSI
16 9 (0.80%) VLAN
17 7 (0.62%) Wi-Fi
Database & Business Intelligence
1 74 (6.58%) Power BI
2 57 (5.07%) Data Warehouse
3 49 (4.36%) SQL Server
4 34 (3.02%) Metadata
5 31 (2.76%) Data Lake
6 30 (2.67%) NoSQL
6 30 (2.67%) PostgreSQL
7 29 (2.58%) MySQL
7 29 (2.58%) Relational Database
8 22 (1.96%) Tableau
9 20 (1.78%) Big Data
10 18 (1.60%) RDBMS
11 16 (1.42%) Oracle Reports
12 14 (1.25%) Hadoop
13 13 (1.16%) DB2
13 13 (1.16%) GIS
14 12 (1.07%) DynamoDB
15 11 (0.98%) DataStage
16 10 (0.89%) Tick Data
17 9 (0.80%) BigQuery
Development Applications
1 49 (4.36%) JIRA
2 32 (2.85%) Git
3 17 (1.51%) Jenkins
4 7 (0.62%) ERwin
4 7 (0.62%) PowerDesigner
5 6 (0.53%) ER Studio
5 6 (0.53%) GitLab
5 6 (0.53%) Maven
6 4 (0.36%) git-flow
7 3 (0.27%) Ant
7 3 (0.27%) Artifactory
7 3 (0.27%) Rational Rhapsody
7 3 (0.27%) Snyk
7 3 (0.27%) Sonatype Nexus
8 2 (0.18%) JUnit
8 2 (0.18%) Oracle APEX
9 1 (0.089%) Cypress.io
9 1 (0.089%) Selenium
9 1 (0.089%) SQL Server Management Studio (SSMS)
9 1 (0.089%) TestNG
General
1 493 (43.86%) Social Skills
2 409 (36.39%) Finance
3 244 (21.71%) Analytical Skills
4 131 (11.65%) Manufacturing
5 107 (9.52%) Law
6 103 (9.16%) Inclusion and Diversity
7 87 (7.74%) Retail
8 82 (7.30%) Legal
9 81 (7.21%) Banking
10 80 (7.12%) Presentation Skills
11 75 (6.67%) Marketing
12 54 (4.80%) Influencing Skills
13 48 (4.27%) Organisational Skills
14 43 (3.83%) Aerospace
15 38 (3.38%) Front Office
16 37 (3.29%) Aviation
17 31 (2.76%) Public Sector
18 22 (1.96%) Investment Banking
18 22 (1.96%) Telecoms
19 19 (1.69%) Advertising
Job Titles
1 173 (15.39%) Analyst
2 138 (12.28%) Lead
3 136 (12.10%) Senior
4 85 (7.56%) Systems Engineer
5 64 (5.69%) Support Analyst
6 60 (5.34%) Automation Engineer
7 59 (5.25%) Architect
8 58 (5.16%) Coordinator
9 56 (4.98%) Developer
10 43 (3.83%) IT Support
11 42 (3.74%) IT Analyst
12 40 (3.56%) Consultant
13 35 (3.11%) Administrator
14 33 (2.94%) Solutions Architect
14 33 (2.94%) Team Leader
15 32 (2.85%) Applications Support
16 30 (2.67%) Principal Engineer
17 29 (2.58%) IT Manager
17 29 (2.58%) Senior Manager
18 28 (2.49%) Python Developer
Libraries, Frameworks & Software Standards
1 29 (2.58%) Kafka
2 22 (1.96%) RESTful
3 20 (1.78%) REST
4 18 (1.60%) Boost C++ Libraries
5 17 (1.51%) AngularJS
6 13 (1.16%) Keras
6 13 (1.16%) PyTorch
6 13 (1.16%) TensorFlow
7 12 (1.07%) Middleware
7 12 (1.07%) Oracle Fusion
7 12 (1.07%) Spring
8 11 (0.98%) GraphQL
9 10 (0.89%) LAPP Stack
9 10 (0.89%) LDAP
9 10 (0.89%) WebSphere MQ
10 9 (0.80%) Node.js
10 9 (0.80%) React
11 8 (0.71%) OpenAPI
11 8 (0.71%) Swagger
11 8 (0.71%) Vue
Miscellaneous
1 84 (7.47%) Operational Technology
2 78 (6.94%) FMCG
3 67 (5.96%) Self-Motivation
4 62 (5.52%) Manufacturing Execution System
5 61 (5.43%) Onboarding
6 50 (4.45%) Data Centre
7 48 (4.27%) Cloud Native
8 33 (2.94%) Data Structures
8 33 (2.94%) Product Ownership
9 31 (2.76%) Analytical Mindset
10 29 (2.58%) Hedge funds
11 25 (2.22%) Algorithms
11 25 (2.22%) Driving Licence
11 25 (2.22%) Life Science
12 23 (2.05%) Distributed Systems
12 23 (2.05%) Security Posture
13 21 (1.87%) LIMS
14 20 (1.78%) Equities
15 19 (1.69%) IoT
16 18 (1.60%) Public Cloud
Operating Systems
1 96 (8.54%) Windows
2 81 (7.21%) Linux
3 29 (2.58%) Red Hat Enterprise Linux
4 25 (2.22%) Windows Server
5 16 (1.42%) Unix
6 13 (1.16%) Windows Server 2019
7 9 (0.80%) Windows 10
8 8 (0.71%) Mac OS
9 2 (0.18%) OpenVMS
9 2 (0.18%) Solaris
9 2 (0.18%) Windows Server 2016
10 1 (0.089%) AIX
10 1 (0.089%) Kali Linux
10 1 (0.089%) Ubuntu
10 1 (0.089%) VMS
10 1 (0.089%) Windows 7
10 1 (0.089%) Windows Server 2008
10 1 (0.089%) Windows Server 2012
Processes & Methodologies
1 318 (28.29%) Problem-Solving
2 290 (25.80%) Continuous Improvement
3 212 (18.86%) Agile
4 189 (16.81%) Cybersecurity
5 185 (16.46%) Information Security
6 174 (15.48%) Project Management
7 159 (14.15%) Computer Science
7 159 (14.15%) Data Management
8 158 (14.06%) Risk Management
9 153 (13.61%) Decision-Making
10 143 (12.72%) Analytics
11 120 (10.68%) Stakeholder Management
12 118 (10.50%) ITIL
13 116 (10.32%) ERP
14 115 (10.23%) Customer Service
14 115 (10.23%) DevOps
15 112 (9.96%) Mentoring
16 109 (9.70%) Business Intelligence
17 106 (9.43%) Change Management
18 102 (9.07%) Budgeting
Programming Languages
1 134 (11.92%) SQL
2 119 (10.59%) Python
3 46 (4.09%) Java
4 35 (3.11%) PowerShell
5 31 (2.76%) Bash
6 27 (2.40%) Go
7 20 (1.78%) C++
8 17 (1.51%) JavaScript
9 12 (1.07%) C#
10 11 (0.98%) T-SQL
11 9 (0.80%) Korn
11 9 (0.80%) Kotlin
11 9 (0.80%) Scala
12 8 (0.71%) Lua
13 5 (0.44%) R
14 3 (0.27%) Groovy
14 3 (0.27%) PHP
14 3 (0.27%) VBA
15 2 (0.18%) Apex Code
15 2 (0.18%) COBOL
Qualifications
1 450 (40.04%) Degree
2 108 (9.61%) CISSP
3 98 (8.72%) Computer Science Degree
4 87 (7.74%) CISM
5 73 (6.49%) HNC
6 71 (6.32%) Master's Degree
7 66 (5.87%) Security Cleared
8 47 (4.18%) BPSS Clearance
9 43 (3.83%) SC Cleared
10 32 (2.85%) AWS Certification
10 32 (2.85%) CRISC
10 32 (2.85%) DBS Check
11 28 (2.49%) Azure Certification
12 26 (2.31%) CISA
13 23 (2.05%) PMI Certification
13 23 (2.05%) PMP
14 22 (1.96%) CESG Certified Professional
15 19 (1.69%) Microsoft Certification
16 18 (1.60%) CISMP
16 18 (1.60%) ITIL Certification
Quality Assurance & Compliance
1 112 (9.96%) ISO/IEC 27001
2 95 (8.45%) NIST
3 75 (6.67%) GDPR
4 66 (5.87%) Data Quality
5 57 (5.07%) QA
6 51 (4.54%) SLA
7 40 (3.56%) Accessibility
8 29 (2.58%) Cyber Essentials
9 25 (2.22%) GxP
9 25 (2.22%) SOC 2
10 20 (1.78%) GRC
10 20 (1.78%) NIST 800
11 18 (1.60%) NCSC
11 18 (1.60%) RMADS
12 17 (1.51%) JSP 440
13 16 (1.42%) HMG Security Policy Framework
14 15 (1.33%) GLP
14 15 (1.33%) PCI DSS
15 11 (0.98%) HIPAA
15 11 (0.98%) PMO
System Software
1 60 (5.34%) Active Directory
2 50 (4.45%) VMware Infrastructure
3 31 (2.76%) Docker
4 22 (1.96%) Virtual Machines
5 16 (1.42%) Hyper-V
6 10 (0.89%) Firmware
6 10 (0.89%) vSphere
7 9 (0.80%) Citrix Hypervisor
8 6 (0.53%) NFS
9 4 (0.36%) Virtual Desktop
10 1 (0.089%) VMware ESXi
Systems Management
1 44 (3.91%) Kubernetes
2 33 (2.94%) Terraform
3 25 (2.22%) Ansible
4 14 (1.25%) Microsoft Intune
5 9 (0.80%) SCCM
6 5 (0.44%) Autotask
7 4 (0.36%) Active Directory Federation Services
7 4 (0.36%) Rancher
7 4 (0.36%) Single Sign-On
7 4 (0.36%) vRealize
8 3 (0.27%) FortiGate
8 3 (0.27%) Podman
8 3 (0.27%) Puppet
9 1 (0.089%) Control-M
9 1 (0.089%) Jamf Pro
9 1 (0.089%) Kibana
9 1 (0.089%) NetBackup
9 1 (0.089%) Nmap
9 1 (0.089%) WSUS
9 1 (0.089%) ZABBIX
Vendors
1 207 (18.42%) Microsoft
2 61 (5.43%) Rockwell
2 61 (5.43%) Siemens
3 54 (4.80%) SAP
3 54 (4.80%) VMware
4 49 (4.36%) Salesforce
5 48 (4.27%) ServiceNow
6 46 (4.09%) Google
7 35 (3.11%) Oracle
8 31 (2.76%) Cisco
9 29 (2.58%) Databricks
9 29 (2.58%) Dell
10 26 (2.31%) Red Hat
11 22 (1.96%) IBM
12 16 (1.42%) Tenable
13 14 (1.25%) Palo Alto
14 13 (1.16%) NVIDIA
15 12 (1.07%) CheckPoint
15 12 (1.07%) Informatica
15 12 (1.07%) Meraki