zOS Contracts in England

IBM z/OS
UK > England

The following table provides summary statistics for contract job vacancies advertised in England with a requirement for zOS skills. Included is a benchmarking guide to the contractor rates offered in vacancies that have cited zOS over the 6 months to 8 May 2024 with a comparison to the same period in the previous 2 years.

6 months to
8 May 2024
Same period 2023 Same period 2022
Rank 440 598 721
Rank change year-on-year +158 +123 -141
Contract jobs citing zOS 115 47 57
As % of all contract jobs advertised in England 0.31% 0.096% 0.081%
As % of the Operating Systems category 2.30% 0.58% 0.51%
Number of daily rates quoted 72 13 16
10th Percentile £371 £463 £416
25th Percentile £415 £475 £461
Median daily rate (50th Percentile) £459 £570 £515
Median % change year-on-year -19.47% +10.68% +22.62%
75th Percentile £588 £650 £613
90th Percentile £636 £713 £695
UK median daily rate £459 £585 £500
% change year-on-year -21.54% +17.00% -1.23%

All Operating Systems
England

zOS is in the Operating Systems category. The following table is for comparison with the above and provides summary statistics for all contract job vacancies advertised in England with a requirement for operating system skills.

Contract vacancies with a requirement for operating system skills 5,001 8,063 11,083
As % of all contract IT jobs advertised in England 13.58% 16.42% 15.71%
Number of daily rates quoted 3,422 5,713 7,589
10th Percentile £183 £195 £173
25th Percentile £300 £326 £319
Median daily rate (50th Percentile) £467 £513 £500
Median % change year-on-year -8.98% +2.50% +11.11%
75th Percentile £588 £638 £625
90th Percentile £700 £725 £700
UK median daily rate £468 £510 £500
% change year-on-year -8.24% +2.00% +11.11%
Number of hourly rates quoted 363 386 547
10th Percentile £12.75 £13.29 £13.38
25th Percentile £14.95 £17.72 £15.90
Median hourly rate £22.00 £37.42 £22.00
Median % change year-on-year -41.21% +70.09% +23.80%
75th Percentile £60.00 £64.88 £50.00
90th Percentile £70.00 £75.00 £65.00
UK median hourly rate £22.00 £38.50 £22.50
% change year-on-year -42.86% +71.11% +26.76%

zOS
Job Vacancy Trend in England

Job postings citing zOS as a proportion of all IT jobs advertised in England.
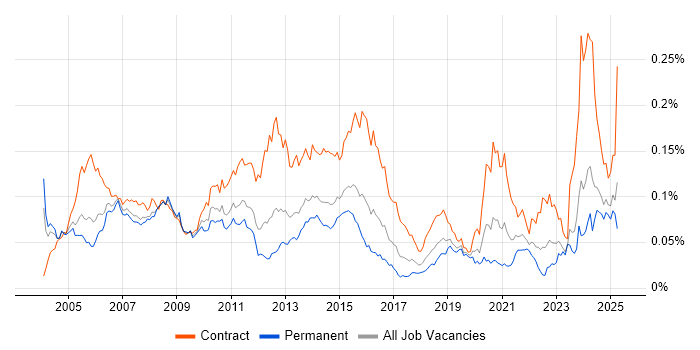
Job vacancy trend for zOS in England

zOS
Contractor Daily Rate Trend in England

3-month moving average daily rate quoted in jobs citing zOS in England.

Daily rate trend for zOS in England

zOS
Daily Rate Histogram in England

Daily rate distribution for jobs citing zOS in England over the 6 months to 8 May 2024.

Daily rate histogram for zOS in England

zOS
Contractor Hourly Rate Trend in England

3-month moving average hourly rates quoted in jobs citing zOS in England.

Hourly rate trend for zOS in England

zOS
Contract Job Locations in England

The table below looks at the demand and provides a guide to the median contractor rates quoted in IT jobs citing zOS within the England region over the 6 months to 8 May 2024. The 'Rank Change' column provides an indication of the change in demand within each location based on the same 6 month period last year.

Location Rank Change
on Same Period
Last Year
Matching
Contract
IT Job Ads
Median
Daily Rate
Past 6 Months
Median Daily Rate
% Change
on Same Period
Last Year
Live
Jobs
North of England +84 64 £430 -9.47% 2
Yorkshire +77 59 £430 -9.47%
London +95 27 £475 -20.83% 3
West Midlands - 10 £358 -
Midlands - 10 £358 -
South East +14 6 £358 -48.86%
North West - 5 £763 - 2
East of England +5 1 £600 -
South West - 1 - -
zOS
UK

zOS
Co-occurring Skills and Capabilities in England by Category

The follow tables expand on the table above by listing co-occurrences grouped by category. The same employment type, locality and period is covered with up to 20 co-occurrences shown in each of the following categories:

Application Platforms
1 32 (27.83%) SAS
2 24 (20.87%) CICS
Business Applications
1 2 (1.74%) SAP S/4HANA
Cloud Services
1 16 (13.91%) GitHub
2 7 (6.09%) AWS
3 5 (4.35%) GCP
4 4 (3.48%) Azure
5 2 (1.74%) Amazon S3
5 2 (1.74%) Azure Sentinel
Communications & Networking
1 9 (7.83%) DWDM
2 2 (1.74%) LAN
2 2 (1.74%) WAN
3 1 (0.87%) SNA
3 1 (0.87%) SSL
3 1 (0.87%) TCP/IP
Database & Business Intelligence
1 27 (23.48%) DB2
2 11 (9.57%) IDMS
3 7 (6.09%) SQL Server
4 3 (2.61%) MongoDB
4 3 (2.61%) OLTP
5 2 (1.74%) BigQuery
5 2 (1.74%) Data Hub
5 2 (1.74%) Enterprise Data Warehouse
5 2 (1.74%) SAP HANA
6 1 (0.87%) PostgreSQL
6 1 (0.87%) Relational Database
Development Applications
1 17 (14.78%) Jenkins
2 12 (10.43%) Git
3 1 (0.87%) Bitbucket
3 1 (0.87%) JIRA
General
1 60 (52.17%) Social Skills
2 13 (11.30%) Banking
3 10 (8.70%) Finance
4 5 (4.35%) Analytical Skills
5 4 (3.48%) Public Sector
6 3 (2.61%) Organisational Skills
7 1 (0.87%) Automotive
7 1 (0.87%) Financial Institution
7 1 (0.87%) Manufacturing
Job Titles
1 32 (27.83%) Programmer
2 31 (26.96%) Systems Programmer
3 24 (20.87%) z/OS Systems Programmer
4 19 (16.52%) Developer
5 18 (15.65%) Storage Manager
6 15 (13.04%) Mainframe Developer
7 11 (9.57%) IBM Mainframe Developer
7 11 (9.57%) z/OS Specialist
8 10 (8.70%) Systems Engineer
8 10 (8.70%) z/OS Engineer
9 4 (3.48%) Administrator
9 4 (3.48%) CICS Specialist
9 4 (3.48%) Hardware Engineer
9 4 (3.48%) z/OS Developer
10 3 (2.61%) Architect
10 3 (2.61%) Backend Developer
10 3 (2.61%) DB2 Administrator
10 3 (2.61%) Java Developer
10 3 (2.61%) Mainframe Systems Engineer
11 2 (1.74%) Senior Developer
Libraries, Frameworks & Software Standards
1 43 (37.39%) ISPF
2 16 (13.91%) YAML
3 4 (3.48%) Kafka
4 3 (2.61%) Middleware
5 2 (1.74%) Web Services
5 2 (1.74%) XML
5 2 (1.74%) XSLT
6 1 (0.87%) Node.js
6 1 (0.87%) RESTful
6 1 (0.87%) WebSphere MQ
Miscellaneous
1 67 (58.26%) Mainframe
2 16 (13.91%) Data Centre
3 14 (12.17%) LPAR
4 13 (11.30%) IBM Mainframe
5 4 (3.48%) Management Information System
5 4 (3.48%) Public Cloud
6 2 (1.74%) Cyber Kill Chain
6 2 (1.74%) Cyber Threat
6 2 (1.74%) Data Fabric
7 1 (0.87%) Cyberattack
7 1 (0.87%) Data Protection Act
7 1 (0.87%) Enterprise Cloud
7 1 (0.87%) Legacy Applications
Operating Systems
1 32 (27.83%) Linux
2 9 (7.83%) Windows
3 3 (2.61%) Unix
4 2 (1.74%) Red Hat Enterprise Linux
4 2 (1.74%) Windows Server
Processes & Methodologies
1 33 (28.70%) Risk Management
2 32 (27.83%) Agile
3 24 (20.87%) Stakeholder Management
3 24 (20.87%) Storage Management
4 22 (19.13%) Performance Monitoring
5 20 (17.39%) Problem Management
5 20 (17.39%) Project Management
6 15 (13.04%) Cost Management
7 14 (12.17%) Software Testing
8 12 (10.43%) Problem-Solving
8 12 (10.43%) Scrum
9 11 (9.57%) Requirements Gathering
10 10 (8.70%) Disaster Recovery
11 7 (6.09%) ETL
12 5 (4.35%) Data Security
12 5 (4.35%) Performance Tuning
13 4 (3.48%) Change Data Capture
13 4 (3.48%) Incident Response
13 4 (3.48%) Network Design
13 4 (3.48%) Reverse Engineering
Programming Languages
1 62 (53.91%) REXX
2 60 (52.17%) JCL
3 22 (19.13%) CLIST
4 20 (17.39%) COBOL
5 19 (16.52%) Assembly Language
6 16 (13.91%) Python
7 10 (8.70%) SELCOPY
8 5 (4.35%) Java
9 3 (2.61%) SQL
Qualifications
1 11 (9.57%) Security Cleared
2 9 (7.83%) SC Cleared
3 4 (3.48%) Degree
4 1 (0.87%) Azure Certification
4 1 (0.87%) BPSS Clearance
4 1 (0.87%) Computer Science Degree
4 1 (0.87%) TOGAF Certification
Quality Assurance & Compliance
1 3 (2.61%) GDPR
2 2 (1.74%) ISO/IEC 27001
2 2 (1.74%) ISO/IEC 27002 (supersedes ISO/IEC 17799)
2 2 (1.74%) NIST
3 1 (0.87%) PCI DSS
System Software
1 58 (50.43%) Time Sharing Option
2 20 (17.39%) RACF
3 19 (16.52%) ACF2
3 19 (16.52%) NFS
4 13 (11.30%) Job Entry Subsystem
4 13 (11.30%) Microcode
5 1 (0.87%) Docker
5 1 (0.87%) Virtual Machines
5 1 (0.87%) VMware Infrastructure
Systems Management
1 25 (21.74%) OMEGAMON
2 20 (17.39%) Tivoli Storage Manager
3 17 (14.78%) Ansible
4 4 (3.48%) CA Endevor
5 1 (0.87%) Kubernetes
5 1 (0.87%) Terraform
Vendors
1 82 (71.30%) IBM
2 41 (35.65%) Broadcom
3 24 (20.87%) CA
4 21 (18.26%) Dell
4 21 (18.26%) Splunk
5 19 (16.52%) Brocade
6 11 (9.57%) Syncsort
7 6 (5.22%) F5
8 3 (2.61%) Oracle
9 2 (1.74%) Databricks
9 2 (1.74%) Microsoft
9 2 (1.74%) Qualys
9 2 (1.74%) SAP
10 1 (0.87%) Dynatrace
10 1 (0.87%) SunGard
10 1 (0.87%) Teradata
10 1 (0.87%) VMware