Solar Panel Contracts in London

Solar Panel
England > London

The table below looks at the prevalence of the term Solar Panel in contract job vacancies advertised in London. Included is a benchmarking guide to the contractor rates offered in vacancies that have cited Solar Panel over the 6 months to 27 April 2024 with a comparison to the same period over the previous 2 years.

6 months to
27 Apr 2024
Same period 2023 Same period 2022
Rank 354 316 427
Rank change year-on-year -38 +111 +40
Contract jobs citing Solar Panel 40 180 184
As % of all contract jobs advertised in London 0.23% 0.66% 0.47%
As % of the Miscellaneous category 0.68% 1.85% 1.29%
Number of daily rates quoted 12 108 77
10th Percentile £630 £521 £425
25th Percentile £703 £563 £525
Median daily rate (50th Percentile) £738 £750 £600
Median % change year-on-year -1.67% +25.00% +251.91%
75th Percentile £825 £816 £725
90th Percentile - £850 £800
England median daily rate £738 £750 £600
% change year-on-year -1.67% +25.00% +251.91%
Number of hourly rates quoted 0 0 1
Median hourly rate - - £34.14
England median hourly rate - - £34.14

All Generic Skills
London

Solar Panel is in the General and Transferable Skills category. The following table is for comparison with the above and provides summary statistics for all contract job vacancies advertised in London with a requirement for generic IT skills.

Contract vacancies with a requirement for generic IT skills 5,852 9,722 14,221
As % of all contract IT jobs advertised in London 33.04% 35.90% 36.53%
Number of daily rates quoted 4,137 6,983 10,364
10th Percentile £300 £375 £400
25th Percentile £450 £500 £500
Median daily rate (50th Percentile) £575 £600 £600
Median % change year-on-year -4.17% - +10.34%
75th Percentile £725 £745 £700
90th Percentile £850 £838 £800
England median daily rate £550 £575 £550
% change year-on-year -4.35% +4.55% +10.00%
Number of hourly rates quoted 161 113 196
10th Percentile £15.50 £18.93 £18.50
25th Percentile £18.93 £21.24 £23.91
Median hourly rate £26.00 £35.00 £44.15
Median % change year-on-year -25.71% -20.72% +35.85%
75th Percentile £46.86 £64.50 £53.16
90th Percentile £67.00 £83.60 £71.55
England median hourly rate £30.00 £22.50 £26.98
% change year-on-year +33.33% -16.60% +1.24%

Solar Panel
Job Vacancy Trend in London

Job postings citing Solar Panel as a proportion of all IT jobs advertised in London.
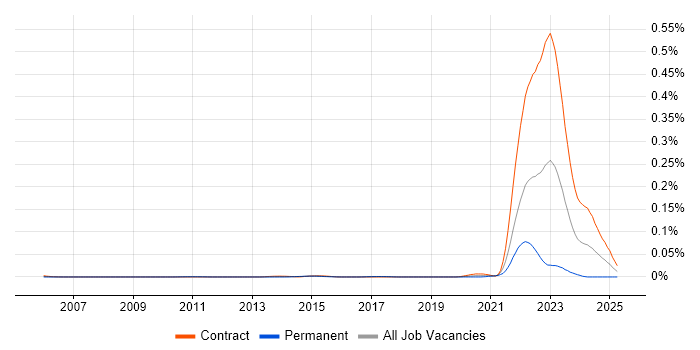
Job vacancy trend for Solar Panel in London

Solar Panel
Contractor Daily Rate Trend in London

3-month moving average daily rate quoted in jobs citing Solar Panel in London.

Daily rate trend for Solar Panel in London

Solar Panel
Daily Rate Histogram in London

Daily rate distribution for jobs citing Solar Panel in London over the 6 months to 27 April 2024.

Daily rate histogram for Solar Panel in London

Solar Panel
Co-occurring Skills and Capabilities in London by Category

The follow tables expand on the table above by listing co-occurrences grouped by category. The same employment type, locality and period is covered with up to 20 co-occurrences shown in each of the following categories:

Application Platforms
1 8 (20.00%) MTS
2 4 (10.00%) SharePoint
3 2 (5.00%) Tornado
4 1 (2.50%) BizTalk Server
Applications
1 2 (5.00%) Microsoft Excel
1 2 (5.00%) Microsoft PowerPoint
2 1 (2.50%) Microsoft Office
2 1 (2.50%) MS Visio
Business Applications
1 14 (35.00%) Aligne
2 10 (25.00%) Endur
3 8 (20.00%) EuroRunner
Cloud Services
1 16 (40.00%) Azure
2 8 (20.00%) Power Platform
3 7 (17.50%) AWS
3 7 (17.50%) GitHub
4 5 (12.50%) Azure DevOps
4 5 (12.50%) Azure Key Vault
4 5 (12.50%) Serverless
5 3 (7.50%) Azure Service Bus
6 2 (5.00%) Azure Functions
6 2 (5.00%) GitHub Actions
7 1 (2.50%) Amazon ECR
7 1 (2.50%) Amazon EKS
7 1 (2.50%) AWS Lambda
7 1 (2.50%) Azure Cosmos DB
7 1 (2.50%) Azure Data Factory
7 1 (2.50%) Azure Logic Apps
7 1 (2.50%) Azure Monitor
7 1 (2.50%) Azure Storage
7 1 (2.50%) NuGet
Database & Business Intelligence
1 8 (20.00%) Power BI
2 7 (17.50%) NoSQL
3 4 (10.00%) SQL Server
4 1 (2.50%) Amazon RDS
4 1 (2.50%) Azure SQL Database
4 1 (2.50%) Big Data
4 1 (2.50%) DynamoDB
4 1 (2.50%) MongoDB
4 1 (2.50%) Qlik Sense
Development Applications
1 5 (12.50%) Git
2 3 (7.50%) SonarQube
3 2 (5.00%) Pylint
4 1 (2.50%) CircleCI
4 1 (2.50%) JIRA
4 1 (2.50%) Mercurial
4 1 (2.50%) Team Foundation Server
4 1 (2.50%) Visual Studio Team System
4 1 (2.50%) webpack
General
1 40 (100.00%) Finance
2 39 (97.50%) Presentation Skills
2 39 (97.50%) Social Skills
3 9 (22.50%) Analytical Skills
4 4 (10.00%) Front Office
5 2 (5.00%) Banking
6 1 (2.50%) Back Office
6 1 (2.50%) Influencing Skills
6 1 (2.50%) Retail
Job Titles
1 14 (35.00%) Analyst
1 14 (35.00%) Business Analyst
2 10 (25.00%) Developer
3 7 (17.50%) Senior
4 5 (12.50%) Consultant
4 5 (12.50%) Python Developer
5 4 (10.00%) Energy Trading Developer
5 4 (10.00%) Senior Developer
5 4 (10.00%) Senior Python Developer
6 3 (7.50%) Contract Management Consultant
6 3 (7.50%) Management Consultant
6 3 (7.50%) React Developer
7 2 (5.00%) Applications Manager
7 2 (5.00%) Business Consultant
7 2 (5.00%) C# Developer
7 2 (5.00%) Functional Consultant
7 2 (5.00%) Project Manager
7 2 (5.00%) Quantitative Developer
7 2 (5.00%) Report Analyst
7 2 (5.00%) UX Developer
Libraries, Frameworks & Software Standards
1 8 (20.00%) React
2 6 (15.00%) HTML
2 6 (15.00%) WebSockets
3 5 (12.50%) Kafka
3 5 (12.50%) pytest
4 4 (10.00%) Pandas
5 3 (7.50%) Django
5 3 (7.50%) Node.js
6 2 (5.00%) .NET
6 2 (5.00%) .NET Core
6 2 (5.00%) Bokeh
6 2 (5.00%) FastAPI
6 2 (5.00%) Flask
6 2 (5.00%) HTML5
6 2 (5.00%) NumPy
6 2 (5.00%) OAuth
6 2 (5.00%) OAuth2
6 2 (5.00%) SciPy
6 2 (5.00%) SignalR
6 2 (5.00%) YAML
Miscellaneous
1 40 (100.00%) Renewable Energy
2 8 (20.00%) Market Risk
3 5 (12.50%) Cloud Native
4 4 (10.00%) Management Information System
5 3 (7.50%) Product Ownership
6 2 (5.00%) Derivative
6 2 (5.00%) Distributed Systems
6 2 (5.00%) Legacy Systems
6 2 (5.00%) Linux Command Line
7 1 (2.50%) Algorithms
7 1 (2.50%) Data Structures
7 1 (2.50%) Self-Motivation
Operating Systems
1 2 (5.00%) Linux
2 1 (2.50%) Windows
Processes & Methodologies
1 19 (47.50%) Agile
2 17 (42.50%) ETRM
3 13 (32.50%) Project Delivery
4 11 (27.50%) Business Strategy
4 11 (27.50%) CI/CD
4 11 (27.50%) Translating Business Requirements
4 11 (27.50%) Use Case
5 10 (25.00%) Problem-Solving
6 9 (22.50%) Acceptance Criteria
6 9 (22.50%) Business Analysis
6 9 (22.50%) DevOps
6 9 (22.50%) Process Improvement
7 8 (20.00%) Business Intelligence
7 8 (20.00%) Data Analysis
7 8 (20.00%) Front End Development
7 8 (20.00%) Test Strategy
8 6 (15.00%) Analytics
8 6 (15.00%) SDLC
8 6 (15.00%) Software Engineering
9 5 (12.50%) Test Automation
Programming Languages
1 22 (55.00%) SQL
2 9 (22.50%) Python
3 7 (17.50%) JavaScript
4 4 (10.00%) C++
4 4 (10.00%) Java
5 3 (7.50%) TypeScript
6 2 (5.00%) C#
6 2 (5.00%) Rust
7 1 (2.50%) Go
7 1 (2.50%) PL/SQL
7 1 (2.50%) T-SQL
Qualifications
1 5 (12.50%) Degree
Quality Assurance & Compliance
1 2 (5.00%) Accessibility
2 1 (2.50%) PMO
2 1 (2.50%) QA
2 1 (2.50%) Software Quality Assurance
System Software
1 4 (10.00%) Docker
Systems Management
1 7 (17.50%) Kubernetes
Vendors
1 3 (7.50%) Ariba
1 3 (7.50%) Databricks
2 2 (5.00%) Black Duck
2 2 (5.00%) Confluent
2 2 (5.00%) Microsoft
3 1 (2.50%) MuleSoft
3 1 (2.50%) Oracle
3 1 (2.50%) Sun