MongoDB Contracts in London

MongoDB
England > London

The following table provides summary statistics for contract job vacancies advertised in London with a requirement for MongoDB skills. Included is a benchmarking guide to the contractor rates offered in vacancies that have cited MongoDB over the 6 months to 27 April 2024 with a comparison to the same period in the previous 2 years.

6 months to
27 Apr 2024
Same period 2023 Same period 2022
Rank 235 224 175
Rank change year-on-year -11 -49 -1
Contract jobs citing MongoDB 165 311 664
As % of all contract jobs advertised in London 0.93% 1.15% 1.71%
As % of the Database & Business Intelligence category 4.36% 5.59% 7.82%
Number of daily rates quoted 120 217 500
10th Percentile £411 £463 £450
25th Percentile £525 £525 £525
Median daily rate (50th Percentile) £650 £650 £625
Median % change year-on-year - +4.00% +13.64%
75th Percentile £739 £750 £720
90th Percentile £775 £809 £800
England median daily rate £575 £600 £600
% change year-on-year -4.17% - +14.29%
Number of hourly rates quoted 2 1 3
10th Percentile £55.13 - £73.52
25th Percentile £55.31 - £74.07
Median hourly rate £56.25 £83.00 £80.00
Median % change year-on-year -32.23% +3.75% -
75th Percentile £57.81 - £85.00
90th Percentile £58.38 - -
England median hourly rate £63.75 £83.00 £62.15
% change year-on-year -23.19% +33.55% +16.71%

All Database and Business Intelligence Skills
London

MongoDB is in the Databases and Business Intelligence category. The following table is for comparison with the above and provides summary statistics for all contract job vacancies advertised in London with a requirement for database or business intelligence skills.

Contract vacancies with a requirement for database or business intelligence skills 3,788 5,567 8,492
As % of all contract IT jobs advertised in London 21.39% 20.56% 21.81%
Number of daily rates quoted 2,790 4,060 6,259
10th Percentile £377 £400 £406
25th Percentile £457 £475 £498
Median daily rate (50th Percentile) £563 £575 £585
Median % change year-on-year -2.17% -1.71% +11.43%
75th Percentile £700 £700 £700
90th Percentile £825 £800 £775
England median daily rate £525 £550 £550
% change year-on-year -4.55% - +10.00%
Number of hourly rates quoted 36 54 35
10th Percentile £20.98 £21.24 £26.25
25th Percentile £25.59 £24.94 £32.00
Median hourly rate £49.25 £52.50 £52.50
Median % change year-on-year -6.19% - +44.07%
75th Percentile £54.34 £73.44 £71.88
90th Percentile £64.14 £88.30 £82.50
England median hourly rate £40.00 £58.05 £42.50
% change year-on-year -31.09% +36.58% +70.00%

MongoDB
Job Vacancy Trend in London

Job postings citing MongoDB as a proportion of all IT jobs advertised in London.
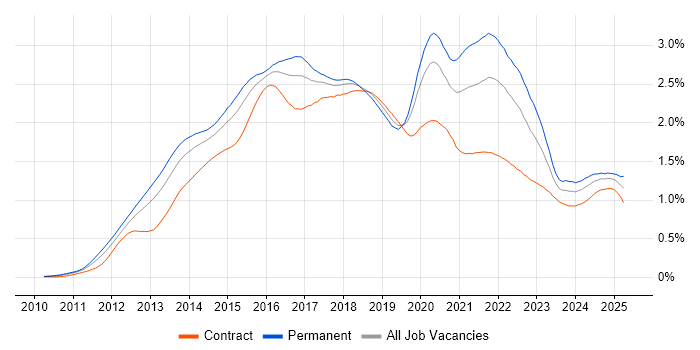
Job vacancy trend for MongoDB in London

MongoDB
Contractor Daily Rate Trend in London

3-month moving average daily rate quoted in jobs citing MongoDB in London.

Daily rate trend for MongoDB in London

MongoDB
Daily Rate Histogram in London

Daily rate distribution for jobs citing MongoDB in London over the 6 months to 27 April 2024.

Daily rate histogram for MongoDB in London

MongoDB
Contractor Hourly Rate Trend in London

3-month moving average hourly rates quoted in jobs citing MongoDB in London.

Hourly rate trend for MongoDB in London

MongoDB
Contract Job Locations in London

The table below looks at the demand and provides a guide to the median contractor rates quoted in IT jobs citing MongoDB within the London region over the 6 months to 27 April 2024. The 'Rank Change' column provides an indication of the change in demand within each location based on the same 6 month period last year.

Location Rank Change
on Same Period
Last Year
Matching
Contract
IT Job Ads
Median
Daily Rate
Past 6 Months
Median Daily Rate
% Change
on Same Period
Last Year
Live
Jobs
Central London +37 37 £680 +13.33% 21
West London +24 8 £500 +17.65% 5
South London +13 1 £475 -29.63%
East London - 1 - -
MongoDB
England

MongoDB
Co-occurring Skills and Capabilities in London by Category

The follow tables expand on the table above by listing co-occurrences grouped by category. The same employment type, locality and period is covered with up to 20 co-occurrences shown in each of the following categories:

Application Platforms
1 9 (5.45%) BizTalk Server
2 7 (4.24%) Apache Spark
3 5 (3.03%) Confluence
4 4 (2.42%) Apache
5 2 (1.21%) Apache Airflow
5 2 (1.21%) SAS
6 1 (0.61%) Apache Pulsar
6 1 (0.61%) Apache Solr
6 1 (0.61%) Ethereum
6 1 (0.61%) Hyperledger
6 1 (0.61%) JBoss
6 1 (0.61%) nginx
6 1 (0.61%) Oracle SOA Suite
6 1 (0.61%) Red Hat Fuse
6 1 (0.61%) Tomcat
Applications
1 1 (0.61%) Microsoft Office
Business Applications
1 1 (0.61%) BusinessWorks
1 1 (0.61%) Endur
Cloud Services
1 53 (32.12%) AWS
2 50 (30.30%) Azure
3 20 (12.12%) GCP
4 15 (9.09%) AWS Lambda
4 15 (9.09%) Serverless
5 14 (8.48%) Azure Cosmos DB
6 10 (6.06%) Amazon S3
7 9 (5.45%) Azure DevOps
7 9 (5.45%) Azure Functions
7 9 (5.45%) Azure Logic Apps
7 9 (5.45%) Azure Storage
7 9 (5.45%) GitHub
8 7 (4.24%) Amazon EC2
8 7 (4.24%) Amazon ECS
8 7 (4.24%) OpenShift
9 5 (3.03%) Amazon Kinesis
9 5 (3.03%) Amazon SQS
9 5 (3.03%) AWS KMS
10 4 (2.42%) Amazon Cognito
10 4 (2.42%) Google Kubernetes Engine
Communications & Networking
1 2 (1.21%) DNS
1 2 (1.21%) SMS
1 2 (1.21%) TCP/IP
2 1 (0.61%) BGP
2 1 (0.61%) DHCP
2 1 (0.61%) Ethernet VPN
2 1 (0.61%) Firewall
2 1 (0.61%) FTP
2 1 (0.61%) Kerberos
2 1 (0.61%) MPLS
2 1 (0.61%) MQTT
2 1 (0.61%) Network Security
2 1 (0.61%) Radio Access Network
2 1 (0.61%) VLAN
2 1 (0.61%) VPN
Database & Business Intelligence
1 56 (33.94%) NoSQL
2 28 (16.97%) PostgreSQL
3 21 (12.73%) SQL Server
4 18 (10.91%) MySQL
5 16 (9.70%) Apache Cassandra
6 12 (7.27%) Azure SQL Database
6 12 (7.27%) Relational Database
7 7 (4.24%) Elasticsearch
8 6 (3.64%) Amazon RDS
8 6 (3.64%) Big Data
8 6 (3.64%) DynamoDB
8 6 (3.64%) Hadoop
8 6 (3.64%) Redis
9 5 (3.03%) Data Lake
10 4 (2.42%) Amazon Athena
10 4 (2.42%) Amazon Redshift
10 4 (2.42%) Bigtable
10 4 (2.42%) Couchbase
10 4 (2.42%) Data Warehouse
10 4 (2.42%) RDBMS
Development Applications
1 24 (14.55%) Jenkins
2 23 (13.94%) Git
3 15 (9.09%) Mockito
4 8 (4.85%) TeamCity
5 7 (4.24%) JIRA
6 6 (3.64%) GitLab
7 4 (2.42%) Selenium
8 3 (1.82%) Ant
8 3 (1.82%) Bitbucket
8 3 (1.82%) Cucumber
8 3 (1.82%) Jaeger
9 2 (1.21%) Atlassian Bamboo
9 2 (1.21%) Babel
9 2 (1.21%) Liquibase
9 2 (1.21%) Maven
9 2 (1.21%) Mocha
9 2 (1.21%) SonarQube
9 2 (1.21%) Team Foundation Server
9 2 (1.21%) webpack
10 1 (0.61%) Mercurial
General
1 42 (25.45%) Social Skills
2 37 (22.42%) Analytical Skills
3 30 (18.18%) Finance
4 22 (13.33%) Banking
5 8 (4.85%) Front Office
5 8 (4.85%) Marketing
6 5 (3.03%) Investment Banking
7 4 (2.42%) Retail
8 3 (1.82%) Presentation Skills
8 3 (1.82%) Telecoms
9 2 (1.21%) Legal
9 2 (1.21%) Public Sector
10 1 (0.61%) Arabic Language
10 1 (0.61%) Back Office
10 1 (0.61%) French Language
10 1 (0.61%) German Language
10 1 (0.61%) Japanese Language
10 1 (0.61%) Korean Language
10 1 (0.61%) Law
10 1 (0.61%) Spanish Language
Job Titles
1 106 (64.24%) Developer
2 34 (20.61%) Full Stack Developer
2 34 (20.61%) Java Developer
3 27 (16.36%) Senior
4 24 (14.55%) Senior Developer
5 16 (9.70%) Senior Java Developer
6 14 (8.48%) Node.js Developer
7 13 (7.88%) React Developer
8 12 (7.27%) Site Reliability Engineer
9 11 (6.67%) Site Engineer
10 10 (6.06%) MongoDB Developer
10 10 (6.06%) Python Developer
11 9 (5.45%) Python Engineer
12 7 (4.24%) Azure Developer
12 7 (4.24%) C# Developer
13 6 (3.64%) Architect
13 6 (3.64%) DevOps Engineer
13 6 (3.64%) Java Engineer
14 5 (3.03%) Azure Engineer
14 5 (3.03%) Digital Developer
Libraries, Frameworks & Software Standards
1 47 (28.48%) Kafka
2 36 (21.82%) HTML
2 36 (21.82%) Node.js
2 36 (21.82%) React
3 33 (20.00%) CSS
4 24 (14.55%) RESTful
5 20 (12.12%) .NET
6 18 (10.91%) ActiveMQ
7 16 (9.70%) RabbitMQ
8 15 (9.09%) JAX-RS
8 15 (9.09%) Web Services
9 14 (8.48%) AngularJS
9 14 (8.48%) Express.js
9 14 (8.48%) MERN Stack
10 13 (7.88%) .NET Core
10 13 (7.88%) Spring
11 10 (6.06%) Blazor
11 10 (6.06%) NestJS
11 10 (6.06%) REST
12 9 (5.45%) HTML5
Miscellaneous
1 16 (9.70%) Distributed Systems
2 12 (7.27%) Algorithms
2 12 (7.27%) Cloud Native
3 11 (6.67%) Data Structures
4 10 (6.06%) Self-Motivation
5 8 (4.85%) Legacy Systems
6 7 (4.24%) Greenfield Project
7 6 (3.64%) Hedge funds
8 5 (3.03%) Data Protection Act
8 5 (3.03%) Enterprise Software
9 4 (2.42%) Fixed Income
10 3 (1.82%) Distributed Computing
10 3 (1.82%) Replication
11 2 (1.21%) Cyber Threat
11 2 (1.21%) Linux Command Line
11 2 (1.21%) PKI
12 1 (0.61%) Driving Licence
12 1 (0.61%) Hybrid Cloud
12 1 (0.61%) Public Cloud
12 1 (0.61%) Reinsurance
Operating Systems
1 44 (26.67%) Linux
2 24 (14.55%) Unix
3 19 (11.52%) Windows
4 14 (8.48%) Mac OS X
5 2 (1.21%) Android
5 2 (1.21%) Apple iOS
5 2 (1.21%) Red Hat Enterprise Linux
5 2 (1.21%) Windows Server
6 1 (0.61%) CentOS
6 1 (0.61%) Mac OS
6 1 (0.61%) Windows Mobile
6 1 (0.61%) Windows Server 2016
6 1 (0.61%) zOS
Processes & Methodologies
1 72 (43.64%) Agile
2 66 (40.00%) Microservices
3 60 (36.36%) CI/CD
4 43 (26.06%) Problem-Solving
5 42 (25.45%) DevOps
6 41 (24.85%) Full Stack Development
7 33 (20.00%) Test Automation
8 30 (18.18%) TDD
9 21 (12.73%) Web Development
10 19 (11.52%) Front End Development
11 18 (10.91%) BDD
11 18 (10.91%) Clean Code
11 18 (10.91%) Continuous Improvement
11 18 (10.91%) SDLC
11 18 (10.91%) Software Engineering
12 17 (10.30%) Code Quality
12 17 (10.30%) Continuous Integration
13 16 (9.70%) Scrum
14 15 (9.09%) Continuous Deployment
15 14 (8.48%) Responsive Web Design
Programming Languages
1 66 (40.00%) Java
2 62 (37.58%) SQL
3 58 (35.15%) JavaScript
4 52 (31.52%) Python
5 20 (12.12%) C++
6 17 (10.30%) C#
6 17 (10.30%) Go
7 16 (9.70%) TypeScript
8 15 (9.09%) Shell Script
9 10 (6.06%) T-SQL
10 9 (5.45%) PL/SQL
10 9 (5.45%) Scala
11 8 (4.85%) Groovy
12 7 (4.24%) PowerShell
13 3 (1.82%) Bash
13 3 (1.82%) C
13 3 (1.82%) PHP
13 3 (1.82%) Ruby
14 2 (1.21%) Perl
14 2 (1.21%) U-SQL
Qualifications
1 24 (14.55%) Security Cleared
2 21 (12.73%) SC Cleared
3 16 (9.70%) Degree
4 10 (6.06%) Computer Science Degree
5 1 (0.61%) Azure Certification
5 1 (0.61%) DV Cleared
5 1 (0.61%) Master's Degree
5 1 (0.61%) SANS
Quality Assurance & Compliance
1 3 (1.82%) GDPR
2 2 (1.21%) Data Quality
2 2 (1.21%) QA
3 1 (0.61%) HIPAA
3 1 (0.61%) ISO 20022
3 1 (0.61%) MiFID
3 1 (0.61%) NIST
3 1 (0.61%) SLA
System Software
1 29 (17.58%) Docker
2 11 (6.67%) Apache ZooKeeper
3 2 (1.21%) Virtual Machines
4 1 (0.61%) Apache Flume
4 1 (0.61%) iptables
4 1 (0.61%) VMware Infrastructure
4 1 (0.61%) vSphere
Systems Management
1 50 (30.30%) Kubernetes
2 27 (16.36%) Grafana
3 22 (13.33%) Prometheus
4 11 (6.67%) Consul
5 9 (5.45%) Ansible
6 7 (4.24%) Terraform
7 3 (1.82%) Kibana
8 2 (1.21%) Ambari
8 2 (1.21%) logstash
8 2 (1.21%) Oozie
9 1 (0.61%) Argo
9 1 (0.61%) Docker Swarm
9 1 (0.61%) Ganglia
9 1 (0.61%) Istio
9 1 (0.61%) Oracle Enterprise Manager
9 1 (0.61%) Progress Chef
9 1 (0.61%) Puppet
9 1 (0.61%) TIBCO Hawk
Vendors
1 31 (18.79%) Oracle
2 19 (11.52%) Microsoft
3 11 (6.67%) SaltStack
4 9 (5.45%) Google
4 9 (5.45%) MuleSoft
5 8 (4.85%) Splunk
6 4 (2.42%) Databricks
6 4 (2.42%) Informatica
7 3 (1.82%) AppDynamics
7 3 (1.82%) Solace
7 3 (1.82%) Talend
8 2 (1.21%) Ab Initio
8 2 (1.21%) Atlassian
8 2 (1.21%) BiZZdesign
8 2 (1.21%) CyberArk
8 2 (1.21%) IBM
8 2 (1.21%) New Relic
8 2 (1.21%) Teradata
8 2 (1.21%) TIBCO
8 2 (1.21%) VMware