Master's Degree Contract Job Trends in London

Master's Degree
England > London

The table below provides summary statistics for contract job vacancies advertised in London with a requirement for Master's Degree qualifications. It includes a benchmarking guide to the contractor rates offered over the 6 months leading up to 14 October 2025, comparing them to the same period in the previous two years.

6 months to
14 Oct 2025
Same period 2024 Same period 2023
Rank 215 189 239
Rank change year-on-year -26 +50 +57
Contract jobs citing Master's Degree 149 214 208
As % of all contract jobs in London 1.11% 1.34% 1.00%
As % of the Qualifications category 4.16% 5.33% 4.36%
Number of daily rates quoted 92 133 153
10th Percentile £405 £350 £400
25th Percentile £447 £460 £563
Median daily rate (50th Percentile) £575 £538 £700
Median % change year-on-year +6.98% -23.21% -2.78%
75th Percentile £681 £700 £950
90th Percentile £809 £863 £1,000
England median daily rate £525 £531 £650
% change year-on-year -1.04% -18.38% -
Number of hourly rates quoted 4 3 3
10th Percentile - £42.25 £57.50
25th Percentile £65.00 £43.75 £59.38
Median hourly rate £73.75 £47.50 £65.00
Median % change year-on-year +55.26% -26.92% +28.71%
75th Percentile £86.25 £58.38 £66.25
90th Percentile - £64.15 £67.00
England median hourly rate £33.50 £41.25 £65.00
% change year-on-year -18.79% -36.54% +44.44%

All Academic and Professional Certifications
London

Master's Degree falls under the Academic Qualifications and Professional Certifications category. For comparison with the information above, the following table provides summary statistics for all contract job vacancies requiring academic qualifications or professional certifications in London.

Contract vacancies requiring academic qualifications or professional certifications 3,582 4,014 4,770
As % of all contract IT jobs advertised in London 26.74% 25.10% 22.99%
Number of daily rates quoted 2,416 2,558 3,285
10th Percentile £358 £350 £355
25th Percentile £438 £450 £456
Median daily rate (50th Percentile) £538 £538 £550
Median % change year-on-year - -2.27% -4.35%
75th Percentile £651 £650 £675
90th Percentile £738 £765 £788
England median daily rate £525 £525 £550
% change year-on-year - -4.55% -
Number of hourly rates quoted 85 64 94
10th Percentile £18.87 £18.13 £19.33
25th Percentile - £25.93 £20.63
Median hourly rate £25.15 £36.65 £54.00
Median % change year-on-year -31.38% -32.13% +18.03%
75th Percentile £35.00 £56.38 £65.08
90th Percentile £65.00 £75.88 £83.63
England median hourly rate £25.15 £52.50 £53.67
% change year-on-year -52.10% -2.17% +19.26%

Master's Degree
Job Vacancy Trend in London

Historical trend showing the proportion of contract IT job postings citing Master's Degree relative to all contract IT jobs advertised in London.

Master's Degree job vacancy trend in London

Master's Degree
Daily Rate Trend in London

Contractor daily rate distribution trend for jobs in London citing Master's Degree.
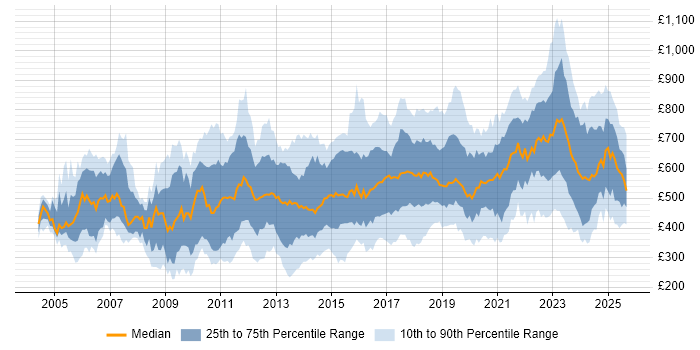
Contractor daily rate distribution trend for jobs in London citing Master's Degree

Master's Degree
Daily Rate Histogram in London

Daily rate distribution for jobs citing Master's Degree in London over the 6 months to 14 October 2025.

Daily rate histogram for Master's Degree in London

Master's Degree
Hourly Rate Trend in London

Contractor hourly rate distribution trend for jobs in London citing Master's Degree.

Contractor hourly rate distribution trend for jobs in London citing Master's Degree

Master's Degree
Hourly Rate Histogram in London

Hourly rate distribution of jobs citing Master's Degree in London over the 6 months to 14 October 2025.

Hourly rate histogram for Master's Degree in London

Master's Degree
Contract Job Locations in London

The table below looks at the demand and provides a guide to the median contractor rates quoted in IT jobs citing Master's Degree within the London region over the 6 months to 14 October 2025. The 'Rank Change' column provides an indication of the change in demand within each location based on the same 6 month period last year.

Location Rank Change
on Same Period
Last Year
Matching
Contract
IT Job Ads
Median
Daily Rate
Past 6 Months
Median Daily Rate
% Change
on Same Period
Last Year
Live
Jobs
Central London -10 14 £550 +4.76% 89
East London +5 3 £1,000 +114.59% 8
West London -2 3 £350 +68.27% 5
Master's Degree
England

Master's Degree
Co-Occurring Skills & Capabilities in London by Category

The following tables expand on the one above by listing co-occurrences grouped by category. They cover the same employment type, locality and period, with up to 20 co-occurrences shown in each category:

Application Platforms
1 17 (11.41%) Apache Spark
2 2 (1.34%) Confluence
2 2 (1.34%) Ethereum
2 2 (1.34%) Hyperledger
2 2 (1.34%) Jupyter
3 1 (0.67%) Apache Airflow
3 1 (0.67%) Moodle
3 1 (0.67%) MQSeries
3 1 (0.67%) NetWeaver
3 1 (0.67%) SAP Portal
3 1 (0.67%) SAS
3 1 (0.67%) Tomcat
3 1 (0.67%) WebSphere
Applications
1 7 (4.70%) Microsoft Excel
2 2 (1.34%) Microsoft Office
2 2 (1.34%) Microsoft PowerPoint
2 2 (1.34%) Microsoft Project
3 1 (0.67%) Adobe Creative Suite
3 1 (0.67%) Camtasia
3 1 (0.67%) InVision
3 1 (0.67%) MS Visio
3 1 (0.67%) Navisworks
3 1 (0.67%) ProjectWise
3 1 (0.67%) Revit
3 1 (0.67%) Sketch
Business Applications
1 6 (4.03%) SAP S/4HANA
2 3 (2.01%) Endur
2 3 (2.01%) SAP IBP
3 1 (0.67%) SAP FI-CA
3 1 (0.67%) Workday HCM
Cloud Services
1 41 (27.52%) Azure
2 40 (26.85%) AWS
3 20 (13.42%) GCP
4 10 (6.71%) GitHub
5 8 (5.37%) Azure DevOps
5 8 (5.37%) GitHub Actions
5 8 (5.37%) Power Platform
6 4 (2.68%) Amazon SageMaker
6 4 (2.68%) Cloud Computing
6 4 (2.68%) Miro
6 4 (2.68%) SaaS
6 4 (2.68%) Sentry
6 4 (2.68%) Vertex AI
7 3 (2.01%) Amazon ECS
7 3 (2.01%) Amazon S3
7 3 (2.01%) Azure Data Factory
7 3 (2.01%) Azure Machine Learning
8 2 (1.34%) Collibra
8 2 (1.34%) Salesforce Sales Cloud
8 2 (1.34%) Salesforce Service Cloud
Communications & Networking
1 4 (2.68%) HTTP
1 4 (2.68%) Network Security
2 2 (1.34%) S/MIME
2 2 (1.34%) SSL
3 1 (0.67%) 4G
3 1 (0.67%) 5G
3 1 (0.67%) Firewall
3 1 (0.67%) Intrusion Detection
3 1 (0.67%) LTE
3 1 (0.67%) PPP
3 1 (0.67%) TETRA
Database & Business Intelligence
1 9 (6.04%) Big Data
1 9 (6.04%) Tableau
2 8 (5.37%) Power BI
3 7 (4.70%) Data Warehouse
3 7 (4.70%) NoSQL
3 7 (4.70%) SQL Server
4 5 (3.36%) Hadoop
4 5 (3.36%) MongoDB
5 4 (2.68%) Data Mining
5 4 (2.68%) Metadata
6 3 (2.01%) Apache Hive
6 3 (2.01%) BigQuery
6 3 (2.01%) Data Lake
6 3 (2.01%) PostgreSQL
7 2 (1.34%) Amazon Athena
7 2 (1.34%) Amazon RDS
7 2 (1.34%) Delta Lake
7 2 (1.34%) MySQL
7 2 (1.34%) SAP BW
7 2 (1.34%) SAP HANA
Development Applications
1 7 (4.70%) Git
2 6 (4.03%) MLflow
3 5 (3.36%) JIRA
3 5 (3.36%) TeamCity
4 4 (2.68%) Appium
4 4 (2.68%) Charles Proxy
4 4 (2.68%) IntelliJ
4 4 (2.68%) Jenkins
4 4 (2.68%) Katalon Studio
4 4 (2.68%) Postman
4 4 (2.68%) XCUITest
5 3 (2.01%) GitLab
6 2 (1.34%) ERwin
6 2 (1.34%) Hardhat
6 2 (1.34%) PowerDesigner
7 1 (0.67%) Bitbucket
7 1 (0.67%) Gatling
7 1 (0.67%) JMeter
7 1 (0.67%) LoadRunner
7 1 (0.67%) Visual Studio
General
1 75 (50.34%) Finance
2 60 (40.27%) Social Skills
3 37 (24.83%) Analytical Skills
4 23 (15.44%) Banking
5 17 (11.41%) Front Office
6 12 (8.05%) Telecoms
7 9 (6.04%) Investment Banking
8 8 (5.37%) Legal
8 8 (5.37%) Manufacturing
9 7 (4.70%) Financial Institution
9 7 (4.70%) Marketing
10 6 (4.03%) Pharmaceutical
10 6 (4.03%) Public Sector
11 5 (3.36%) Back Office
11 5 (3.36%) Documentation Skills
11 5 (3.36%) Influencing Skills
12 4 (2.68%) Electronics
12 4 (2.68%) Retail
13 3 (2.01%) Presentation Skills
13 3 (2.01%) Publishing
Job Titles
1 23 (15.44%) Analyst
1 23 (15.44%) Developer
2 18 (12.08%) Senior
3 16 (10.74%) Lead
4 15 (10.07%) Architect
5 14 (9.40%) Machine Learning Engineer
6 12 (8.05%) Business Analyst
7 9 (6.04%) Data Scientist
8 8 (5.37%) Project Manager
9 6 (4.03%) AWS Engineer
10 5 (3.36%) Azure Architect
10 5 (3.36%) Consultant
10 5 (3.36%) Python Developer
10 5 (3.36%) Quantitative Developer
11 4 (2.68%) C# Developer
11 4 (2.68%) Quantitative Analyst
11 4 (2.68%) Senior C# Developer
11 4 (2.68%) Solutions Architect
11 4 (2.68%) Telecoms Analyst
11 4 (2.68%) Telecoms Business Analyst
Libraries, Frameworks & Software Standards
1 15 (10.07%) TensorFlow
2 12 (8.05%) .NET
2 12 (8.05%) PyTorch
3 8 (5.37%) Kafka
3 8 (5.37%) PySpark
3 8 (5.37%) REST
4 7 (4.70%) RESTful
4 7 (4.70%) Web Services
5 5 (3.36%) Hugging Face
5 5 (3.36%) NumPy
6 4 (2.68%) HTML
6 4 (2.68%) LangChain
6 4 (2.68%) Middleware
6 4 (2.68%) Pandas
6 4 (2.68%) RabbitMQ
7 3 (2.01%) AngularJS
7 3 (2.01%) CSS
7 3 (2.01%) FIX Protocol
7 3 (2.01%) SAML
7 3 (2.01%) SOAP
Miscellaneous
1 17 (11.41%) Derivative
2 14 (9.40%) Algorithms
2 14 (9.40%) Distributed Computing
2 14 (9.40%) Product Ownership
3 9 (6.04%) Equity Derivative
4 8 (5.37%) Data Protection Act
4 8 (5.37%) Management Information System
5 7 (4.70%) Cloud Native
5 7 (4.70%) Distributed Systems
6 6 (4.03%) Analytical Mindset
6 6 (4.03%) Equities
6 6 (4.03%) Hedge funds
6 6 (4.03%) PMI
7 5 (3.36%) Credit Risk
7 5 (3.36%) Data Fabric
7 5 (3.36%) Fixed Income
7 5 (3.36%) Foreign Exchange (FX)
7 5 (3.36%) Mobile App
7 5 (3.36%) Virtual Team
8 4 (2.68%) Self-Motivation
Operating Systems
1 4 (2.68%) Android
1 4 (2.68%) Apple iOS
2 3 (2.01%) Linux
3 2 (1.34%) Windows
4 1 (0.67%) Unix
4 1 (0.67%) Windows Server
Processes & Methodologies
1 93 (62.42%) Computer Science
2 47 (31.54%) Problem-Solving
3 46 (30.87%) Agile
4 38 (25.50%) AI
4 38 (25.50%) Machine Learning
5 36 (24.16%) Analytics
6 29 (19.46%) Risk Management
7 28 (18.79%) Data Science
7 28 (18.79%) DevOps
7 28 (18.79%) Mathematics
8 25 (16.78%) Stakeholder Management
9 23 (15.44%) Stakeholder Engagement
10 21 (14.09%) Data Governance
11 20 (13.42%) CI/CD
11 20 (13.42%) Generative AI
11 20 (13.42%) LLM
11 20 (13.42%) Roadmaps
12 17 (11.41%) Project Management
12 17 (11.41%) Technical Leadership
13 16 (10.74%) Data Engineering
Programming Languages
1 63 (42.28%) Python
2 36 (24.16%) SQL
3 18 (12.08%) C++
4 17 (11.41%) Java
5 8 (5.37%) C#
5 8 (5.37%) JavaScript
6 6 (4.03%) R
7 5 (3.36%) C
8 4 (2.68%) Bash
8 4 (2.68%) Kotlin
8 4 (2.68%) PowerShell
8 4 (2.68%) Swift
9 3 (2.01%) Bicep
9 3 (2.01%) TypeScript
9 3 (2.01%) VBA
10 2 (1.34%) Apex Code
10 2 (1.34%) PHP
10 2 (1.34%) Shell Script
10 2 (1.34%) Solidity
10 2 (1.34%) SystemVerilog
Qualifications
1 149 (100.00%) Degree
2 45 (30.20%) Computer Science Degree
3 33 (22.15%) PhD
4 18 (12.08%) PMI Certification
5 14 (9.40%) PMP
6 10 (6.71%) MBA
7 6 (4.03%) CISSP
8 5 (3.36%) CBAP
9 4 (2.68%) AWS Certification
9 4 (2.68%) SAP Certification
10 3 (2.01%) Azure Certification
10 3 (2.01%) Microsoft Certification
10 3 (2.01%) TOGAF Certification
11 2 (1.34%) (ISC)2 CCSP
11 2 (1.34%) AWS Certified Solutions Architect
11 2 (1.34%) CCSP
11 2 (1.34%) Cisco Certification
11 2 (1.34%) CISM
11 2 (1.34%) Security Cleared
12 1 (0.67%) DV Cleared
Quality Assurance & Compliance
1 14 (9.40%) GDPR
2 13 (8.72%) QA
3 12 (8.05%) Data Quality
4 7 (4.70%) Accessibility
5 6 (4.03%) GRC
5 6 (4.03%) ISO/IEC 27001
6 5 (3.36%) HIPAA
7 4 (2.68%) California Consumer Privacy Act
7 4 (2.68%) NIST
8 3 (2.01%) GMP
8 3 (2.01%) PCI DSS
9 2 (1.34%) Actionable Recommendations
9 2 (1.34%) SLA
10 1 (0.67%) 21 CFR Part 11
10 1 (0.67%) Cyber Essentials
10 1 (0.67%) FINRA
10 1 (0.67%) GAMP
10 1 (0.67%) GxP
10 1 (0.67%) ISO 19650
10 1 (0.67%) Sarbanes-Oxley
System Software
1 18 (12.08%) Docker
2 2 (1.34%) Firmware
2 2 (1.34%) Virtual Machines
Systems Management
1 17 (11.41%) Kubernetes
2 9 (6.04%) Terraform
3 3 (2.01%) Single Sign-On
4 2 (1.34%) Ansible
4 2 (1.34%) Grafana
4 2 (1.34%) Kubeflow
5 1 (0.67%) Prometheus
5 1 (0.67%) QRadar
5 1 (0.67%) ZABBIX
Vendors
1 17 (11.41%) SAP
2 12 (8.05%) Databricks
2 12 (8.05%) Microsoft
3 7 (4.70%) Splunk
4 6 (4.03%) Oracle
5 3 (2.01%) Adobe
5 3 (2.01%) Google
5 3 (2.01%) IBM
5 3 (2.01%) Informatica
5 3 (2.01%) Murex
5 3 (2.01%) OpenAI
6 2 (1.34%) Calypso
6 2 (1.34%) CyberArk
6 2 (1.34%) Dynatrace
6 2 (1.34%) Hitachi
6 2 (1.34%) ION Trading
6 2 (1.34%) OpenLink
6 2 (1.34%) Salesforce
6 2 (1.34%) Workday
7 1 (0.67%) AppDynamics