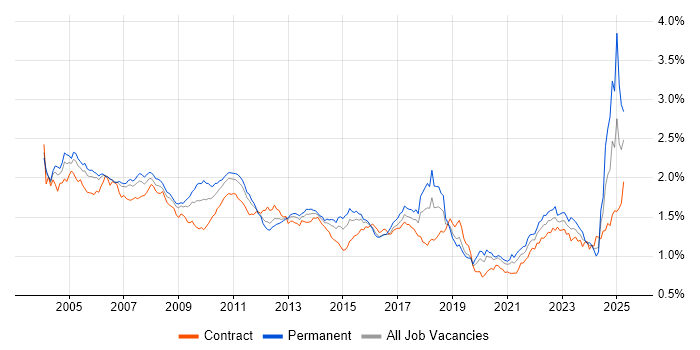
Financial Institution Contract Job Trends in London

Financial Institution
England > London

The table below looks at the prevalence of the term Financial Institution in contract job vacancies in London. Included is a benchmarking guide to the contractor rates offered in vacancies that cited Financial Institution over the 6 months leading up to 18 September 2025, comparing them to the same period in the previous two years.

6 months to
18 Sep 2025
Same period 2024 Same period 2023
Rank 152 212 199
Rank change year-on-year +60 -13 +35
Contract jobs citing Financial Institution 237 184 271
As % of all contract jobs advertised in London 1.76% 1.13% 1.25%
As % of the General category 2.55% 1.82% 1.93%
Number of daily rates quoted 165 117 189
10th Percentile £425 £400 £473
25th Percentile £550 £538 £515
Median daily rate (50th Percentile) £675 £600 £645
Median % change year-on-year +12.50% -6.98% +12.17%
75th Percentile £775 £700 £775
90th Percentile £933 £797 £875
England median daily rate £619 £594 £600
% change year-on-year +4.17% -1.04% +9.09%

All General Skills
London

Financial Institution falls under the General Skills category. For comparison with the information above, the following table provides summary statistics for all contract job vacancies requiring common skills in London.

Contract vacancies with a requirement for common skills 9,311 10,130 14,019
As % of all contract IT jobs advertised in London 69.24% 62.19% 64.41%
Number of daily rates quoted 6,148 6,727 10,238
10th Percentile £325 £330 £363
25th Percentile £425 £450 £475
Median daily rate (50th Percentile) £550 £575 £600
Median % change year-on-year -4.35% -4.17% -
75th Percentile £675 £700 £703
90th Percentile £790 £825 £810
England median daily rate £500 £538 £550
% change year-on-year -6.98% -2.27% -
Number of hourly rates quoted 184 121 174
10th Percentile £17.00 £18.00 £17.98
25th Percentile £24.65 £24.50 £20.00
Median hourly rate £32.50 £35.00 £29.75
Median % change year-on-year -7.14% +17.65% -16.20%
75th Percentile £49.75 £53.75 £54.88
90th Percentile £65.00 £66.00 £70.00
England median hourly rate £25.15 £38.85 £27.50
% change year-on-year -35.26% +41.27% +10.93%

Financial Institution
Job Vacancy Trend in London

Job postings citing Financial Institution as a proportion of all IT jobs advertised in London.

Job vacancy trend for Financial Institution in London

Financial Institution
Daily Rate Trend in London

Contractor daily rate distribution trend for jobs in London citing Financial Institution.

Contractor daily rate distribution trend for jobs in London citing Financial Institution

Financial Institution
Daily Rate Histogram in London

Daily rate distribution for jobs citing Financial Institution in London over the 6 months to 18 September 2025.

Daily rate histogram for Financial Institution in London

Financial Institution
Hourly Rate Trend in London

Contractor hourly rate distribution trend for jobs in London citing Financial Institution.

Contractor hourly rate distribution trend for jobs in London citing Financial Institution

Financial Institution
Contract Job Locations in London

The table below looks at the demand and provides a guide to the median contractor rates quoted in IT jobs citing Financial Institution within the London region over the 6 months to 18 September 2025. The 'Rank Change' column provides an indication of the change in demand within each location based on the same 6 month period last year.

Location Rank Change
on Same Period
Last Year
Matching
Contract
IT Job Ads
Median
Daily Rate
Past 6 Months
Median Daily Rate
% Change
on Same Period
Last Year
Live
Jobs
Central London +21 53 £725 +9.93% 47
East London +15 9 £1,000 +66.67% 4
South London -3 4 £625 - 4
Financial Institution
England

Financial Institution
Co-occurring Skills and Capabilities in London by Category

The follow tables expand on the table above by listing co-occurrences grouped by category. The same employment type, locality and period is covered with up to 20 co-occurrences shown in each of the following categories:

Application Platforms
1 6 (2.53%) Apache Spark
1 6 (2.53%) SharePoint
2 3 (1.27%) Confluence
2 3 (1.27%) Microsoft Exchange
3 2 (0.84%) Apache
3 2 (0.84%) CMS
3 2 (0.84%) MQSeries
3 2 (0.84%) SAS
4 1 (0.42%) IBM Transformation Extender
4 1 (0.42%) Oracle Workflow
Applications
1 14 (5.91%) Microsoft Office
2 11 (4.64%) Microsoft Excel
3 4 (1.69%) Microsoft Project
4 3 (1.27%) Microsoft PowerPoint
4 3 (1.27%) MS Visio
5 2 (0.84%) Adobe Illustrator
5 2 (0.84%) Photoshop
6 1 (0.42%) Spreadsheet
Business Applications
1 4 (1.69%) ION Anvil
2 3 (1.27%) ION MarketView
3 2 (0.84%) Oracle 11i
4 1 (0.42%) Aladdin
4 1 (0.42%) Avolution ABACUS
4 1 (0.42%) Endur
4 1 (0.42%) Fidessa
4 1 (0.42%) Loan IQ
4 1 (0.42%) Oracle Assets
4 1 (0.42%) Oracle EBS
4 1 (0.42%) Oracle EBS R12
4 1 (0.42%) Oracle General Ledger
4 1 (0.42%) Oracle Payables
4 1 (0.42%) Oracle Procure-to-Pay
4 1 (0.42%) SAP S/4HANA
4 1 (0.42%) Summit
4 1 (0.42%) thinkFolio
Cloud Services
1 41 (17.30%) Azure
2 16 (6.75%) GCP
3 13 (5.49%) AWS
4 8 (3.38%) Power Platform
4 8 (3.38%) SaaS
5 6 (2.53%) IaaS
5 6 (2.53%) OpenShift
5 6 (2.53%) PaaS
5 6 (2.53%) Snowflake
6 5 (2.11%) Cloud Computing
6 5 (2.11%) Collibra
7 4 (1.69%) Azure DevOps
8 3 (1.27%) Azure API Management
8 3 (1.27%) Azure Sentinel
8 3 (1.27%) dbt
8 3 (1.27%) IBM Blueworks
8 3 (1.27%) Microsoft 365
8 3 (1.27%) Microsoft Copilot
9 2 (0.84%) GitHub
9 2 (0.84%) Google Workspace
Communications & Networking
1 8 (3.38%) HTTP
1 8 (3.38%) Network Security
2 6 (2.53%) Firewall
2 6 (2.53%) TCP/IP
3 4 (1.69%) SSL
4 2 (0.84%) Cisco ASA
4 2 (0.84%) VSAN
5 1 (0.42%) DHCP
5 1 (0.42%) DNS
5 1 (0.42%) HTTPS
Database & Business Intelligence
1 10 (4.22%) SQL Server
2 7 (2.95%) Power BI
2 7 (2.95%) Relational Database
3 6 (2.53%) NoSQL
3 6 (2.53%) Oracle Database
3 6 (2.53%) Tableau
4 5 (2.11%) Big Data
4 5 (2.11%) Hadoop
5 4 (1.69%) Data Mart
5 4 (1.69%) Data Warehouse
5 4 (1.69%) SQL Server Integration Services
5 4 (1.69%) SQL Server Reporting Services
6 3 (1.27%) Data Hub
6 3 (1.27%) Elasticsearch
6 3 (1.27%) Tableau Desktop
7 2 (0.84%) BigQuery
7 2 (0.84%) Data Lake
7 2 (0.84%) Delta Lake
7 2 (0.84%) Kdb+
7 2 (0.84%) Parquet
Development Applications
1 10 (4.22%) Git
2 7 (2.95%) JIRA
3 4 (1.69%) JUnit
3 4 (1.69%) Robot Framework
4 3 (1.27%) Ant
4 3 (1.27%) SoapUI
4 3 (1.27%) Toad
5 2 (0.84%) Bitbucket Server
5 2 (0.84%) Jenkins
5 2 (0.84%) Maven
6 1 (0.42%) AppScan
6 1 (0.42%) Artifactory
6 1 (0.42%) Bitbucket
6 1 (0.42%) GitLab
6 1 (0.42%) Gradle
6 1 (0.42%) Oracle Forms
6 1 (0.42%) Postman
6 1 (0.42%) QUnit
6 1 (0.42%) Snyk
6 1 (0.42%) Xcode
General
1 237 (100.00%) Finance
2 104 (43.88%) Social Skills
3 95 (40.08%) Banking
4 55 (23.21%) Analytical Skills
5 27 (11.39%) Front Office
6 21 (8.86%) Investment Banking
7 15 (6.33%) Presentation Skills
8 9 (3.80%) Corporate Banking
8 9 (3.80%) Legal
9 6 (2.53%) International Banking
10 5 (2.11%) Retail
11 4 (1.69%) Back Office
11 4 (1.69%) Documentation Skills
11 4 (1.69%) Marketing
11 4 (1.69%) Organisational Skills
11 4 (1.69%) Retail Banking
12 3 (1.27%) General Ledger
13 2 (0.84%) Law
13 2 (0.84%) Private Banking
14 1 (0.42%) Japanese Language
Job Titles
1 54 (22.78%) Developer
2 44 (18.57%) Analyst
3 32 (13.50%) Business Analyst
4 29 (12.24%) Architect
5 19 (8.02%) Senior
6 16 (6.75%) Project Manager
7 13 (5.49%) Lead
8 11 (4.64%) Enterprise Architect
9 8 (3.38%) Security Architect
10 7 (2.95%) C# Developer
10 7 (2.95%) IT Manager
10 7 (2.95%) Java Developer
10 7 (2.95%) Python Developer
10 7 (2.95%) SailPoint Developer
10 7 (2.95%) Senior Architect
11 6 (2.53%) Data Business Analyst
11 6 (2.53%) Security Engineer
12 5 (2.11%) Data Analyst
12 5 (2.11%) Infrastructure Engineer
12 5 (2.11%) Quantitative Developer
Libraries, Frameworks & Software Standards
1 10 (4.22%) SailPoint
2 9 (3.80%) .NET
3 8 (3.38%) React
3 8 (3.38%) REST
4 7 (2.95%) Kafka
4 7 (2.95%) Middleware
4 7 (2.95%) XML
5 6 (2.53%) CSS
6 5 (2.11%) HTML
6 5 (2.11%) Node.js
7 4 (1.69%) .NET Core
7 4 (1.69%) FIX Protocol
7 4 (1.69%) IBM Integration Bus
7 4 (1.69%) JSON
7 4 (1.69%) SOAP
7 4 (1.69%) Spring
7 4 (1.69%) Spring Boot
8 3 (1.27%) Electron
8 3 (1.27%) JNI
8 3 (1.27%) PySpark
Miscellaneous
1 19 (8.02%) Fixed Income
1 19 (8.02%) Foreign Exchange (FX)
2 17 (7.17%) Hedge funds
3 12 (5.06%) Algorithms
3 12 (5.06%) Derivative
3 12 (5.06%) Onboarding
3 12 (5.06%) Self-Motivation
4 9 (3.80%) Credit Risk
5 8 (3.38%) Security Posture
6 7 (2.95%) Data Structures
6 7 (2.95%) Product Ownership
7 6 (2.53%) Data Protection Act
7 6 (2.53%) Management Information System
8 5 (2.11%) Cloud Native
8 5 (2.11%) Equities
8 5 (2.11%) Equity Derivative
8 5 (2.11%) Market Risk
8 5 (2.11%) SWIFT Messaging Network
9 4 (1.69%) Enterprise Cloud
9 4 (1.69%) Private Cloud
Operating Systems
1 29 (12.24%) Linux
2 23 (9.70%) Unix
3 20 (8.44%) Windows
4 6 (2.53%) Red Hat Enterprise Linux
5 5 (2.11%) CentOS
6 3 (1.27%) AIX
6 3 (1.27%) Mac OS
7 2 (0.84%) Apple iOS
7 2 (0.84%) Solaris
7 2 (0.84%) VMS
8 1 (0.42%) Android
8 1 (0.42%) Windows 10
8 1 (0.42%) Windows Server
Processes & Methodologies
1 53 (22.36%) Problem-Solving
2 48 (20.25%) Agile
3 30 (12.66%) Analytics
4 26 (10.97%) Stakeholder Engagement
5 24 (10.13%) Decision-Making
6 23 (9.70%) Migration
6 23 (9.70%) Project Management
6 23 (9.70%) Risk Management
6 23 (9.70%) Stakeholder Management
7 21 (8.86%) CI/CD
7 21 (8.86%) Regulatory Compliance
8 20 (8.44%) Computer Science
9 19 (8.02%) Cybersecurity
9 19 (8.02%) Data Governance
10 18 (7.59%) Scrum
10 18 (7.59%) SDLC
10 18 (7.59%) Wealth Management
11 17 (7.17%) Business Analysis
11 17 (7.17%) Roadmaps
12 16 (6.75%) AOP
Programming Languages
1 48 (20.25%) Python
2 45 (18.99%) SQL
3 30 (12.66%) Java
4 19 (8.02%) C#
5 13 (5.49%) JavaScript
6 11 (4.64%) Perl
7 9 (3.80%) C++
8 8 (3.38%) Shell Script
9 7 (2.95%) BeanShell
10 6 (2.53%) Bicep
11 5 (2.11%) PL/SQL
12 4 (1.69%) Bash
12 4 (1.69%) C
12 4 (1.69%) TypeScript
13 3 (1.27%) Korn
13 3 (1.27%) Scala
14 2 (0.84%) PHP
14 2 (0.84%) PowerShell
14 2 (0.84%) RPG
15 1 (0.42%) Data Analysis Expressions
Qualifications
1 33 (13.92%) Degree
2 13 (5.49%) Computer Science Degree
3 6 (2.53%) CISSP
3 6 (2.53%) Master's Degree
4 5 (2.11%) Azure Certification
4 5 (2.11%) CISA
5 4 (1.69%) (ISC)2 CCSP
5 4 (1.69%) CCSP
5 4 (1.69%) Cisco Certification
5 4 (1.69%) GCIH
6 3 (1.27%) PhD
6 3 (1.27%) Security Cleared
7 2 (0.84%) ACCA
7 2 (0.84%) CIMA
7 2 (0.84%) ITIL Foundation Certificate
7 2 (0.84%) Microsoft Certification
7 2 (0.84%) PMI Certification
7 2 (0.84%) PRINCE2 Certification
7 2 (0.84%) RHCE
7 2 (0.84%) SC Cleared
Quality Assurance & Compliance
1 15 (6.33%) GDPR
2 13 (5.49%) ISO/IEC 27001
3 11 (4.64%) QA
4 9 (3.80%) Data Quality
5 7 (2.95%) NIST
6 6 (2.53%) SOC 2
7 5 (2.11%) SLA
8 4 (1.69%) COBIT
8 4 (1.69%) Dodd-Frank
8 4 (1.69%) SEPA
9 3 (1.27%) PMO
9 3 (1.27%) Sarbanes-Oxley
10 2 (0.84%) EMIR
10 2 (0.84%) GRC
10 2 (0.84%) IFRS
10 2 (0.84%) IFRS 9
10 2 (0.84%) MiFID
10 2 (0.84%) Solvency II
11 1 (0.42%) ISO 20022
11 1 (0.42%) PSD2
System Software
1 10 (4.22%) Docker
2 6 (2.53%) Active Directory
2 6 (2.53%) VMware Infrastructure
3 2 (0.84%) KVM
3 2 (0.84%) Virtual Machines
3 2 (0.84%) VMware ESXi
3 2 (0.84%) vSphere
4 1 (0.42%) Virtual Servers
Systems Management
1 13 (5.49%) Ansible
2 12 (5.06%) Kubernetes
3 11 (4.64%) Terraform
4 3 (1.27%) BladeLogic
4 3 (1.27%) ITRS Geneos
4 3 (1.27%) Microsoft Intune
5 2 (0.84%) Control-M
5 2 (0.84%) Progress Chef
5 2 (0.84%) Puppet
5 2 (0.84%) Red Hat Satellite
5 2 (0.84%) SCCM
5 2 (0.84%) vRealize
6 1 (0.42%) HP Fortify
6 1 (0.42%) Rundeck
6 1 (0.42%) Single Sign-On
Vendors
1 22 (9.28%) Microsoft
1 22 (9.28%) Oracle
2 12 (5.06%) Google
3 9 (3.80%) CyberArk
3 9 (3.80%) IBM
3 9 (3.80%) ION Trading
4 8 (3.38%) Databricks
4 8 (3.38%) Splunk
5 7 (2.95%) Darktrace
5 7 (2.95%) Red Hat
5 7 (2.95%) VMware
6 6 (2.53%) Bloomberg
6 6 (2.53%) Murex
7 5 (2.11%) OpenAI
7 5 (2.11%) Sophis
8 4 (1.69%) Adobe
8 4 (1.69%) Alteryx
8 4 (1.69%) F5
8 4 (1.69%) Reuters
8 4 (1.69%) SAP