PL/SQL (PLSQL)
England > London
The table below provides summary statistics and contractor rates for jobs advertised in London requiring PL/SQL skills. It covers contract job vacancies from the 6 months leading up to 18 February 2026, with comparisons to the same periods in the previous two years.
| 6 months to 18 Feb 2026 |
Same period 2025 | Same period 2024 | |
|---|---|---|---|
| Rank | 263 | 214 | 221 |
| Rank change year-on-year | -49 | +7 | +9 |
| Contract jobs citing PL/SQL | 132 | 147 | 187 |
| As % of all contract jobs in London | 0.85% | 1.09% | 1.02% |
| As % of the Programming Languages category | 2.36% | 2.81% | 2.93% |
| Number of daily rates quoted | 98 | 111 | 127 |
| 10th Percentile | £385 | - | £385 |
| 25th Percentile | £404 | £385 | £400 |
| Median daily rate (50th Percentile) | £415 | £475 | £475 |
| Median % change year-on-year | -12.63% | - | -5.00% |
| 75th Percentile | £550 | £600 | £650 |
| 90th Percentile | £655 | £700 | £750 |
| England median daily rate | £475 | £475 | £535 |
| % change year-on-year | - | -11.21% | -0.56% |
| Number of hourly rates quoted | 1 | 2 | 0 |
| 10th Percentile | - | - | - |
| 25th Percentile | £100.00 | £91.25 | - |
| Median hourly rate | £105.00 | £92.50 | - |
| Median % change year-on-year | +13.51% | - | - |
| 75th Percentile | £110.00 | £93.75 | - |
| 90th Percentile | - | - | - |
| England median hourly rate | £105.00 | £92.50 | - |
| % change year-on-year | +13.51% | - | - |
All Programming Languages
London
PL/SQL falls under the Programming Languages category. For comparison with the information above, the following table provides summary statistics for all contract job vacancies requiring coding skills in London.
| Contract vacancies with a requirement for coding skills | 5,588 | 5,232 | 6,381 |
| As % of all contract IT jobs advertised in London | 35.97% | 38.80% | 34.81% |
| Number of daily rates quoted | 3,758 | 3,458 | 4,831 |
| 10th Percentile | £363 | £373 | £385 |
| 25th Percentile | £425 | £450 | £463 |
| Median daily rate (50th Percentile) | £525 | £550 | £575 |
| Median % change year-on-year | -4.55% | -4.35% | -4.17% |
| 75th Percentile | £650 | £690 | £700 |
| 90th Percentile | £775 | £825 | £800 |
| England median daily rate | £508 | £525 | £550 |
| % change year-on-year | -3.33% | -4.55% | -4.35% |
| Number of hourly rates quoted | 58 | 36 | 69 |
| 10th Percentile | £23.38 | £35.00 | £26.75 |
| 25th Percentile | £36.25 | £38.44 | £39.85 |
| Median hourly rate | £54.75 | £50.00 | £51.75 |
| Median % change year-on-year | +9.50% | -3.38% | -10.00% |
| 75th Percentile | £66.50 | £65.00 | £62.50 |
| 90th Percentile | £81.38 | £95.63 | £72.10 |
| England median hourly rate | £65.00 | £63.00 | £61.05 |
| % change year-on-year | +3.17% | +3.19% | -6.08% |
PL/SQL
Job Vacancy Trend in London
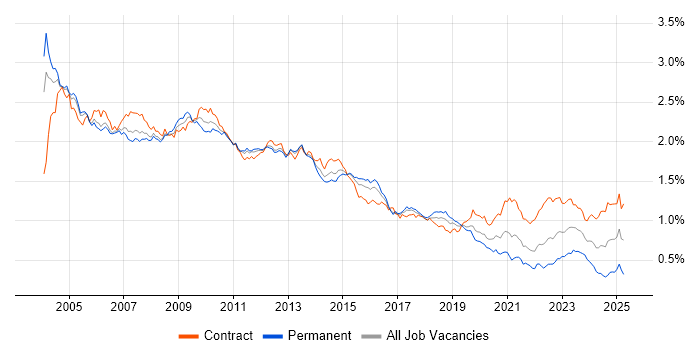
Historical trend showing the proportion of contract IT job postings citing PL/SQL relative to all contract IT jobs advertised in London.

PL/SQL
Daily Rate Trend in London
Contractor daily rate distribution trend for jobs in London citing PL/SQL.

PL/SQL
Daily Rate Histogram in London
Daily rate distribution for jobs citing PL/SQL in London over the 6 months to 18 February 2026.
PL/SQL
Hourly Rate Trend in London
Contractor hourly rate distribution trend for jobs in London citing PL/SQL.

PL/SQL
Contract Job Locations in London
The table below looks at the demand and provides a guide to the median contractor rates quoted in IT jobs citing PL/SQL within the London region over the 6 months to 18 February 2026. The 'Rank Change' column provides an indication of the change in demand within each location based on the same 6 month period last year.
| Location | Rank Change on Same Period Last Year |
Matching Contract IT Job Ads |
Median Daily Rate Past 6 Months |
Median Daily Rate % Change on Same Period Last Year |
Live Jobs |
|---|---|---|---|---|---|
| Central London | -17 | 14 | £493 | -7.94% | 4 |
| East London | -4 | 3 | £416 | +4.00% | |
| South London | -10 | 3 | £300 | -50.00% | 1 |
| PL/SQL England |
|||||
PL/SQL
Co-Occurring Skills & Capabilities in London by Category
The following tables expand on the one above by listing co-occurrences grouped by category. They cover the same employment type, locality and period, with up to 20 co-occurrences shown in each category:
|
|
||||||||||||||||||||||||||||||||||||||||||||||||||||||||||||||||||||||||||||||||||||||||||||||||||||||||||||||||||||||||||||||
|
|
||||||||||||||||||||||||||||||||||||||||||||||||||||||||||||||||||||||||||||||||||||||||||||||||||||||||||||||||||||||||||||||
|
|
||||||||||||||||||||||||||||||||||||||||||||||||||||||||||||||||||||||||||||||||||||||||||||||||||||||||||||||||||||||||||||||
|
|
||||||||||||||||||||||||||||||||||||||||||||||||||||||||||||||||||||||||||||||||||||||||||||||||||||||||||||||||||||||||||||||
|
|
||||||||||||||||||||||||||||||||||||||||||||||||||||||||||||||||||||||||||||||||||||||||||||||||||||||||||||||||||||||||||||||
|
|
||||||||||||||||||||||||||||||||||||||||||||||||||||||||||||||||||||||||||||||||||||||||||||||||||||||||||||||||||||||||||||||
|
|
||||||||||||||||||||||||||||||||||||||||||||||||||||||||||||||||||||||||||||||||||||||||||||||||||||||||||||||||||||||||||||||
|
|
||||||||||||||||||||||||||||||||||||||||||||||||||||||||||||||||||||||||||||||||||||||||||||||||||||||||||||||||||||||||||||||
|
|
||||||||||||||||||||||||||||||||||||||||||||||||||||||||||||||||||||||||||||||||||||||||||||||||||||||||||||||||||||||||||||||
|
|||||||||||||||||||||||||||||||||||||||||||||||||||||||||||||||||||||||||||||||||||||||||||||||||||||||||||||||||||||||||||||||
