Oracle Contract Job Trends in London

Oracle
England > London

The table below provides summary statistics for contract job vacancies advertised in London requiring knowledge or experience of Oracle products and/or services. It includes a benchmarking guide to contractor rates offered in vacancies that cited Oracle over the 6 months leading up to 20 November 2025, comparing them to the same period in the previous two years.

The figures below represent the IT contractor job market in general and are not representative of contractor rates within the Oracle Corporation.

6 months to
20 Nov 2025
Same period 2024 Same period 2023
Rank 45 34 36
Rank change year-on-year -11 +2 0
Contract jobs citing Oracle 780 825 1,094
As % of all contract jobs in London 5.52% 5.25% 5.53%
As % of the Vendors category 11.91% 12.02% 13.42%
Number of daily rates quoted 489 546 719
10th Percentile £375 £363 £382
25th Percentile £415 £416 £433
Median daily rate (50th Percentile) £525 £550 £550
Median % change year-on-year -4.55% - -8.33%
75th Percentile £663 £675 £680
90th Percentile £738 £750 £764
England median daily rate £515 £550 £550
% change year-on-year -6.36% - -
Number of hourly rates quoted 6 2 4
10th Percentile £44.38 £13.18 £51.23
25th Percentile £54.69 £16.09 £66.51
Median hourly rate £76.25 £21.55 £83.75
Median % change year-on-year +253.91% -74.27% +31.37%
75th Percentile £106.25 £26.38 £93.75
90th Percentile £110.00 £28.91 -
England median hourly rate £39.68 £24.30 £57.53
% change year-on-year +63.28% -57.76% -4.12%

All Vendors
London

Oracle falls under the Vendor Products and Services category. For comparison with the information above, the following table provides summary statistics for all contract job vacancies requiring knowledge or experience of all vendor products and services in London.

Contract vacancies with a requirement for knowledge or experience of vendor products and services 6,551 6,864 8,153
As % of all contract IT jobs advertised in London 46.34% 43.65% 41.22%
Number of daily rates quoted 4,233 4,319 5,657
10th Percentile £325 £313 £300
25th Percentile £420 £425 £430
Median daily rate (50th Percentile) £525 £538 £550
Median % change year-on-year -2.33% -2.27% -4.35%
75th Percentile £641 £638 £675
90th Percentile £738 £749 £763
England median daily rate £505 £525 £525
% change year-on-year -3.81% - -2.78%
Number of hourly rates quoted 140 65 116
10th Percentile £17.50 £20.80 £17.00
25th Percentile £22.50 £23.80 £23.50
Median hourly rate £25.15 £37.50 £40.50
Median % change year-on-year -32.93% -7.41% +57.53%
75th Percentile £39.25 £65.00 £60.94
90th Percentile £63.30 £97.00 £84.75
England median hourly rate £25.15 £35.00 £44.75
% change year-on-year -28.16% -21.79% +72.12%

Oracle
Job Vacancy Trend in London

Historical trend showing the proportion of contract IT job postings citing Oracle relative to all contract IT jobs advertised in London.
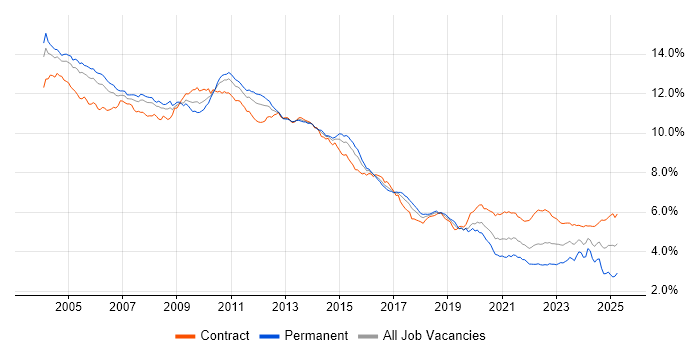
Oracle job vacancy trend in London

Oracle
Daily Rate Trend in London

Contractor daily rate distribution trend for jobs in London citing Oracle.

Contractor daily rate distribution trend for jobs in London citing Oracle

Oracle
Daily Rate Histogram in London

Daily rate distribution for jobs citing Oracle in London over the 6 months to 20 November 2025.

Daily rate histogram for Oracle in London

Oracle
Hourly Rate Trend in London

Contractor hourly rate distribution trend for jobs in London citing Oracle.

Contractor hourly rate distribution trend for jobs in London citing Oracle

Oracle
Hourly Rate Histogram in London

Hourly rate distribution of jobs citing Oracle in London over the 6 months to 20 November 2025.

Hourly rate histogram for Oracle in London

Oracle
Contract Job Locations in London

The table below looks at the demand and provides a guide to the median contractor rates quoted in IT jobs citing Oracle within the London region over the 6 months to 20 November 2025. The 'Rank Change' column provides an indication of the change in demand within each location based on the same 6 month period last year.

Location Rank Change
on Same Period
Last Year
Matching
Contract
IT Job Ads
Median
Daily Rate
Past 6 Months
Median Daily Rate
% Change
on Same Period
Last Year
Live
Jobs
Central London -5 106 £478 -13.34% 118
West London -6 17 £208 -63.27% 10
East London +5 12 £533 +33.13% 7
South London -15 6 £411 -31.46% 1
North London - 1 £500 -
Oracle
England

Oracle
Co-Occurring Skills & Capabilities in London by Category

The following tables expand on the one above by listing co-occurrences grouped by category. They cover the same employment type, locality and period, with up to 20 co-occurrences shown in each category:

Application Platforms
1 24 (3.08%) Oracle SOA Suite
1 24 (3.08%) Oracle Workflow
2 15 (1.92%) Confluence
3 14 (1.79%) IIS
3 14 (1.79%) SharePoint
4 13 (1.67%) WebSphere
5 11 (1.41%) WebLogic
6 9 (1.15%) Apache
7 8 (1.03%) JBoss
7 8 (1.03%) Tomcat
8 7 (0.90%) SAS
9 5 (0.64%) HCL Notes
10 4 (0.51%) Apache Airflow
10 4 (0.51%) Apache Spark
11 3 (0.38%) LiveLink
11 3 (0.38%) NServiceBus
11 3 (0.38%) Oracle Self-Service HR
12 2 (0.26%) Apache Solr
12 2 (0.26%) Oracle HTTP Server
12 2 (0.26%) WildFly
Applications
1 47 (6.03%) Microsoft Excel
2 20 (2.56%) Microsoft Office
3 11 (1.41%) Microsoft PowerPoint
4 8 (1.03%) Oracle Smart View
5 6 (0.77%) Spreadsheet
6 5 (0.64%) MS Visio
7 3 (0.38%) Microsoft Project
8 1 (0.13%) Trello
Business Applications
1 75 (9.62%) Oracle EBS
2 57 (7.31%) Oracle Payables
3 39 (5.00%) Oracle ERP
4 38 (4.87%) Oracle General Ledger
5 36 (4.62%) Oracle EBS R12
5 36 (4.62%) Oracle Financials
6 34 (4.36%) Oracle Receivables
7 31 (3.97%) Oracle Assets
8 22 (2.82%) Oracle Cash Management
9 15 (1.92%) Oracle BPM
9 15 (1.92%) Oracle Procure-to-Pay
10 12 (1.54%) SAP S/4HANA
11 11 (1.41%) Oracle Subledger Accounting
12 10 (1.28%) Oracle E-Business Tax
12 10 (1.28%) Oracle Payroll
12 10 (1.28%) Temenos T24
13 8 (1.03%) Oracle FAH
14 7 (0.90%) FLEXCUBE
14 7 (0.90%) SAP HR
15 6 (0.77%) OpenText MBPM
Cloud Services
1 113 (14.49%) OCI
2 110 (14.10%) Azure
3 74 (9.49%) AWS
4 51 (6.54%) SaaS
5 40 (5.13%) Power Platform
6 36 (4.62%) GCP
7 33 (4.23%) PaaS
8 16 (2.05%) GitHub
9 13 (1.67%) Azure DevOps
10 11 (1.41%) Amazon S3
10 11 (1.41%) Snowflake
11 10 (1.28%) IaaS
12 9 (1.15%) OpenShift
13 8 (1.03%) Dynamics 365
13 8 (1.03%) Microsoft 365
13 8 (1.03%) Serverless
14 7 (0.90%) Azure Data Factory
14 7 (0.90%) GitHub Actions
14 7 (0.90%) Oracle CX
15 6 (0.77%) Azure Service Bus
Communications & Networking
1 18 (2.31%) Firewall
2 12 (1.54%) Internet
3 5 (0.64%) DNS
3 5 (0.64%) HTTP
3 5 (0.64%) SSL
4 3 (0.38%) LAN
4 3 (0.38%) NetScaler
4 3 (0.38%) TCP/IP
5 2 (0.26%) RTP
5 2 (0.26%) SAN
5 2 (0.26%) VPN
5 2 (0.26%) WAN
6 1 (0.13%) DHCP
6 1 (0.13%) FTP
6 1 (0.13%) HDSL
6 1 (0.13%) HTTPS
6 1 (0.13%) Network Security
6 1 (0.13%) Software-Defined Networking
6 1 (0.13%) VSAN
Database & Business Intelligence
1 125 (16.03%) Oracle Database
2 124 (15.90%) SQL Server
3 75 (9.62%) Oracle Reports
4 55 (7.05%) PostgreSQL
5 48 (6.15%) Relational Database
6 39 (5.00%) Power BI
7 33 (4.23%) Oracle BI Publisher
8 31 (3.97%) Data Warehouse
9 29 (3.72%) MySQL
10 28 (3.59%) MongoDB
11 16 (2.05%) Oracle ODI
12 14 (1.79%) DB2
13 13 (1.67%) Redis
14 12 (1.54%) Metadata
14 12 (1.54%) NoSQL
15 11 (1.41%) RDBMS
16 10 (1.28%) Amazon Redshift
16 10 (1.28%) BigQuery
16 10 (1.28%) Tableau
17 9 (1.15%) SQL Server Integration Services
Development Applications
1 55 (7.05%) JIRA
2 37 (4.74%) Git
3 31 (3.97%) Jenkins
4 17 (2.18%) Oracle Forms
4 17 (2.18%) Postman
5 15 (1.92%) Maven
6 14 (1.79%) GitLab
6 14 (1.79%) JUnit
7 10 (1.28%) SoapUI
8 9 (1.15%) Bitbucket
8 9 (1.15%) Oracle APEX
9 8 (1.03%) webpack
10 7 (0.90%) Mockito
10 7 (0.90%) Subversion
10 7 (0.90%) TeamCity
11 6 (0.77%) Sonatype Nexus
11 6 (0.77%) Toad
12 5 (0.64%) Ant
12 5 (0.64%) REST Assured
12 5 (0.64%) XCTest
General
1 384 (49.23%) Finance
2 265 (33.97%) Social Skills
3 102 (13.08%) Banking
4 93 (11.92%) Analytical Skills
5 73 (9.36%) Public Sector
6 35 (4.49%) General Ledger
7 23 (2.95%) Financial Institution
8 22 (2.82%) Billing
8 22 (2.82%) Retail
9 19 (2.44%) Presentation Skills
10 17 (2.18%) Documentation Skills
11 16 (2.05%) Local Government
12 15 (1.92%) Investment Banking
13 14 (1.79%) Manufacturing
14 12 (1.54%) Front Office
14 12 (1.54%) Influencing Skills
15 9 (1.15%) Organisational Skills
16 8 (1.03%) Back Office
16 8 (1.03%) Inclusion and Diversity
16 8 (1.03%) Marketing
Job Titles
1 162 (20.77%) Developer
2 114 (14.62%) Consultant
3 97 (12.44%) Oracle Consultant
4 94 (12.05%) Analyst
5 72 (9.23%) Senior
6 60 (7.69%) Architect
7 55 (7.05%) Lead
8 39 (5.00%) C# Developer
9 38 (4.87%) Business Analyst
10 36 (4.62%) Oracle Developer
11 27 (3.46%) Cloud Consultant
12 25 (3.21%) Functional Consultant
12 25 (3.21%) Oracle Functional Consultant
13 24 (3.08%) Java Developer
14 23 (2.95%) C# WPF Developer
14 23 (2.95%) Oracle Specialist
14 23 (2.95%) WPF Developer
15 21 (2.69%) .NET Developer
16 20 (2.56%) C# .NET Developer
17 19 (2.44%) Data Engineer
Libraries, Frameworks & Software Standards
1 135 (17.31%) Oracle Fusion
2 67 (8.59%) .NET
3 60 (7.69%) REST
4 53 (6.79%) Kafka
5 47 (6.03%) SOAP
6 41 (5.26%) .NET Framework
7 38 (4.87%) HTML
8 36 (4.62%) Web Services
9 35 (4.49%) CSS
10 32 (4.10%) XML
11 28 (3.59%) JSON
11 28 (3.59%) WPF
12 27 (3.46%) Spring
13 25 (3.21%) React
14 24 (3.08%) Middleware
15 22 (2.82%) AngularJS
16 20 (2.56%) Spring Boot
17 16 (2.05%) Hibernate
18 14 (1.79%) HTML5
19 13 (1.67%) Bootstrap
Miscellaneous
1 31 (3.97%) Legacy Systems
2 28 (3.59%) Management Information System
3 19 (2.44%) Cloud Native
3 19 (2.44%) Product Ownership
4 16 (2.05%) Foreign Exchange (FX)
5 14 (1.79%) Onboarding
6 13 (1.67%) Enterprise Software
6 13 (1.67%) SWIFT Messaging Network
7 10 (1.28%) Data Structures
7 10 (1.28%) Distributed Systems
7 10 (1.28%) Public Cloud
7 10 (1.28%) Self-Motivation
8 9 (1.15%) Data Centre
8 9 (1.15%) Hedge funds
8 9 (1.15%) Reinsurance
8 9 (1.15%) Replication
9 8 (1.03%) Low-Code
10 7 (0.90%) Data Protection Act
10 7 (0.90%) Virtual Team
11 6 (0.77%) Mobile App
Operating Systems
1 85 (10.90%) Linux
2 77 (9.87%) Unix
3 76 (9.74%) Windows
4 15 (1.92%) Red Hat Enterprise Linux
5 11 (1.41%) Windows Server
6 5 (0.64%) AIX
6 5 (0.64%) CentOS
6 5 (0.64%) Windows Server 2016
7 3 (0.38%) Android
7 3 (0.38%) Apple iOS
7 3 (0.38%) Mac OS
8 2 (0.26%) Solaris
8 2 (0.26%) Ubuntu
9 1 (0.13%) Windows Server 2008
Processes & Methodologies
1 206 (26.41%) Agile
2 163 (20.90%) ERP
3 134 (17.18%) Migration
4 130 (16.67%) Problem-Solving
5 94 (12.05%) Business Intelligence
6 86 (11.03%) DevOps
7 78 (10.00%) Data Migration
8 74 (9.49%) CI/CD
9 69 (8.85%) Stakeholder Management
10 63 (8.08%) Stakeholder Engagement
11 61 (7.82%) User Acceptance Testing
12 56 (7.18%) Data Modelling
13 54 (6.92%) Analytics
14 53 (6.79%) Validation
15 49 (6.28%) Continuous Improvement
15 49 (6.28%) Data Analysis
15 49 (6.28%) Roadmaps
16 48 (6.15%) Change Management
17 47 (6.03%) Project Delivery
18 46 (5.90%) Test Automation
Programming Languages
1 295 (37.82%) SQL
2 123 (15.77%) PL/SQL
3 112 (14.36%) Java
4 94 (12.05%) C#
5 79 (10.13%) Python
6 56 (7.18%) JavaScript
7 34 (4.36%) C++
8 28 (3.59%) VBA
9 27 (3.46%) T-SQL
10 26 (3.33%) VB
11 24 (3.08%) Shell Script
12 20 (2.56%) Perl
13 19 (2.44%) Groovy
14 18 (2.31%) Bash
15 14 (1.79%) PowerShell
15 14 (1.79%) VB.NET
16 6 (0.77%) Korn
17 5 (0.64%) C
17 5 (0.64%) R
17 5 (0.64%) XPath
Qualifications
1 124 (15.90%) Security Cleared
2 99 (12.69%) SC Cleared
3 60 (7.69%) Degree
4 21 (2.69%) Computer Science Degree
5 16 (2.05%) BPSS Clearance
6 14 (1.79%) Oracle Certification
7 11 (1.41%) AWS Certification
8 10 (1.28%) DV Cleared
9 9 (1.15%) Master's Degree
10 8 (1.03%) PMP
11 7 (0.90%) PMI Certification
12 5 (0.64%) ACCA
12 5 (0.64%) CIMA
12 5 (0.64%) DBS Check
12 5 (0.64%) OCP
13 4 (0.51%) ISTQB
13 4 (0.51%) OCA
13 4 (0.51%) SAP Certification
14 3 (0.38%) APMG
14 3 (0.38%) Azure Certification
Quality Assurance & Compliance
1 56 (7.18%) QA
2 30 (3.85%) Data Quality
3 18 (2.31%) PMO
4 12 (1.54%) SLA
5 9 (1.15%) ISO/IEC 27001
5 9 (1.15%) Sarbanes-Oxley
6 8 (1.03%) GDPR
6 8 (1.03%) IFRS
7 7 (0.90%) Accessibility
7 7 (0.90%) MiFID
7 7 (0.90%) NIST
8 6 (0.77%) COBIT
8 6 (0.77%) GAAP
8 6 (0.77%) ITGC
8 6 (0.77%) SOX 404
9 5 (0.64%) EMIR
9 5 (0.64%) SEPA
10 4 (0.51%) Actionable Recommendations
10 4 (0.51%) IFRS 17
11 3 (0.38%) IFRS 9
System Software
1 34 (4.36%) Docker
2 10 (1.28%) Oracle RAC
3 9 (1.15%) Active Directory
4 6 (0.77%) Hyper-V
4 6 (0.77%) VMware Infrastructure
5 2 (0.26%) GPFS
5 2 (0.26%) GridGain
5 2 (0.26%) NFS
5 2 (0.26%) Tivoli Workload Scheduler
5 2 (0.26%) Virtual Servers
6 1 (0.13%) Samba
6 1 (0.13%) VMware NSX
Systems Management
1 34 (4.36%) Kubernetes
2 16 (2.05%) Ansible
3 12 (1.54%) Terraform
4 10 (1.28%) Grafana
5 8 (1.03%) Oracle RMAN
5 8 (1.03%) Prometheus
6 6 (0.77%) Data Guard
7 5 (0.64%) TIBCO Hawk
8 4 (0.51%) BladeLogic
8 4 (0.51%) Oracle Enterprise Manager
8 4 (0.51%) Puppet
8 4 (0.51%) ZABBIX
9 3 (0.38%) Ambari
9 3 (0.38%) ITRS Geneos
9 3 (0.38%) NetBackup
10 2 (0.26%) Control-M
10 2 (0.26%) Microsoft Intune
10 2 (0.26%) Nagios
10 2 (0.26%) SCOM
10 2 (0.26%) Tivoli
Vendors
1 76 (9.74%) SAP
2 56 (7.18%) Microsoft
3 24 (3.08%) Workday
4 23 (2.95%) ServiceNow
5 22 (2.82%) Citrix
6 20 (2.56%) IBM
7 19 (2.44%) Salesforce
8 16 (2.05%) Splunk
9 15 (1.92%) Dynatrace
10 14 (1.79%) Google
11 13 (1.67%) Informatica
11 13 (1.67%) TIBCO
11 13 (1.67%) VMware
12 11 (1.41%) Databricks
12 11 (1.41%) Red Hat
13 10 (1.28%) Temenos
14 9 (1.15%) Planview
15 8 (1.03%) Hyperion
16 7 (0.90%) OpenText
17 6 (0.77%) Reuters