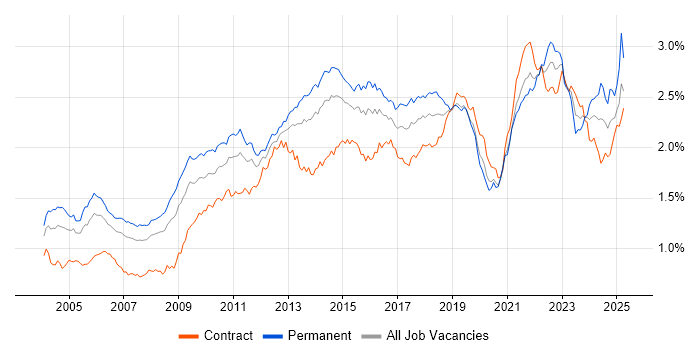
Presentation Skills Contract Job Trends in London

Presentation Skills
England > London

The table below looks at the prevalence of the term Presentation Skills in contract job vacancies in London. Included is a benchmarking guide to the contractor rates offered in vacancies that cited Presentation Skills over the 6 months leading up to 17 September 2025, comparing them to the same period in the previous two years.

6 months to
17 Sep 2025
Same period 2024 Same period 2023
Rank 151 150 91
Rank change year-on-year -1 -59 +13
Contract jobs citing Presentation Skills 237 289 582
As % of all contract jobs advertised in London 1.76% 1.79% 2.65%
As % of the General category 2.55% 2.88% 4.12%
Number of daily rates quoted 106 123 340
10th Percentile £341 £251 £335
25th Percentile £425 £385 £450
Median daily rate (50th Percentile) £525 £500 £568
Median % change year-on-year +5.00% -11.89% -1.30%
75th Percentile £638 £650 £700
90th Percentile £750 £775 £825
England median daily rate £525 £500 £540
% change year-on-year +5.00% -7.41% -1.82%
Number of hourly rates quoted 1 6 7
10th Percentile - £36.25 £15.80
25th Percentile £46.50 £37.50 £26.09
Median hourly rate £48.00 £48.75 £37.50
Median % change year-on-year -1.54% +30.00% +13.40%
75th Percentile £49.50 £58.75 £43.86
90th Percentile - £74.38 £61.32
England median hourly rate £65.00 £65.00 £42.50
% change year-on-year - +52.94% -34.62%

All General Skills
London

Presentation Skills falls under the General Skills category. For comparison with the information above, the following table provides summary statistics for all contract job vacancies requiring common skills in London.

Contract vacancies with a requirement for common skills 9,290 10,037 14,131
As % of all contract IT jobs advertised in London 69.16% 62.15% 64.43%
Number of daily rates quoted 6,130 6,673 10,323
10th Percentile £325 £330 £363
25th Percentile £425 £450 £475
Median daily rate (50th Percentile) £550 £575 £600
Median % change year-on-year -4.35% -4.17% -
75th Percentile £675 £700 £703
90th Percentile £790 £825 £810
England median daily rate £500 £538 £550
% change year-on-year -6.98% -2.27% -
Number of hourly rates quoted 183 121 175
10th Percentile £17.00 £18.00 £17.99
25th Percentile £24.64 £24.50 £20.00
Median hourly rate £32.50 £35.00 £30.00
Median % change year-on-year -7.14% +16.67% -15.49%
75th Percentile £49.63 £53.75 £54.75
90th Percentile £65.00 £66.00 £70.00
England median hourly rate £25.15 £38.50 £27.50
% change year-on-year -34.68% +40.00% +10.93%

Presentation Skills
Job Vacancy Trend in London

Job postings citing Presentation Skills as a proportion of all IT jobs advertised in London.

Job vacancy trend for Presentation Skills in London

Presentation Skills
Daily Rate Trend in London

Contractor daily rate distribution trend for jobs in London citing Presentation Skills.

Contractor daily rate distribution trend for jobs in London citing Presentation Skills

Presentation Skills
Daily Rate Histogram in London

Daily rate distribution for jobs citing Presentation Skills in London over the 6 months to 17 September 2025.

Daily rate histogram for Presentation Skills in London

Presentation Skills
Hourly Rate Trend in London

Contractor hourly rate distribution trend for jobs in London citing Presentation Skills.

Contractor hourly rate distribution trend for jobs in London citing Presentation Skills

Presentation Skills
Contract Job Locations in London

The table below looks at the demand and provides a guide to the median contractor rates quoted in IT jobs citing Presentation Skills within the London region over the 6 months to 17 September 2025. The 'Rank Change' column provides an indication of the change in demand within each location based on the same 6 month period last year.

Location Rank Change
on Same Period
Last Year
Matching
Contract
IT Job Ads
Median
Daily Rate
Past 6 Months
Median Daily Rate
% Change
on Same Period
Last Year
Live
Jobs
Central London -4 49 £500 -9.09% 112
South London +7 13 £538 +41.45% 6
Presentation Skills
England

Presentation Skills
Co-occurring Skills and Capabilities in London by Category

The follow tables expand on the table above by listing co-occurrences grouped by category. The same employment type, locality and period is covered with up to 20 co-occurrences shown in each of the following categories:

Application Platforms
1 22 (9.28%) Confluence
2 14 (5.91%) SharePoint
3 10 (4.22%) nginx
4 6 (2.53%) Microsoft Exchange
5 4 (1.69%) CMS
6 2 (0.84%) Apache Airflow
6 2 (0.84%) Apache Spark
7 1 (0.42%) Apache
7 1 (0.42%) Oracle SOA Suite
7 1 (0.42%) Oracle UPK
7 1 (0.42%) Skype for Business
Applications
1 23 (9.70%) Microsoft PowerPoint
2 16 (6.75%) Microsoft Excel
3 14 (5.91%) Microsoft Office
4 11 (4.64%) Microsoft Project
5 10 (4.22%) Mozilla Thunderbird
6 9 (3.80%) MS Visio
7 2 (0.84%) Adobe Illustrator
7 2 (0.84%) Photoshop
8 1 (0.42%) Camtasia
8 1 (0.42%) Chatbot
8 1 (0.42%) Final Cut Pro
8 1 (0.42%) Spreadsheet
Business Applications
1 9 (3.80%) Endur
2 6 (2.53%) SAP EWM
2 6 (2.53%) SAP WM
2 6 (2.53%) Shopify
3 5 (2.11%) Salesforce CRM
3 5 (2.11%) Workday HCM
4 4 (1.69%) CA PPM
4 4 (1.69%) SAP S/4HANA
5 3 (1.27%) Dynamics CRM
6 2 (0.84%) Aligne
6 2 (0.84%) HFM
7 1 (0.42%) Oracle EBS
7 1 (0.42%) Payment Gateway
7 1 (0.42%) Remedy ITSM
7 1 (0.42%) SAP BPC
7 1 (0.42%) SAP Business One
7 1 (0.42%) SAP HCM
7 1 (0.42%) SAP Hybris
7 1 (0.42%) SAP Oil and Gas
7 1 (0.42%) SAP R/3
Cloud Services
1 40 (16.88%) Azure
2 28 (11.81%) AWS
3 21 (8.86%) Microsoft 365
4 15 (6.33%) Power Platform
5 14 (5.91%) Amazon S3
6 13 (5.49%) GCP
7 11 (4.64%) Amazon CloudWatch
7 11 (4.64%) Amazon EC2
8 10 (4.22%) Amazon ECS
8 10 (4.22%) Amazon ELB
8 10 (4.22%) AWS KMS
8 10 (4.22%) Route 53
8 10 (4.22%) Virtual Private Cloud
9 9 (3.80%) SaaS
10 8 (3.38%) Entra ID
10 8 (3.38%) OCI
10 8 (3.38%) Snowflake
11 6 (2.53%) BigCommerce
11 6 (2.53%) PaaS
12 5 (2.11%) GitHub
Communications & Networking
1 19 (8.02%) Firewall
2 13 (5.49%) DNS
3 10 (4.22%) FTP
3 10 (4.22%) HTTP
3 10 (4.22%) IMAP
3 10 (4.22%) OpenLDAP
3 10 (4.22%) SMTP
3 10 (4.22%) SSH
4 3 (1.27%) VPN
4 3 (1.27%) WAN
5 2 (0.84%) DHCP
5 2 (0.84%) MPLS
5 2 (0.84%) Network Security
5 2 (0.84%) SAN
5 2 (0.84%) TCP/IP
5 2 (0.84%) VLAN
5 2 (0.84%) VSAN
5 2 (0.84%) Wi-Fi
6 1 (0.42%) Multicast
6 1 (0.42%) Skype
Database & Business Intelligence
1 17 (7.17%) PostgreSQL
2 14 (5.91%) Power BI
3 12 (5.06%) Tableau
4 11 (4.64%) SQL Server
5 10 (4.22%) Amazon Aurora
5 10 (4.22%) Amazon RDS
6 7 (2.95%) Data Warehouse
6 7 (2.95%) MongoDB
6 7 (2.95%) Oracle Reports
6 7 (2.95%) Redis
6 7 (2.95%) Relational Database
7 6 (2.53%) Star Schema
8 5 (2.11%) Metadata
9 3 (1.27%) Amazon Redshift
9 3 (1.27%) Big Data
9 3 (1.27%) Data Lake
9 3 (1.27%) Looker
10 2 (0.84%) BigQuery
10 2 (0.84%) Data Vault
11 1 (0.42%) Tableau Desktop
Development Applications
1 28 (11.81%) JIRA
2 13 (5.49%) Jenkins
3 12 (5.06%) Git
4 10 (4.22%) Vagrant
5 7 (2.95%) webpack
6 4 (1.69%) Postman
7 3 (1.27%) REST Assured
7 3 (1.27%) SoapUI
8 2 (0.84%) Mercurial
8 2 (0.84%) Subversion
9 1 (0.42%) Cucumber
9 1 (0.42%) Eclipse
9 1 (0.42%) ERwin
9 1 (0.42%) GitLab
9 1 (0.42%) JMeter
9 1 (0.42%) LoadRunner
9 1 (0.42%) Selenium
9 1 (0.42%) SonarQube
9 1 (0.42%) Team Foundation Server
9 1 (0.42%) Zephyr
General
1 177 (74.68%) Social Skills
2 110 (46.41%) Finance
3 48 (20.25%) Analytical Skills
4 23 (9.70%) Banking
4 23 (9.70%) Public Sector
5 17 (7.17%) Influencing Skills
5 17 (7.17%) Organisational Skills
6 15 (6.33%) Financial Institution
7 14 (5.91%) Marketing
8 12 (5.06%) Retail
9 10 (4.22%) Legal
10 9 (3.80%) Documentation Skills
11 7 (2.95%) Advertising
12 4 (1.69%) Arabic Language
12 4 (1.69%) Back Office
12 4 (1.69%) Czech Language
12 4 (1.69%) Front Office
12 4 (1.69%) General Ledger
12 4 (1.69%) Police
13 3 (1.27%) Games
Job Titles
1 57 (24.05%) Analyst
2 37 (15.61%) Business Analyst
3 24 (10.13%) Architect
3 24 (10.13%) Consultant
4 21 (8.86%) Senior
5 16 (6.75%) Solutions Architect
6 13 (5.49%) AWS Engineer
7 12 (5.06%) DevOps Engineer
7 12 (5.06%) Project Manager
8 11 (4.64%) Platform Engineer
9 10 (4.22%) AWS DevOps
9 10 (4.22%) AWS DevOps Engineer
9 10 (4.22%) AWS Platform Engineer
9 10 (4.22%) Cloud Platform Engineer
10 8 (3.38%) Data Analyst
10 8 (3.38%) DevOps Platform Engineer
10 8 (3.38%) Senior Analyst
11 7 (2.95%) Lead
11 7 (2.95%) SAP Consultant
12 6 (2.53%) SAP WM Consultant
Libraries, Frameworks & Software Standards
1 11 (4.64%) LDAP
2 10 (4.22%) HTML
3 8 (3.38%) CSS
3 8 (3.38%) HTML5
4 7 (2.95%) Bootstrap
4 7 (2.95%) jQuery
4 7 (2.95%) Memcached
4 7 (2.95%) React
4 7 (2.95%) RESTful
5 6 (2.53%) VML
5 6 (2.53%) Web Services
6 5 (2.11%) .NET
6 5 (2.11%) Lightning Web Components
6 5 (2.11%) REST
7 4 (1.69%) Pandas
7 4 (1.69%) scikit-learn
7 4 (1.69%) TensorFlow
8 3 (1.27%) JSON
8 3 (1.27%) Kafka
8 3 (1.27%) Spring
Miscellaneous
1 28 (11.81%) Management Information System
2 25 (10.55%) Product Ownership
3 17 (7.17%) Self-Motivation
4 13 (5.49%) Replication
5 12 (5.06%) PMI
6 8 (3.38%) Reinsurance
7 6 (2.53%) Algorithms
8 5 (2.11%) Public Cloud
9 4 (1.69%) Cloud Native
9 4 (1.69%) Data Structures
9 4 (1.69%) e-Learning
9 4 (1.69%) Legacy Systems
9 4 (1.69%) Onboarding
9 4 (1.69%) Reference Data
10 3 (1.27%) Blog
10 3 (1.27%) Distributed Systems
10 3 (1.27%) Greenfield Project
10 3 (1.27%) Hedge funds
11 2 (0.84%) Security Operations Centre
11 2 (0.84%) Virtual Team
Operating Systems
1 18 (7.59%) Linux
2 15 (6.33%) Windows
3 10 (4.22%) Amazon Linux
3 10 (4.22%) Ubuntu
3 10 (4.22%) VMS
4 1 (0.42%) Android
4 1 (0.42%) Red Hat Enterprise Linux
4 1 (0.42%) Windows Server
Processes & Methodologies
1 82 (34.60%) Agile
2 66 (27.85%) Problem-Solving
3 44 (18.57%) Roadmaps
4 41 (17.30%) Stakeholder Management
5 38 (16.03%) Business Analysis
6 37 (15.61%) User Acceptance Testing
7 35 (14.77%) Decision-Making
8 33 (13.92%) Change Management
9 30 (12.66%) Analytics
9 30 (12.66%) Project Management
10 29 (12.24%) Migration
11 26 (10.97%) Business Intelligence
12 25 (10.55%) CI/CD
13 24 (10.13%) Acceptance Criteria
13 24 (10.13%) DevOps
14 23 (9.70%) Project Delivery
15 22 (9.28%) Data Analysis
16 21 (8.86%) User Stories
17 20 (8.44%) Scrum
17 20 (8.44%) User Experience
Programming Languages
1 35 (14.77%) SQL
2 30 (12.66%) Python
3 18 (7.59%) PowerShell
4 12 (5.06%) Java
5 10 (4.22%) Groovy
6 6 (2.53%) Go
6 6 (2.53%) R
7 5 (2.11%) Bash
7 5 (2.11%) JavaScript
8 2 (0.84%) C++
8 2 (0.84%) PHP
8 2 (0.84%) VBA
9 1 (0.42%) Apex Code
9 1 (0.42%) C#
9 1 (0.42%) COBOL
9 1 (0.42%) Data Analysis Expressions
9 1 (0.42%) Korn
9 1 (0.42%) Perl
Qualifications
1 72 (30.38%) Degree
2 27 (11.39%) Security Cleared
3 23 (9.70%) PMI Certification
4 21 (8.86%) SC Cleared
5 12 (5.06%) PMP
6 11 (4.64%) AWS Certification
6 11 (4.64%) Azure Certification
7 8 (3.38%) SAP Certification
8 7 (2.95%) CBAP
9 5 (2.11%) Cisco Certification
10 4 (1.69%) CCNP
10 4 (1.69%) Computer Science Degree
10 4 (1.69%) FFIEC
10 4 (1.69%) Master's Degree
11 3 (1.27%) CCNA
11 3 (1.27%) SnowPro
12 2 (0.84%) ACCA
12 2 (0.84%) BPSS Clearance
12 2 (0.84%) ITIL Certification
13 1 (0.42%) CISSP
Quality Assurance & Compliance
1 16 (6.75%) QA
2 15 (6.33%) Accessibility
3 10 (4.22%) PMO
4 8 (3.38%) Data Quality
4 8 (3.38%) GRC
5 7 (2.95%) ISO/IEC 27001
6 6 (2.53%) GDPR
6 6 (2.53%) NIST
7 4 (1.69%) COBIT
7 4 (1.69%) PCI DSS
7 4 (1.69%) Sarbanes-Oxley
8 2 (0.84%) ISO/IEC 20000
9 1 (0.42%) Basel III
9 1 (0.42%) ISO 15022
9 1 (0.42%) ISO 20022
9 1 (0.42%) ISO 9001
9 1 (0.42%) SLA
9 1 (0.42%) WCAG
System Software
1 14 (5.91%) Docker
2 10 (4.22%) Active Directory
2 10 (4.22%) DFS Replication
2 10 (4.22%) Dovecot
2 10 (4.22%) Postfix
2 10 (4.22%) Squid
3 4 (1.69%) VMware Infrastructure
4 2 (0.84%) VMware ESXi
4 2 (0.84%) VMware NSX
4 2 (0.84%) vSphere
5 1 (0.42%) Hyper-V
5 1 (0.42%) Virtual Machines
Systems Management
1 19 (8.02%) Terraform
2 10 (4.22%) Grafana
2 10 (4.22%) Nessus
2 10 (4.22%) Prometheus
2 10 (4.22%) Proxmox
3 8 (3.38%) Kubernetes
4 7 (2.95%) Ansible
5 3 (1.27%) Microsoft Intune
6 2 (0.84%) Puppet
6 2 (0.84%) vCenter Server
7 1 (0.42%) HP Quality Center
7 1 (0.42%) SCCM
7 1 (0.42%) SELinux
Vendors
1 43 (18.14%) Microsoft
2 25 (10.55%) SAP
3 23 (9.70%) Oracle
4 21 (8.86%) ServiceNow
5 19 (8.02%) Salesforce
6 10 (4.22%) Google
6 10 (4.22%) Jaspersoft
7 9 (3.80%) Adobe
8 8 (3.38%) Databricks
8 8 (3.38%) Workday
9 6 (2.53%) Sitecore
10 5 (2.11%) VMware
11 4 (1.69%) Broadcom
11 4 (1.69%) IBM
12 3 (1.27%) Cisco
12 3 (1.27%) Hyperion
12 3 (1.27%) PeopleSoft
13 2 (0.84%) HP
13 2 (0.84%) NetApp
13 2 (0.84%) Splunk