QA Contracts in London

Quality Assurance (QA)
England > London

The table below provides summary statistics for contract job vacancies advertised in London requiring QA skills. It includes a benchmarking guide to the contractor rates offered in vacancies that cited QA over the 6 months leading up to 1 May 2025, comparing them to the same period in the previous two years.

6 months to
1 May 2025
Same period 2024 Same period 2023
Rank 64 55 70
Rank change year-on-year -9 +15 0
Contract jobs citing QA 488 652 917
As % of all contract jobs advertised in London 3.89% 3.66% 3.39%
As % of the Quality Assurance & Compliance category 24.50% 26.13% 25.98%
Number of daily rates quoted 325 474 695
10th Percentile £313 £359 £350
25th Percentile £400 £413 £431
Median daily rate (50th Percentile) £500 £540 £550
Median % change year-on-year -7.41% -1.82% -
75th Percentile £600 £668 £688
90th Percentile £738 £800 £798
England median daily rate £478 £516 £510
% change year-on-year -7.39% +1.18% -
Number of hourly rates quoted 4 8 13
10th Percentile £24.50 £17.68 -
25th Percentile £31.25 £21.88 £21.24
Median hourly rate £35.00 £25.37 £22.49
Median % change year-on-year +37.96% +12.83% -36.66%
75th Percentile £40.00 £47.19 £51.50
90th Percentile £49.00 £61.81 £55.00
England median hourly rate £50.00 £15.75 £22.49
% change year-on-year +217.46% -29.95% -52.66%

All Quality Assurance and Compliance Skills
London

QA falls under the Quality Assurance and Compliance category. For comparison with the information above, the following table provides summary statistics for all contract job vacancies requiring quality assurance or compliance skills in London.

Contract vacancies with a requirement for quality assurance or compliance skills 1,992 2,495 3,530
As % of all contract IT jobs advertised in London 15.88% 13.99% 13.06%
Number of daily rates quoted 1,317 1,770 2,546
10th Percentile £313 £350 £350
25th Percentile £413 £425 £450
Median daily rate (50th Percentile) £530 £550 £563
Median % change year-on-year -3.64% -2.22% +2.27%
75th Percentile £675 £688 £688
90th Percentile £775 £800 £792
England median daily rate £513 £525 £525
% change year-on-year -2.38% - -
Number of hourly rates quoted 28 62 36
10th Percentile £19.44 £12.70 £20.25
25th Percentile £22.27 £17.85 £21.24
Median hourly rate £34.75 £24.75 £30.75
Median % change year-on-year +40.40% -19.51% -30.90%
75th Percentile £57.50 £43.75 £63.75
90th Percentile £86.37 £53.73 £81.25
England median hourly rate £34.75 £22.34 £41.50
% change year-on-year +55.55% -46.17% +50.91%

QA
Job Vacancy Trend in London

Job postings citing QA as a proportion of all IT jobs advertised in London.
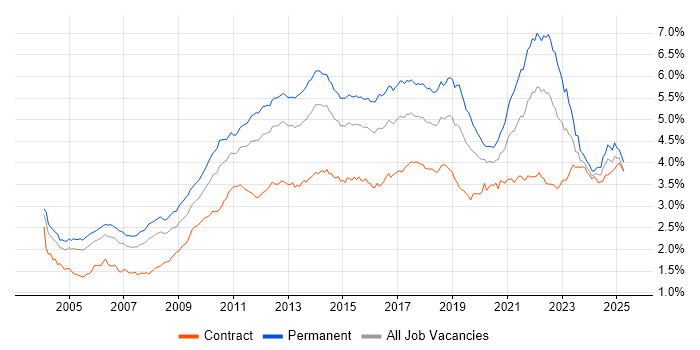
Job vacancy trend for QA in London

QA
Contractor Daily Rate Trend in London

3-month moving average daily rate quoted in jobs citing QA in London.

Daily rate trend for QA in London

QA
Daily Rate Histogram in London

Daily rate distribution for jobs citing QA in London over the 6 months to 1 May 2025.

Daily rate histogram for QA in London

QA
Contractor Hourly Rate Trend in London

3-month moving average hourly rates quoted in jobs citing QA in London.

Hourly rate trend for QA in London

QA
Hourly Rate Histogram in London

Hourly rate distribution of jobs citing QA in London over the 6 months to 1 May 2025.

Hourly rate histogram for QA in London

QA
Contract Job Locations in London

The table below looks at the demand and provides a guide to the median contractor rates quoted in IT jobs citing QA within the London region over the 6 months to 1 May 2025. The 'Rank Change' column provides an indication of the change in demand within each location based on the same 6 month period last year.

Location Rank Change
on Same Period
Last Year
Matching
Contract
IT Job Ads
Median
Daily Rate
Past 6 Months
Median Daily Rate
% Change
on Same Period
Last Year
Live
Jobs
Central London -26 62 £539 -2.09% 50
West London +12 15 £400 +6.67% 33
South London +8 6 £403 +5.92% 12
East London +13 3 £495 -8.33% 16
QA
England

QA
Co-occurring Skills and Capabilities in London by Category

The follow tables expand on the table above by listing co-occurrences grouped by category. The same employment type, locality and period is covered with up to 20 co-occurrences shown in each of the following categories:

Application Platforms
1 32 (6.56%) Confluence
2 12 (2.46%) IIS
3 7 (1.43%) CMS
4 6 (1.23%) SharePoint
5 5 (1.02%) Apache Spark
6 4 (0.82%) Apache
6 4 (0.82%) Apache Airflow
7 3 (0.61%) ArcGIS
7 3 (0.61%) Drupal
7 3 (0.61%) Jupyter
7 3 (0.61%) Oracle Workflow
8 2 (0.41%) Adobe Experience Manager
8 2 (0.41%) MQSeries
8 2 (0.41%) nginx
8 2 (0.41%) Tomcat
8 2 (0.41%) WordPress
9 1 (0.20%) CICS
9 1 (0.20%) Microsoft Exchange
9 1 (0.20%) MS Project Server
9 1 (0.20%) Umbraco
Applications
1 35 (7.17%) Microsoft Excel
2 10 (2.05%) MS Visio
3 8 (1.64%) Microsoft Office
4 7 (1.43%) Microsoft PowerPoint
5 5 (1.02%) Chatbot
6 4 (0.82%) Microsoft Project
7 3 (0.61%) Sketch
8 2 (0.41%) Notepad++
9 1 (0.20%) EViews
9 1 (0.20%) Trello
Business Applications
1 13 (2.66%) Dynamics CRM
2 12 (2.46%) SAP S/4HANA
3 4 (0.82%) Salesforce CRM
3 4 (0.82%) Shopify
4 3 (0.61%) ION Anvil
4 3 (0.61%) Oracle Cash Management
4 3 (0.61%) Oracle EBS R12
4 3 (0.61%) Oracle Financials
4 3 (0.61%) Oracle General Ledger
4 3 (0.61%) Oracle Payables
4 3 (0.61%) Oracle Receivables
5 2 (0.41%) Kondor
5 2 (0.41%) Misys Midas
5 2 (0.41%) MultiFonds
5 2 (0.41%) NEC Housing
5 2 (0.41%) SAP CO
5 2 (0.41%) SAP CRM
5 2 (0.41%) SAP FI
5 2 (0.41%) SAP FI/CO
5 2 (0.41%) SAP Hybris
Cloud Services
1 80 (16.39%) Azure
2 73 (14.96%) AWS
3 27 (5.53%) Azure DevOps
3 27 (5.53%) GitHub
4 26 (5.33%) GCP
4 26 (5.33%) Power Platform
5 15 (3.07%) Dynamics 365
6 14 (2.87%) GitHub Actions
7 11 (2.25%) Snowflake
8 10 (2.05%) Datadog
9 9 (1.84%) BrowserStack
10 8 (1.64%) Serverless
11 7 (1.43%) Amazon CloudWatch
11 7 (1.43%) Azure Data Factory
11 7 (1.43%) Microsoft 365
11 7 (1.43%) Sauce Labs
12 6 (1.23%) Lucidchart
13 5 (1.02%) Adobe Analytics
13 5 (1.02%) Azure Functions
13 5 (1.02%) SaaS
Communications & Networking
1 11 (2.25%) Internet
2 7 (1.43%) Wi-Fi
3 6 (1.23%) DNS
3 6 (1.23%) TCP/IP
3 6 (1.23%) Wireless
4 5 (1.02%) DHCP
4 5 (1.02%) DOCSIS
5 4 (0.82%) Network Security
5 4 (0.82%) Structured Cabling
5 4 (0.82%) WAN
6 3 (0.61%) DSL
6 3 (0.61%) VLAN
6 3 (0.61%) VPN
7 2 (0.41%) Firewall
7 2 (0.41%) FTP
7 2 (0.41%) LAN
7 2 (0.41%) SMS
7 2 (0.41%) Wireshark
8 1 (0.20%) Broadband
8 1 (0.20%) SSH
Database & Business Intelligence
1 40 (8.20%) SQL Server
2 23 (4.71%) Power BI
3 17 (3.48%) Oracle Database
4 12 (2.46%) PostgreSQL
5 10 (2.05%) Tableau
6 9 (1.84%) Data Warehouse
7 8 (1.64%) NoSQL
8 6 (1.23%) MS Access
8 6 (1.23%) MySQL
8 6 (1.23%) Oracle Reports
9 5 (1.02%) BigQuery
9 5 (1.02%) Relational Database
9 5 (1.02%) SQL Server Reporting Services
10 4 (0.82%) Data Lake
10 4 (0.82%) Hadoop
10 4 (0.82%) Looker
10 4 (0.82%) Metadata
10 4 (0.82%) MongoDB
10 4 (0.82%) Power Query
11 3 (0.61%) Delta Lake
Development Applications
1 67 (13.73%) JIRA
2 49 (10.04%) Selenium
3 45 (9.22%) Jenkins
4 41 (8.40%) Git
5 29 (5.94%) JMeter
6 27 (5.53%) Postman
7 22 (4.51%) Cucumber
7 22 (4.51%) GitLab
8 16 (3.28%) Appium
8 16 (3.28%) Cypress.io
8 16 (3.28%) JUnit
9 13 (2.66%) REST Assured
10 12 (2.46%) LoadRunner
11 9 (1.84%) Bitbucket
11 9 (1.84%) Gatling
11 9 (1.84%) SpecFlow
12 8 (1.64%) QARun
12 8 (1.64%) WinRunner
13 6 (1.23%) CircleCI
13 6 (1.23%) TestNG
General
1 186 (38.11%) Social Skills
2 129 (26.43%) Finance
3 101 (20.70%) Analytical Skills
4 58 (11.89%) Banking
5 33 (6.76%) Public Sector
6 16 (3.28%) Front Office
7 15 (3.07%) Retail
8 12 (2.46%) Investment Banking
8 12 (2.46%) Organisational Skills
9 10 (2.05%) Back Office
9 10 (2.05%) Inclusion and Diversity
9 10 (2.05%) Telecoms
10 9 (1.84%) Financial Institution
10 9 (1.84%) Influencing Skills
10 9 (1.84%) Manufacturing
10 9 (1.84%) Marketing
11 7 (1.43%) Presentation Skills
12 6 (1.23%) Legal
12 6 (1.23%) Pharmaceutical
13 4 (0.82%) Local Government
Job Titles
1 92 (18.85%) Analyst
2 67 (13.73%) Developer
3 55 (11.27%) Senior
4 51 (10.45%) Lead
5 50 (10.25%) QA Engineer
6 37 (7.58%) Business Analyst
7 30 (6.15%) Test Analyst
7 30 (6.15%) Test Engineer
8 27 (5.53%) Tester
9 21 (4.30%) Architect
10 20 (4.10%) C# Developer
10 20 (4.10%) Consultant
11 17 (3.48%) QA Leader
12 14 (2.87%) C# WPF Developer
12 14 (2.87%) Data Engineer
12 14 (2.87%) DevOps Engineer
12 14 (2.87%) Project Manager
12 14 (2.87%) Senior Analyst
12 14 (2.87%) WPF Developer
13 13 (2.66%) QA Analyst
Libraries, Frameworks & Software Standards
1 33 (6.76%) .NET
2 19 (3.89%) Playwright
3 17 (3.48%) REST
4 16 (3.28%) .NET Framework
4 16 (3.28%) FIX Protocol
5 15 (3.07%) CSS
5 15 (3.07%) HTML
5 15 (3.07%) WPF
6 14 (2.87%) Kafka
6 14 (2.87%) WinForms
7 13 (2.66%) Web Services
8 11 (2.25%) pytest
8 11 (2.25%) React
8 11 (2.25%) RESTful
8 11 (2.25%) WCF
9 9 (1.84%) AngularJS
9 9 (1.84%) Node.js
10 8 (1.64%) Elastic Stack
10 8 (1.64%) XML
11 6 (1.23%) Middleware
Miscellaneous
1 35 (7.17%) Product Ownership
2 12 (2.46%) Mobile App
3 11 (2.25%) Management Information System
4 10 (2.05%) SWIFT Messaging Network
4 10 (2.05%) Virtual Team
5 9 (1.84%) Onboarding
6 8 (1.64%) Fixed Income
7 7 (1.43%) Digital Media
7 7 (1.43%) Legacy Systems
7 7 (1.43%) Public Cloud
7 7 (1.43%) Self-Motivation
8 6 (1.23%) Data Protection Act
8 6 (1.23%) Derivative
8 6 (1.23%) Foreign Exchange (FX)
9 5 (1.02%) Data Centre
9 5 (1.02%) Data Structures
9 5 (1.02%) Embedded Systems
9 5 (1.02%) IoT
10 4 (0.82%) Cloud Native
10 4 (0.82%) Video\Live Streaming
Operating Systems
1 48 (9.84%) Windows
2 26 (5.33%) Linux
3 15 (3.07%) Android
4 13 (2.66%) Apple iOS
5 6 (1.23%) Unix
5 6 (1.23%) Windows Server
6 3 (0.61%) Mac OS
6 3 (0.61%) Windows 10
7 1 (0.20%) CentOS
7 1 (0.20%) Embedded Linux
7 1 (0.20%) Red Hat Enterprise Linux
7 1 (0.20%) Rocky
7 1 (0.20%) Windows 7
7 1 (0.20%) Windows Server 2012
7 1 (0.20%) zOS
Processes & Methodologies
1 182 (37.30%) Agile
2 144 (29.51%) Test Automation
3 108 (22.13%) Problem-Solving
4 98 (20.08%) CI/CD
5 80 (16.39%) DevOps
6 66 (13.52%) Stakeholder Management
7 61 (12.50%) Scrum
8 58 (11.89%) User Acceptance Testing
9 51 (10.45%) Project Management
9 51 (10.45%) Validation
10 50 (10.25%) Migration
10 50 (10.25%) Software Testing
11 44 (9.02%) Test Strategy
12 43 (8.81%) Manual Testing
13 42 (8.61%) Continuous Improvement
14 39 (7.99%) Test Scripting
15 38 (7.79%) Risk Management
15 38 (7.79%) Stakeholder Engagement
16 37 (7.58%) User Stories
17 36 (7.38%) Analytics
Programming Languages
1 98 (20.08%) Python
2 88 (18.03%) SQL
3 82 (16.80%) Java
4 57 (11.68%) JavaScript
5 51 (10.45%) C#
6 25 (5.12%) VB
7 22 (4.51%) TypeScript
8 20 (4.10%) Bash
9 15 (3.07%) PL/SQL
9 15 (3.07%) VBA
10 13 (2.66%) T-SQL
11 11 (2.25%) PowerShell
11 11 (2.25%) Ruby
11 11 (2.25%) Scala
12 8 (1.64%) C++
13 7 (1.43%) PHP
13 7 (1.43%) Shell Script
14 6 (1.23%) Go
14 6 (1.23%) Swift
15 4 (0.82%) C
Qualifications
1 69 (14.14%) Security Cleared
2 58 (11.89%) SC Cleared
3 53 (10.86%) Degree
4 29 (5.94%) Computer Science Degree
5 13 (2.66%) ISTQB
6 12 (2.46%) AWS Certification
7 9 (1.84%) Master's Degree
8 6 (1.23%) BPSS Clearance
9 5 (1.02%) Microsoft Certification
9 5 (1.02%) PMI Certification
9 5 (1.02%) PMP
10 4 (0.82%) EnCE
11 3 (0.61%) Azure Certification
11 3 (0.61%) PRINCE2 Certification
12 2 (0.41%) AWS Certified Solutions Architect
12 2 (0.41%) CEH
12 2 (0.41%) CSPO
12 2 (0.41%) Dell Certification
12 2 (0.41%) Sun Certification
12 2 (0.41%) TOGAF Certification
Quality Assurance & Compliance
1 22 (4.51%) Data Quality
2 15 (3.07%) Accessibility
3 8 (1.64%) WCAG
4 7 (1.43%) PMO
5 6 (1.23%) GDPR
5 6 (1.23%) ISO/IEC 17025
6 3 (0.61%) California Consumer Privacy Act
6 3 (0.61%) HIPAA
6 3 (0.61%) ISO 9001
6 3 (0.61%) ISO/IEC 27001
6 3 (0.61%) SLA
7 2 (0.41%) EMIR
7 2 (0.41%) MiFID
7 2 (0.41%) NIST
7 2 (0.41%) SEPA
7 2 (0.41%) Software Quality Assurance
7 2 (0.41%) WAI
8 1 (0.20%) IFRS
8 1 (0.20%) IFRS 9
8 1 (0.20%) SOC 2
System Software
1 28 (5.74%) Docker
2 6 (1.23%) Active Directory
3 2 (0.41%) VMware Infrastructure
4 1 (0.20%) Microsoft App-V
4 1 (0.20%) Tivoli Workload Scheduler
4 1 (0.20%) Virtual Desktop
Systems Management
1 26 (5.33%) Terraform
2 23 (4.71%) Kubernetes
3 18 (3.69%) Ansible
4 9 (1.84%) Grafana
5 6 (1.23%) Progress Chef
6 5 (1.02%) Prometheus
6 5 (1.02%) Puppet
7 4 (0.82%) EnCase
7 4 (0.82%) FTK
8 2 (0.41%) Control-M
8 2 (0.41%) Kustomize
8 2 (0.41%) Nagios
8 2 (0.41%) Packer
8 2 (0.41%) Red Hat Satellite
8 2 (0.41%) Rundeck
8 2 (0.41%) Salt
8 2 (0.41%) SCCM
9 1 (0.20%) Argo
9 1 (0.20%) Single Sign-On
9 1 (0.20%) VxRail
Vendors
1 51 (10.45%) Microsoft
2 40 (8.20%) Oracle
3 30 (6.15%) SAP
4 21 (4.30%) Salesforce
5 17 (3.48%) Google
6 16 (3.28%) Citrix
7 12 (2.46%) Adobe
7 12 (2.46%) Databricks
8 9 (1.84%) ServiceNow
9 8 (1.64%) Splunk
10 6 (1.23%) Informatica
10 6 (1.23%) ION Trading
10 6 (1.23%) Planview
11 5 (1.02%) HP
11 5 (1.02%) Sitecore
12 4 (0.82%) Apple
12 4 (0.82%) Cellebrite
12 4 (0.82%) Dell
12 4 (0.82%) IBM
12 4 (0.82%) Nuix