Software Engineering Contract Job Trends in London

Software Engineering
England > London

The table below provides summary statistics and contractor rates for jobs advertised in London requiring Software Engineering skills. It covers contract job vacancies from the 6 months leading up to 20 October 2025, with comparisons to the same periods in the previous two years.

6 months to
20 Oct 2025
Same period 2024 Same period 2023
Rank 35 30 40
Rank change year-on-year -5 +10 -2
Contract jobs citing Software Engineering 795 1,011 1,051
As % of all contract jobs in London 5.98% 6.38% 5.03%
As % of the Processes & Methodologies category 6.47% 7.15% 5.59%
Number of daily rates quoted 531 766 824
10th Percentile £406 £450 £460
25th Percentile £513 £550 £550
Median daily rate (50th Percentile) £625 £675 £650
Median % change year-on-year -7.41% +3.85% +4.00%
75th Percentile £800 £850 £788
90th Percentile £850 £888 £854
England median daily rate £575 £600 £607
% change year-on-year -4.17% -1.07% +1.08%
Number of hourly rates quoted 12 8 14
10th Percentile £26.79 £52.13 £40.82
25th Percentile £42.40 £52.50 £44.96
Median hourly rate £65.00 £64.47 £56.25
Median % change year-on-year +0.83% +14.60% +15.57%
75th Percentile £81.88 £71.06 £70.65
90th Percentile £87.50 £74.23 £85.50
England median hourly rate £65.00 £65.00 £65.00

All Process and Methodology Skills
London

Software Engineering falls under the Processes and Methodologies category. For comparison with the information above, the following table provides summary statistics for all contract job vacancies requiring process or methodology skills in London.

Contract vacancies with a requirement for process or methodology skills 12,288 14,145 18,795
As % of all contract IT jobs advertised in London 92.45% 89.29% 89.95%
Number of daily rates quoted 8,086 9,142 13,599
10th Percentile £332 £350 £363
25th Percentile £425 £450 £463
Median daily rate (50th Percentile) £543 £550 £575
Median % change year-on-year -1.36% -4.35% -2.13%
75th Percentile £663 £675 £688
90th Percentile £775 £800 £800
England median daily rate £510 £525 £550
% change year-on-year -2.86% -4.55% -
Number of hourly rates quoted 243 175 231
10th Percentile £18.03 £17.70 £18.50
25th Percentile £25.00 £24.17 £21.63
Median hourly rate £30.50 £37.50 £39.42
Median % change year-on-year -18.67% -4.87% -0.20%
75th Percentile £47.75 £57.50 £62.75
90th Percentile £64.95 £78.75 £76.25
England median hourly rate £25.15 £41.50 £44.50
% change year-on-year -39.40% -6.74% +27.14%

Software Engineering
Job Vacancy Trend in London

Historical trend showing the proportion of contract IT job postings citing Software Engineering relative to all contract IT jobs advertised in London.
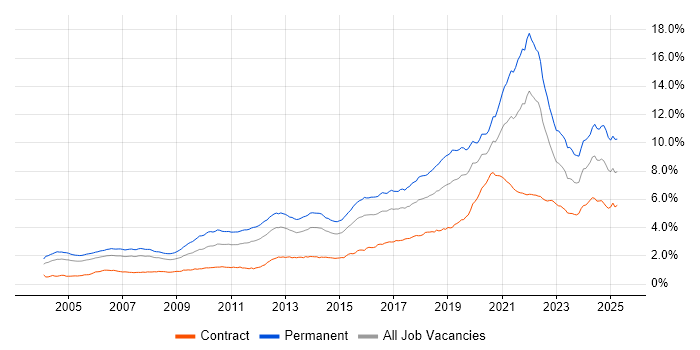
Software Engineering job vacancy trend in London

Software Engineering
Daily Rate Trend in London

Contractor daily rate distribution trend for jobs in London citing Software Engineering.

Contractor daily rate distribution trend for jobs in London citing Software Engineering

Software Engineering
Daily Rate Histogram in London

Daily rate distribution for jobs citing Software Engineering in London over the 6 months to 20 October 2025.

Daily rate histogram for Software Engineering in London

Software Engineering
Hourly Rate Trend in London

Contractor hourly rate distribution trend for jobs in London citing Software Engineering.

Contractor hourly rate distribution trend for jobs in London citing Software Engineering

Software Engineering
Hourly Rate Histogram in London

Hourly rate distribution of jobs citing Software Engineering in London over the 6 months to 20 October 2025.

Hourly rate histogram for Software Engineering in London

Software Engineering
Contract Job Locations in London

The table below looks at the demand and provides a guide to the median contractor rates quoted in IT jobs citing Software Engineering within the London region over the 6 months to 20 October 2025. The 'Rank Change' column provides an indication of the change in demand within each location based on the same 6 month period last year.

Location Rank Change
on Same Period
Last Year
Matching
Contract
IT Job Ads
Median
Daily Rate
Past 6 Months
Median Daily Rate
% Change
on Same Period
Last Year
Live
Jobs
Central London +25 97 £650 +14.54% 127
East London 0 8 £585 +10.90% 28
West London -17 7 - - 27
South London -5 6 £513 -27.30% 2
Software Engineering
England

Software Engineering
Co-Occurring Skills & Capabilities in London by Category

The following tables expand on the one above by listing co-occurrences grouped by category. They cover the same employment type, locality and period, with up to 20 co-occurrences shown in each category:

Application Platforms
1 76 (9.56%) Apache Airflow
2 61 (7.67%) Apache
3 35 (4.40%) Confluence
4 16 (2.01%) Apache Spark
5 5 (0.63%) JBoss
6 3 (0.38%) CMS
7 2 (0.25%) Appian
7 2 (0.25%) CICS
7 2 (0.25%) Headless CMS
7 2 (0.25%) SharePoint
8 1 (0.13%) Drupal
8 1 (0.13%) Luigi
8 1 (0.13%) Microsoft Exchange
8 1 (0.13%) nginx
8 1 (0.13%) Oracle Workflow
8 1 (0.13%) Tomcat
Applications
1 11 (1.38%) Microsoft Excel
2 8 (1.01%) Microsoft Office
3 7 (0.88%) Chatbot
3 7 (0.88%) Microsoft PowerPoint
4 5 (0.63%) MS Visio
5 2 (0.25%) Microsoft Project
Business Applications
1 9 (1.13%) FLEXCUBE
1 9 (1.13%) Oracle BPM
2 8 (1.01%) Aladdin
2 8 (1.01%) Temenos T24
3 3 (0.38%) Fidessa
3 3 (0.38%) thinkFolio
4 2 (0.25%) Dynamics CRM
4 2 (0.25%) Oracle 11i
5 1 (0.13%) ION Anvil
5 1 (0.13%) Oracle Procure-to-Pay
5 1 (0.13%) SAP Hybris
Cloud Services
1 334 (42.01%) AWS
2 158 (19.87%) Azure
3 114 (14.34%) GCP
4 76 (9.56%) Serverless
5 75 (9.43%) dbt
6 67 (8.43%) GitHub
7 54 (6.79%) Snowflake
8 42 (5.28%) GitHub Actions
9 30 (3.77%) AWS Lambda
10 27 (3.40%) Azure DevOps
11 24 (3.02%) Power Platform
12 20 (2.52%) Amazon S3
13 16 (2.01%) AWS Step Functions
14 15 (1.89%) Amazon CloudWatch
15 14 (1.76%) Amazon ECS
15 14 (1.76%) SaaS
16 13 (1.64%) Azure AKS
17 12 (1.51%) Entra ID
17 12 (1.51%) PaaS
17 12 (1.51%) Power Automate
Communications & Networking
1 6 (0.75%) Firewall
2 5 (0.63%) HTTP
2 5 (0.63%) Network Security
3 4 (0.50%) tcpdump
4 2 (0.25%) HTTPS
4 2 (0.25%) Internet
4 2 (0.25%) TCP/IP
4 2 (0.25%) VPN
5 1 (0.13%) DNS
5 1 (0.13%) MPLS
5 1 (0.13%) Radio Access Network
5 1 (0.13%) SMS
5 1 (0.13%) SSH
5 1 (0.13%) SSL
5 1 (0.13%) VoWiFi
Database & Business Intelligence
1 89 (11.19%) PostgreSQL
2 70 (8.81%) Amazon Athena
3 67 (8.43%) Apache Arrow
3 67 (8.43%) Apache Iceberg
3 67 (8.43%) Dremio
4 48 (6.04%) Data Lake
5 40 (5.03%) Apache Ignite
6 36 (4.53%) Apache Cassandra
7 33 (4.15%) Big Data
7 33 (4.15%) NoSQL
8 29 (3.65%) Hadoop
9 28 (3.52%) SQL Server
10 24 (3.02%) Elasticsearch
11 21 (2.64%) MongoDB
12 19 (2.39%) MySQL
12 19 (2.39%) Relational Database
13 18 (2.26%) Power BI
14 13 (1.64%) DynamoDB
15 12 (1.51%) Amazon RDS
15 12 (1.51%) DB2
Development Applications
1 81 (10.19%) Git
2 56 (7.04%) Jenkins
3 43 (5.41%) JIRA
4 27 (3.40%) GitLab
5 15 (1.89%) Cypress.io
6 13 (1.64%) Cucumber
6 13 (1.64%) Gradle
6 13 (1.64%) JUnit
6 13 (1.64%) TeamCity
7 10 (1.26%) SonarQube
8 9 (1.13%) Selenium
9 8 (1.01%) MLflow
10 7 (0.88%) Bitbucket
11 6 (0.75%) CircleCI
11 6 (0.75%) Maven
12 4 (0.50%) Mockito
13 3 (0.38%) Lerna
13 3 (0.38%) Postman
14 2 (0.25%) GoCD
14 2 (0.25%) Zephyr
General
1 304 (38.24%) Finance
2 162 (20.38%) Social Skills
3 158 (19.87%) Banking
4 138 (17.36%) Front Office
5 89 (11.19%) Investment Banking
6 46 (5.79%) Analytical Skills
7 36 (4.53%) Public Sector
8 16 (2.01%) Financial Institution
9 13 (1.64%) Inclusion and Diversity
9 13 (1.64%) Pharmaceutical
10 12 (1.51%) Military
11 10 (1.26%) Retail Banking
11 10 (1.26%) Telecoms
12 8 (1.01%) Retail
13 7 (0.88%) Documentation Skills
14 6 (0.75%) Back Office
14 6 (0.75%) Games
14 6 (0.75%) Influencing Skills
14 6 (0.75%) Publishing
15 5 (0.63%) Corporate Banking
Job Titles
1 324 (40.75%) Software Engineer
2 274 (34.47%) Developer
3 157 (19.75%) Senior
4 98 (12.33%) Python Engineer
5 83 (10.44%) Java Engineer
6 82 (10.31%) Java Software Engineer
7 79 (9.94%) Python Software Engineer
8 78 (9.81%) Senior Software Engineer
9 77 (9.69%) AWS Engineer
10 74 (9.31%) AWS Software Engineer
11 68 (8.55%) Developer/Software Engineer
12 66 (8.30%) Python Developer
13 56 (7.04%) Lead
14 46 (5.79%) AWS Developer
14 46 (5.79%) Java Developer
15 41 (5.16%) Senior Java Engineer
15 41 (5.16%) Senior Java Software Engineer
16 39 (4.91%) Full-Stack Engineer
17 36 (4.53%) Senior Developer
18 33 (4.15%) React Developer
Libraries, Frameworks & Software Standards
1 183 (23.02%) React
2 139 (17.48%) Kafka
3 117 (14.72%) Node.js
4 97 (12.20%) AngularJS
5 95 (11.95%) Pandas
6 91 (11.45%) NumPy
7 86 (10.82%) SciPy
8 82 (10.31%) gRPC
9 71 (8.93%) .NET
10 65 (8.18%) Vue
11 58 (7.30%) REST
12 49 (6.16%) RESTful
13 43 (5.41%) FastAPI
13 43 (5.41%) Spring
14 41 (5.16%) Redux
15 40 (5.03%) GraphQL
15 40 (5.03%) Protocol Buffers
16 31 (3.90%) HTML
17 28 (3.52%) Spring Boot
18 24 (3.02%) CSS
Miscellaneous
1 128 (16.10%) Foreign Exchange (FX)
2 123 (15.47%) Fixed Income
3 88 (11.07%) Equities
4 77 (9.69%) Hedge funds
5 76 (9.56%) Cloud Native
6 61 (7.67%) Distributed Systems
7 50 (6.29%) Derivative
8 40 (5.03%) Pricing Data
9 27 (3.40%) Data Structures
10 26 (3.27%) Algorithms
11 25 (3.14%) Product Ownership
11 25 (3.14%) Virtual Team
12 20 (2.52%) Data Protection Act
13 19 (2.39%) Greenfield Project
14 14 (1.76%) Genomics
15 13 (1.64%) Linux Command Line
15 13 (1.64%) Onboarding
16 12 (1.51%) Self-Motivation
17 11 (1.38%) AI Agents
17 11 (1.38%) Life Science
Operating Systems
1 94 (11.82%) Linux
2 34 (4.28%) Unix
3 18 (2.26%) Windows
4 12 (1.51%) Android
5 8 (1.01%) Apple iOS
6 5 (0.63%) Mac OS
7 3 (0.38%) Windows Server
8 2 (0.25%) AIX
8 2 (0.25%) VMS
8 2 (0.25%) zOS
9 1 (0.13%) Red Hat Enterprise Linux
9 1 (0.13%) Windows Server 2008
Processes & Methodologies
1 372 (46.79%) Agile
2 227 (28.55%) CI/CD
3 162 (20.38%) DevOps
4 133 (16.73%) Microservices
5 113 (14.21%) Investment Management
6 106 (13.33%) Problem-Solving
7 103 (12.96%) Full-Stack Development
8 98 (12.33%) AI
8 98 (12.33%) Asset Management
8 98 (12.33%) Fintech
9 95 (11.95%) Test Automation
10 84 (10.57%) Infrastructure as Code
11 83 (10.44%) Machine Learning
12 82 (10.31%) Clean Code
13 80 (10.06%) Mentoring
14 79 (9.94%) Computer Science
15 75 (9.43%) Containerisation
16 61 (7.67%) Scrum
17 56 (7.04%) TDD
18 52 (6.54%) Open Source
Programming Languages
1 364 (45.79%) Python
2 261 (32.83%) Java
3 211 (26.54%) JavaScript
4 190 (23.90%) TypeScript
5 157 (19.75%) SQL
6 120 (15.09%) C#
7 108 (13.58%) C++
8 69 (8.68%) Go
9 27 (3.40%) Rust
10 16 (2.01%) PL/SQL
11 12 (1.51%) Ruby
11 12 (1.51%) Scala
12 11 (1.38%) PHP
12 11 (1.38%) PowerShell
13 10 (1.26%) Bash
13 10 (1.26%) Bicep
13 10 (1.26%) C
14 8 (1.01%) Kotlin
15 4 (0.50%) DAML
15 4 (0.50%) R
Qualifications
1 95 (11.95%) Security Cleared
2 94 (11.82%) Degree
3 81 (10.19%) SC Cleared
4 33 (4.15%) Computer Science Degree
5 32 (4.03%) DV Cleared
6 9 (1.13%) Master's Degree
6 9 (1.13%) MCP
7 6 (0.75%) BPSS Clearance
8 5 (0.63%) PhD
9 4 (0.50%) AWS Certification
10 3 (0.38%) Azure Certification
10 3 (0.38%) EMC Certification
10 3 (0.38%) HNC
10 3 (0.38%) HND
10 3 (0.38%) ISTQB
10 3 (0.38%) Postgraduate
11 2 (0.25%) CISSP
11 2 (0.25%) DBS Check
11 2 (0.25%) SnowPro
12 1 (0.13%) ISTQB Foundation Certification
Quality Assurance & Compliance
1 31 (3.90%) QA
2 16 (2.01%) Data Quality
3 12 (1.51%) Accessibility
4 6 (0.75%) GDPR
5 5 (0.63%) NIST
5 5 (0.63%) SLA
6 4 (0.50%) ISO/IEC 27001
6 4 (0.50%) MiFID
6 4 (0.50%) SEPA
7 3 (0.38%) Def Stans
7 3 (0.38%) IEC 61508
7 3 (0.38%) ISO/IEC 15288
7 3 (0.38%) SOC 2
8 2 (0.25%) EU AI Act
8 2 (0.25%) ISO/IEC 27002 (supersedes ISO/IEC 17799)
8 2 (0.25%) PMO
8 2 (0.25%) WCAG
9 1 (0.13%) EMIR
9 1 (0.13%) GxP
9 1 (0.13%) HIPAA
System Software
1 169 (21.26%) Docker
2 9 (1.13%) Active Directory
3 5 (0.63%) zsh
4 1 (0.13%) KVM
4 1 (0.13%) VMware Infrastructure
Systems Management
1 157 (19.75%) Kubernetes
2 58 (7.30%) Terraform
3 19 (2.39%) Grafana
4 18 (2.26%) Ansible
5 17 (2.14%) Prometheus
6 5 (0.63%) Kibana
7 4 (0.50%) Argo
8 3 (0.38%) Functional Safety
9 2 (0.25%) CA Endevor
9 2 (0.25%) Kubeflow
9 2 (0.25%) rkt
10 1 (0.13%) Docker Swarm
10 1 (0.13%) HP ALM
10 1 (0.13%) HP Quality Center
10 1 (0.13%) Microsoft Intune
10 1 (0.13%) Packer
10 1 (0.13%) Single Sign-On
Vendors
1 52 (6.54%) Microsoft
2 42 (5.28%) Oracle
3 24 (3.02%) Google
4 23 (2.89%) Foundry
5 20 (2.52%) Databricks
6 15 (1.89%) Palantir
7 14 (1.76%) Cloudera
8 10 (1.26%) Temenos
9 8 (1.01%) OpenAI
10 7 (0.88%) IBM
11 6 (0.75%) Atlassian
11 6 (0.75%) Salesforce
12 5 (0.63%) Cisco
12 5 (0.63%) DocuSign
12 5 (0.63%) Splunk
13 4 (0.50%) Dynatrace
13 4 (0.50%) Murex
14 3 (0.38%) EMC
14 3 (0.38%) Portware
14 3 (0.38%) Red Hat