Azure DevOps Contract Job Trends in London

Microsoft Azure DevOps
England > London

The table below provides summary statistics and contractor rates for jobs advertised in London requiring Azure DevOps skills. It covers contract job vacancies from the 6 months leading up to 29 October 2025, with comparisons to the same periods in the previous two years.

6 months to
29 Oct 2025
Same period 2024 Same period 2023
Rank 78 72 72
Rank change year-on-year -6 0 +14
Contract jobs citing Azure DevOps 477 518 622
As % of all contract jobs in London 3.50% 3.29% 3.05%
As % of the Cloud Services category 7.95% 7.97% 7.87%
Number of daily rates quoted 341 351 446
10th Percentile £350 £388 £425
25th Percentile £413 £461 £500
Median daily rate (50th Percentile) £525 £550 £575
Median % change year-on-year -4.55% -4.35% -
75th Percentile £650 £638 £650
90th Percentile £725 £704 £725
England median daily rate £510 £525 £550
% change year-on-year -2.86% -4.55% -
Number of hourly rates quoted 1 0 0
10th Percentile - - -
25th Percentile £86.25 - -
Median hourly rate £87.50 - -
75th Percentile £88.75 - -
90th Percentile - - -
England median hourly rate £74.63 - £68.50
% change year-on-year - - +4.12%

All Cloud Skills
London

Azure DevOps falls under the Cloud Services category. For comparison with the information above, the following table provides summary statistics for all contract job vacancies requiring cloud computing skills in London.

Contract vacancies with a requirement for cloud computing skills 6,000 6,496 7,906
As % of all contract IT jobs advertised in London 43.97% 41.22% 38.82%
Number of daily rates quoted 4,063 4,425 5,816
10th Percentile £348 £350 £350
25th Percentile £425 £450 £450
Median daily rate (50th Percentile) £525 £550 £550
Median % change year-on-year -4.55% - -5.98%
75th Percentile £650 £675 £675
90th Percentile £763 £788 £775
England median daily rate £500 £530 £535
% change year-on-year -5.66% -0.93% -2.73%
Number of hourly rates quoted 109 36 65
10th Percentile £18.75 £21.50 £17.40
25th Percentile £24.00 £23.80 £22.00
Median hourly rate £26.30 £33.75 £38.75
Median % change year-on-year -22.07% -12.90% +23.02%
75th Percentile £46.75 £54.69 £65.00
90th Percentile £79.00 £71.13 £89.00
England median hourly rate £25.15 £35.50 £27.50
% change year-on-year -29.15% +29.09% +22.22%

Azure DevOps
Job Vacancy Trend in London

Historical trend showing the proportion of contract IT job postings citing Azure DevOps relative to all contract IT jobs advertised in London.
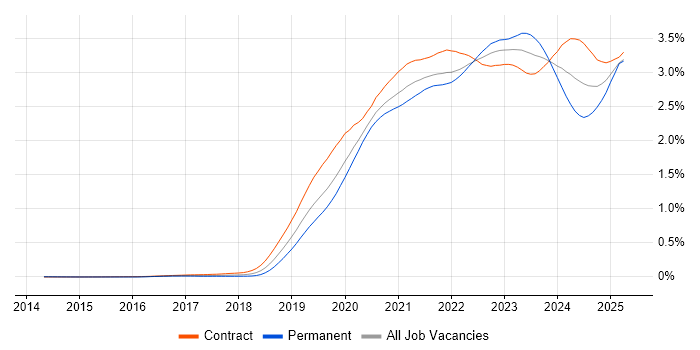
Azure DevOps job vacancy trend in London

Azure DevOps
Daily Rate Trend in London

Contractor daily rate distribution trend for jobs in London citing Azure DevOps.

Contractor daily rate distribution trend for jobs in London citing Azure DevOps

Azure DevOps
Daily Rate Histogram in London

Daily rate distribution for jobs citing Azure DevOps in London over the 6 months to 29 October 2025.

Daily rate histogram for Azure DevOps in London

Azure DevOps
Hourly Rate Trend in London

Contractor hourly rate distribution trend for jobs in London citing Azure DevOps.

Contractor hourly rate distribution trend for jobs in London citing Azure DevOps

Azure DevOps
Contract Job Locations in London

The table below looks at the demand and provides a guide to the median contractor rates quoted in IT jobs citing Azure DevOps within the London region over the 6 months to 29 October 2025. The 'Rank Change' column provides an indication of the change in demand within each location based on the same 6 month period last year.

Location Rank Change
on Same Period
Last Year
Matching
Contract
IT Job Ads
Median
Daily Rate
Past 6 Months
Median Daily Rate
% Change
on Same Period
Last Year
Live
Jobs
Central London -14 68 £550 - 81
East London -3 4 £553 +25.93% 3
South London -6 4 £513 +34.71%
West London -12 1 £520 +9.47% 4
Azure DevOps
England

Azure DevOps
Co-Occurring Skills & Capabilities in London by Category

The following tables expand on the one above by listing co-occurrences grouped by category. They cover the same employment type, locality and period, with up to 20 co-occurrences shown in each category:

Application Platforms
1 30 (6.29%) Confluence
2 20 (4.19%) SharePoint
3 11 (2.31%) Apache
4 10 (2.10%) Apache Airflow
5 9 (1.89%) Apache Spark
6 3 (0.63%) Microsoft Exchange
7 2 (0.42%) CMS
8 1 (0.21%) Anypoint
8 1 (0.21%) Appian
8 1 (0.21%) Headless CMS
8 1 (0.21%) Jupyter
8 1 (0.21%) Kentico
8 1 (0.21%) Mule
Applications
1 12 (2.52%) Microsoft Excel
2 8 (1.68%) Microsoft Office
2 8 (1.68%) Microsoft Project
3 6 (1.26%) MS Visio
4 3 (0.63%) Microsoft PowerPoint
4 3 (0.63%) Trello
5 2 (0.42%) Chatbot
Business Applications
1 22 (4.61%) Dynamics CRM
2 14 (2.94%) Endur
3 9 (1.89%) Aladdin
4 4 (0.84%) SAP S/4HANA
5 2 (0.42%) Salesforce CRM
6 1 (0.21%) Orchestrade
6 1 (0.21%) SAP BPC
6 1 (0.21%) SAP Oil and Gas
6 1 (0.21%) Sparx Enterprise Architect
6 1 (0.21%) Temenos T24
Cloud Services
1 477 (100.00%) Azure
2 101 (21.17%) Power Platform
3 93 (19.50%) GitHub
4 72 (15.09%) AWS
5 61 (12.79%) GitHub Actions
6 54 (11.32%) Serverless
7 51 (10.69%) Azure Data Factory
8 50 (10.48%) Azure AKS
9 47 (9.85%) Azure Monitor
9 47 (9.85%) Dynamics 365
10 45 (9.43%) Entra ID
11 41 (8.60%) Power Automate
11 41 (8.60%) PowerApps
12 37 (7.76%) Azure Logic Apps
13 36 (7.55%) Azure Functions
14 35 (7.34%) Azure Service Bus
14 35 (7.34%) Azure Synapse Analytics
15 30 (6.29%) GCP
15 30 (6.29%) PaaS
16 28 (5.87%) Azure Cosmos DB
Communications & Networking
1 26 (5.45%) Firewall
2 13 (2.73%) Network Security
2 13 (2.73%) VPN
3 10 (2.10%) DNS
4 7 (1.47%) WAN
5 6 (1.26%) HTTPS
6 5 (1.05%) SD-WAN
6 5 (1.05%) SSL
7 3 (0.63%) Remote Desktop
8 2 (0.42%) DHCP
8 2 (0.42%) LAN
8 2 (0.42%) TCP/IP
9 1 (0.21%) AMQP
9 1 (0.21%) BGP
9 1 (0.21%) DSL
9 1 (0.21%) HTTP
9 1 (0.21%) IPsec
9 1 (0.21%) MPLS
9 1 (0.21%) VRRP
9 1 (0.21%) WLAN
Database & Business Intelligence
1 62 (13.00%) Power BI
2 35 (7.34%) SQL Server
3 20 (4.19%) Azure SQL Database
3 20 (4.19%) Data Lake
4 19 (3.98%) Delta Lake
4 19 (3.98%) PostgreSQL
5 17 (3.56%) Redis
6 16 (3.35%) Data Warehouse
7 14 (2.94%) NoSQL
8 13 (2.73%) MongoDB
9 9 (1.89%) Relational Database
10 6 (1.26%) Elasticsearch
10 6 (1.26%) Metadata
10 6 (1.26%) SQL Server Reporting Services
11 5 (1.05%) SQL Server Integration Services
12 4 (0.84%) Data Mart
12 4 (0.84%) MySQL
13 3 (0.63%) Big Data
13 3 (0.63%) DynamoDB
13 3 (0.63%) Tableau
Development Applications
1 96 (20.13%) JIRA
2 65 (13.63%) Git
3 50 (10.48%) Jenkins
4 34 (7.13%) GitLab
5 21 (4.40%) Selenium
6 15 (3.14%) Postman
6 15 (3.14%) SonarQube
7 10 (2.10%) Cucumber
7 10 (2.10%) TeamCity
8 9 (1.89%) JMeter
9 8 (1.68%) Appium
9 8 (1.68%) JUnit
10 7 (1.47%) NUnit
10 7 (1.47%) SpecFlow
10 7 (1.47%) Team Foundation Server
10 7 (1.47%) WebDriver
11 6 (1.26%) Bitbucket
11 6 (1.26%) Octopus Deploy
12 5 (1.05%) Cypress.io
12 5 (1.05%) Zephyr
General
1 166 (34.80%) Social Skills
2 108 (22.64%) Finance
3 47 (9.85%) Analytical Skills
4 40 (8.39%) Public Sector
5 39 (8.18%) Banking
6 25 (5.24%) Investment Banking
7 20 (4.19%) Inclusion and Diversity
8 18 (3.77%) Documentation Skills
9 14 (2.94%) Retail
10 13 (2.73%) Law
11 12 (2.52%) Influencing Skills
11 12 (2.52%) Marketing
12 8 (1.68%) Back Office
13 6 (1.26%) Presentation Skills
14 5 (1.05%) Front Office
14 5 (1.05%) Military
15 4 (0.84%) Financial Institution
15 4 (0.84%) Telecoms
16 3 (0.63%) General Ledger
16 3 (0.63%) Manufacturing
Job Titles
1 127 (26.62%) Developer
2 64 (13.42%) Azure Engineer
3 57 (11.95%) DevOps Engineer
4 46 (9.64%) Senior
5 43 (9.01%) Analyst
6 37 (7.76%) Lead
7 36 (7.55%) Architect
7 36 (7.55%) Azure DevOps Engineer
8 32 (6.71%) Business Analyst
9 28 (5.87%) Data Engineer
10 23 (4.82%) Azure Developer
11 20 (4.19%) Azure Architect
11 20 (4.19%) Senior Developer
12 19 (3.98%) .NET Developer
13 18 (3.77%) C# Developer
14 17 (3.56%) Test Engineer
15 16 (3.35%) Project Manager
15 16 (3.35%) ServiceNow Developer
16 14 (2.94%) Cloud Engineer
16 14 (2.94%) Tester
Libraries, Frameworks & Software Standards
1 102 (21.38%) .NET
2 51 (10.69%) REST
3 38 (7.97%) SOAP
4 30 (6.29%) ARM Templates
4 30 (6.29%) React
4 30 (6.29%) RESTful
5 25 (5.24%) .NET Core
5 25 (5.24%) HTML
6 24 (5.03%) Kafka
6 24 (5.03%) YAML
7 22 (4.61%) ADO
8 20 (4.19%) ASP.NET
8 20 (4.19%) CSS
8 20 (4.19%) Node.js
9 19 (3.98%) .NET Framework
9 19 (3.98%) PySpark
10 15 (3.14%) XML
11 13 (2.73%) Next.js
12 12 (2.52%) Playwright
12 12 (2.52%) Web Services
Miscellaneous
1 35 (7.34%) Cloud Native
2 18 (3.77%) CMDB
3 17 (3.56%) Product Ownership
4 15 (3.14%) Distributed Systems
5 11 (2.31%) Foreign Exchange (FX)
5 11 (2.31%) Legacy Systems
6 10 (2.10%) Fixed Income
6 10 (2.10%) Mobile App
7 9 (1.89%) Data Structures
7 9 (1.89%) Hybrid Cloud
7 9 (1.89%) Reinsurance
8 7 (1.47%) Enterprise Software
8 7 (1.47%) Greenfield Project
8 7 (1.47%) Public Cloud
9 6 (1.26%) Linux Command Line
9 6 (1.26%) Self-Motivation
10 5 (1.05%) Analytical Mindset
10 5 (1.05%) Data Protection Act
10 5 (1.05%) Low-Code
10 5 (1.05%) PMI
Operating Systems
1 20 (4.19%) Linux
2 17 (3.56%) Windows
3 12 (2.52%) Android
3 12 (2.52%) Apple iOS
4 8 (1.68%) Unix
5 5 (1.05%) VMS
6 3 (0.63%) Red Hat Enterprise Linux
6 3 (0.63%) Windows Server
7 1 (0.21%) Solaris
7 1 (0.21%) Windows 10
7 1 (0.21%) Windows 7
7 1 (0.21%) Windows Server 2016
Processes & Methodologies
1 476 (99.79%) DevOps
2 251 (52.62%) Agile
3 237 (49.69%) CI/CD
4 122 (25.58%) Infrastructure as Code
5 96 (20.13%) Scrum
6 95 (19.92%) Problem-Solving
7 83 (17.40%) Analytics
8 79 (16.56%) Test Automation
9 65 (13.63%) Business Intelligence
10 56 (11.74%) Migration
11 53 (11.11%) Containerisation
12 52 (10.90%) Microservices
13 50 (10.48%) Continuous Improvement
14 48 (10.06%) Data Engineering
15 46 (9.64%) AI
15 46 (9.64%) Stakeholder Management
16 45 (9.43%) Data Modelling
16 45 (9.43%) TDD
17 43 (9.01%) Stakeholder Engagement
18 39 (8.18%) Workflow
Programming Languages
1 138 (28.93%) SQL
2 130 (27.25%) Python
3 115 (24.11%) C#
4 81 (16.98%) JavaScript
5 70 (14.68%) PowerShell
6 49 (10.27%) Bicep
7 48 (10.06%) Java
8 32 (6.71%) Bash
9 26 (5.45%) TypeScript
10 5 (1.05%) T-SQL
10 5 (1.05%) VB.NET
11 4 (0.84%) Kusto Query Language
11 4 (0.84%) PL/SQL
11 4 (0.84%) Shell Script
12 3 (0.63%) Data Analysis Expressions
12 3 (0.63%) Korn
12 3 (0.63%) X++
13 2 (0.42%) Go
13 2 (0.42%) Groovy
13 2 (0.42%) VB
Qualifications
1 87 (18.24%) Security Cleared
2 74 (15.51%) SC Cleared
3 42 (8.81%) Degree
4 38 (7.97%) Azure Certification
5 18 (3.77%) Computer Science Degree
6 17 (3.56%) Microsoft Certification
7 12 (2.52%) ISTQB
8 10 (2.10%) PMI Certification
9 9 (1.89%) Numerate Degree
10 8 (1.68%) Master's Degree
11 6 (1.26%) PMP
12 4 (0.84%) BPSS Clearance
12 4 (0.84%) CBAP
12 4 (0.84%) CISSP
12 4 (0.84%) DV Cleared
12 4 (0.84%) ISEB
12 4 (0.84%) ISTQB Foundation Certification
12 4 (0.84%) ITIL Certification
13 2 (0.42%) CISM
14 1 (0.21%) CISA
Quality Assurance & Compliance
1 31 (6.50%) QA
2 26 (5.45%) Data Quality
3 19 (3.98%) GDPR
4 18 (3.77%) Accessibility
5 10 (2.10%) ISO/IEC 27001
6 9 (1.89%) NIST
7 4 (0.84%) WCAG
8 3 (0.63%) NCSC
8 3 (0.63%) Solvency II
9 2 (0.42%) EU AI Act
9 2 (0.42%) Government Security Classifications
9 2 (0.42%) ISO/IEC 27002 (supersedes ISO/IEC 17799)
9 2 (0.42%) PMO
9 2 (0.42%) Sarbanes-Oxley
9 2 (0.42%) SOC 2
10 1 (0.21%) California Consumer Privacy Act
10 1 (0.21%) HIPAA
10 1 (0.21%) HL7
10 1 (0.21%) ISO/IEC 42001
10 1 (0.21%) PCI DSS
System Software
1 70 (14.68%) Docker
2 32 (6.71%) Active Directory
3 12 (2.52%) Virtual Machines
4 6 (1.26%) Virtual Desktop
5 1 (0.21%) KVM
5 1 (0.21%) OpenAM
5 1 (0.21%) OpenDJ
5 1 (0.21%) OpenIDM
5 1 (0.21%) Squid
5 1 (0.21%) VMware Infrastructure
Systems Management
1 125 (26.21%) Terraform
2 74 (15.51%) Kubernetes
3 34 (7.13%) Ansible
4 14 (2.94%) Grafana
5 13 (2.73%) Prometheus
6 9 (1.89%) ITRS Geneos
7 7 (1.47%) Kibana
7 7 (1.47%) Progress Chef
8 5 (1.05%) Puppet
9 4 (0.84%) Istio
9 4 (0.84%) Microsoft Intune
10 3 (0.63%) Argo
10 3 (0.63%) HP ALM
10 3 (0.63%) Packer
10 3 (0.63%) Single Sign-On
11 2 (0.42%) Fluentd
11 2 (0.42%) Jamf Pro
12 1 (0.21%) linkerd
12 1 (0.21%) SCCM
Vendors
1 153 (32.08%) Microsoft
2 60 (12.58%) Databricks
3 28 (5.87%) ServiceNow
4 17 (3.56%) Salesforce
5 11 (2.31%) OpenAI
5 11 (2.31%) SAP
6 10 (2.10%) Oracle
7 8 (1.68%) Murex
8 7 (1.47%) DocuSign
8 7 (1.47%) Guidewire
9 6 (1.26%) Duck Creek
10 5 (1.05%) Aruba
10 5 (1.05%) Cisco
10 5 (1.05%) Google
10 5 (1.05%) UiPath
11 3 (0.63%) Fortinet
11 3 (0.63%) HP
11 3 (0.63%) OneTrust
11 3 (0.63%) OpenLink
11 3 (0.63%) Sitecore