Risk Management Contract Job Trends in London

Risk Management
England > London

The table below provides summary statistics and contractor rates for jobs advertised in London requiring Risk Management skills. It covers contract job vacancies from the 6 months leading up to 16 October 2025, with comparisons to the same periods in the previous two years.

6 months to
16 Oct 2025
Same period 2024 Same period 2023
Rank 51 65 54
Rank change year-on-year +14 -11 +27
Contract jobs citing Risk Management 680 569 856
As % of all contract jobs in London 5.08% 3.54% 4.13%
As % of the Processes & Methodologies category 5.49% 3.97% 4.58%
Number of daily rates quoted 450 339 599
10th Percentile £390 £408 £425
25th Percentile £488 £500 £513
Median daily rate (50th Percentile) £650 £613 £620
Median % change year-on-year +6.12% -1.21% +3.33%
75th Percentile £799 £750 £760
90th Percentile £925 £863 £990
England median daily rate £575 £575 £600
% change year-on-year - -4.17% -
Number of hourly rates quoted 5 4 4
10th Percentile £41.75 £24.28 -
25th Percentile - £30.69 £21.50
Median hourly rate £65.00 £54.55 £21.75
Median % change year-on-year +19.16% +150.80% -73.31%
75th Percentile - £79.60 £26.36
90th Percentile £82.25 £81.76 £34.19
England median hourly rate £33.50 £57.50 £60.00
% change year-on-year -41.74% -4.17% +17.65%

All Process and Methodology Skills
London

Risk Management falls under the Processes and Methodologies category. For comparison with the information above, the following table provides summary statistics for all contract job vacancies requiring process or methodology skills in London.

Contract vacancies with a requirement for process or methodology skills 12,381 14,325 18,683
As % of all contract IT jobs advertised in London 92.48% 89.25% 90.07%
Number of daily rates quoted 8,179 9,289 13,517
10th Percentile £334 £350 £363
25th Percentile £425 £450 £463
Median daily rate (50th Percentile) £540 £550 £575
Median % change year-on-year -1.82% -4.35% -1.88%
75th Percentile £663 £675 £690
90th Percentile £775 £800 £800
England median daily rate £510 £525 £550
% change year-on-year -2.86% -4.55% -
Number of hourly rates quoted 241 177 228
10th Percentile £18.25 £17.40 £18.50
25th Percentile £25.15 £24.18 £21.69
Median hourly rate £31.49 £37.50 £40.00
Median % change year-on-year -16.03% -6.25% +5.44%
75th Percentile £48.00 £57.50 £63.75
90th Percentile £65.00 £78.75 £76.63
England median hourly rate £25.15 £42.50 £45.00
% change year-on-year -40.82% -5.56% +36.36%

Risk Management
Job Vacancy Trend in London

Historical trend showing the proportion of contract IT job postings citing Risk Management relative to all contract IT jobs advertised in London.
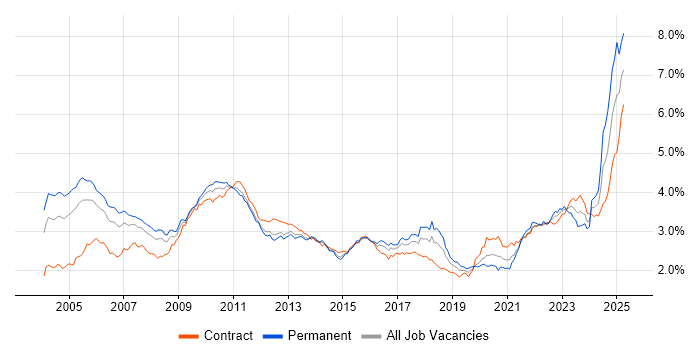
Risk Management job vacancy trend in London

Risk Management
Daily Rate Trend in London

Contractor daily rate distribution trend for jobs in London citing Risk Management.

Contractor daily rate distribution trend for jobs in London citing Risk Management

Risk Management
Daily Rate Histogram in London

Daily rate distribution for jobs citing Risk Management in London over the 6 months to 16 October 2025.

Daily rate histogram for Risk Management in London

Risk Management
Hourly Rate Trend in London

Contractor hourly rate distribution trend for jobs in London citing Risk Management.

Contractor hourly rate distribution trend for jobs in London citing Risk Management

Risk Management
Hourly Rate Histogram in London

Hourly rate distribution of jobs citing Risk Management in London over the 6 months to 16 October 2025.

Hourly rate histogram for Risk Management in London

Risk Management
Contract Job Locations in London

The table below looks at the demand and provides a guide to the median contractor rates quoted in IT jobs citing Risk Management within the London region over the 6 months to 16 October 2025. The 'Rank Change' column provides an indication of the change in demand within each location based on the same 6 month period last year.

Location Rank Change
on Same Period
Last Year
Matching
Contract
IT Job Ads
Median
Daily Rate
Past 6 Months
Median Daily Rate
% Change
on Same Period
Last Year
Live
Jobs
Central London -6 87 £650 +4.84% 152
South London +1 12 £581 -6.98% 9
West London -2 11 £425 -15.00% 7
East London +2 4 £360 -40.00% 4
North London - 3 £550 - 1
Risk Management
England

Risk Management
Co-Occurring Skills & Capabilities in London by Category

The following tables expand on the one above by listing co-occurrences grouped by category. They cover the same employment type, locality and period, with up to 20 co-occurrences shown in each category:

Application Platforms
1 36 (5.29%) Confluence
2 29 (4.26%) Apache Airflow
3 9 (1.32%) Apache Spark
4 8 (1.18%) SharePoint
5 5 (0.74%) CMS
6 3 (0.44%) Oracle Workflow
7 2 (0.29%) IIS
7 2 (0.29%) Microsoft Exchange
8 1 (0.15%) Apache
8 1 (0.15%) Camunda
8 1 (0.15%) IBM HTTP Server
8 1 (0.15%) Kentico
8 1 (0.15%) Sitecore CMS
8 1 (0.15%) Umbraco
Applications
1 32 (4.71%) Microsoft Excel
2 22 (3.24%) Microsoft Office
3 14 (2.06%) Microsoft PowerPoint
4 10 (1.47%) Microsoft Project
5 8 (1.18%) MS Visio
6 4 (0.59%) Trello
7 2 (0.29%) GNU Octave
8 1 (0.15%) Chatbot
8 1 (0.15%) Navisworks
8 1 (0.15%) ProjectWise
8 1 (0.15%) Revit
8 1 (0.15%) Spreadsheet
Business Applications
1 21 (3.09%) Endur
2 10 (1.47%) SAP S/4HANA
3 6 (0.88%) Aladdin
4 4 (0.59%) ION Anvil
4 4 (0.59%) Oracle EBS
5 3 (0.44%) Oracle Assets
5 3 (0.44%) Oracle EBS R12
5 3 (0.44%) Oracle Payables
5 3 (0.44%) SAP ERP
5 3 (0.44%) SAP IBP
6 2 (0.29%) Actimize
6 2 (0.29%) Distributed Ledger
6 2 (0.29%) Oracle General Ledger
6 2 (0.29%) Salesforce CRM
6 2 (0.29%) SAP CO
6 2 (0.29%) SAP FI
6 2 (0.29%) SAP FI/CO
6 2 (0.29%) SAP GTS
6 2 (0.29%) Workday HCM
7 1 (0.15%) Loan IQ
Cloud Services
1 106 (15.59%) AWS
2 66 (9.71%) Azure
3 51 (7.50%) GCP
4 30 (4.41%) dbt
5 22 (3.24%) Power Platform
6 21 (3.09%) SaaS
7 14 (2.06%) Microsoft 365
8 13 (1.91%) GitHub
9 10 (1.47%) Entra ID
10 8 (1.18%) Azure DevOps
10 8 (1.18%) Miro
11 7 (1.03%) Cloud Computing
11 7 (1.03%) Microsoft Purview
11 7 (1.03%) Snowflake
12 5 (0.74%) IaaS
13 4 (0.59%) Amazon EC2
13 4 (0.59%) Azure Sentinel
13 4 (0.59%) OpenShift
13 4 (0.59%) WhatsApp
14 3 (0.44%) AWS KMS
Communications & Networking
1 24 (3.53%) Firewall
2 8 (1.18%) Multicast
3 6 (0.88%) Network Security
4 4 (0.59%) S/MIME
4 4 (0.59%) SSL
4 4 (0.59%) WAN
4 4 (0.59%) Wi-Fi
5 3 (0.44%) LAN
6 2 (0.29%) VPN
7 1 (0.15%) Cisco IPT
7 1 (0.15%) DNS
7 1 (0.15%) Intranet
7 1 (0.15%) Intrusion Detection
7 1 (0.15%) MPLS
7 1 (0.15%) SAN
7 1 (0.15%) SD-WAN
Database & Business Intelligence
1 52 (7.65%) PostgreSQL
2 29 (4.26%) Amazon Athena
2 29 (4.26%) Apache Arrow
2 29 (4.26%) Apache Iceberg
2 29 (4.26%) Dremio
3 25 (3.68%) SQL Server
4 22 (3.24%) Power BI
5 9 (1.32%) Relational Database
6 8 (1.18%) Tableau
7 6 (0.88%) Big Data
7 6 (0.88%) KDB
7 6 (0.88%) Kdb+
8 5 (0.74%) Amazon RDS
8 5 (0.74%) Data Warehouse
8 5 (0.74%) MongoDB
9 4 (0.59%) Data Lake
9 4 (0.59%) Hadoop
9 4 (0.59%) NoSQL
9 4 (0.59%) Oracle Reports
10 3 (0.44%) Amazon Aurora
Development Applications
1 64 (9.41%) JIRA
2 15 (2.21%) Git
3 14 (2.06%) SpecFlow
4 8 (1.18%) GCC
4 8 (1.18%) GDB
5 7 (1.03%) SonarQube
6 6 (0.88%) Jenkins
6 6 (0.88%) Maven
6 6 (0.88%) TeamCity
7 5 (0.74%) QUnit
8 4 (0.59%) Bitbucket
9 3 (0.44%) IntelliJ
9 3 (0.44%) JUnit
9 3 (0.44%) Mockito
9 3 (0.44%) Oracle Forms
9 3 (0.44%) Sonatype Nexus
10 2 (0.29%) Artifactory
10 2 (0.29%) MLflow
10 2 (0.29%) Snyk
11 1 (0.15%) Bitbucket Server
General
1 372 (54.71%) Finance
2 285 (41.91%) Social Skills
3 156 (22.94%) Banking
4 120 (17.65%) Analytical Skills
5 99 (14.56%) Front Office
6 49 (7.21%) Investment Banking
6 49 (7.21%) Legal
7 39 (5.74%) Public Sector
8 22 (3.24%) Back Office
8 22 (3.24%) Financial Institution
9 21 (3.09%) Organisational Skills
10 18 (2.65%) Telecoms
11 17 (2.50%) Influencing Skills
12 13 (1.91%) Presentation Skills
13 12 (1.76%) Inclusion and Diversity
14 11 (1.62%) Law
15 10 (1.47%) International Banking
15 10 (1.47%) Retail
16 9 (1.32%) Local Government
16 9 (1.32%) Marketing
Job Titles
1 129 (18.97%) Developer
2 120 (17.65%) Analyst
3 91 (13.38%) Senior
4 80 (11.76%) Project Manager
5 64 (9.41%) Lead
6 63 (9.26%) Business Analyst
7 54 (7.94%) Architect
8 49 (7.21%) AWS Developer
9 44 (6.47%) Consultant
10 38 (5.59%) Senior Developer
11 37 (5.44%) Java Developer
12 33 (4.85%) Risk Analyst
13 30 (4.41%) Software Engineer
14 29 (4.26%) AWS Engineer
14 29 (4.26%) AWS Software Engineer
14 29 (4.26%) Developer/Software Engineer
14 29 (4.26%) Python Developer
15 25 (3.68%) IT Manager
16 23 (3.38%) Security Architect
17 22 (3.24%) Programme Manager
Libraries, Frameworks & Software Standards
1 52 (7.65%) AngularJS
2 48 (7.06%) React
3 32 (4.71%) Node.js
4 31 (4.56%) NumPy
5 30 (4.41%) Pandas
5 30 (4.41%) SciPy
6 29 (4.26%) .NET
6 29 (4.26%) Vue
7 22 (3.24%) Kafka
8 16 (2.35%) .NET Framework
8 16 (2.35%) REST
8 16 (2.35%) RESTful
9 14 (2.06%) Entity Framework
9 14 (2.06%) NHibernate
9 14 (2.06%) Playwright
10 11 (1.62%) Middleware
11 8 (1.18%) Boost C++ Libraries
11 8 (1.18%) STL
11 8 (1.18%) TensorFlow
11 8 (1.18%) XML
Miscellaneous
1 82 (12.06%) Management Information System
2 58 (8.53%) Foreign Exchange (FX)
3 49 (7.21%) Derivative
4 48 (7.06%) Fixed Income
5 46 (6.76%) Equities
6 40 (5.88%) Market Risk
7 34 (5.00%) Product Ownership
8 25 (3.68%) Algorithms
8 25 (3.68%) Credit Risk
9 21 (3.09%) Security Posture
10 18 (2.65%) Cloud Native
11 16 (2.35%) Data Protection Act
11 16 (2.35%) Onboarding
12 15 (2.21%) Distributed Systems
13 12 (1.76%) Legacy Systems
14 11 (1.62%) Analytical Mindset
14 11 (1.62%) Data Structures
15 10 (1.47%) Data Centre
15 10 (1.47%) Taxonomies
16 9 (1.32%) Cyber Threat
Operating Systems
1 30 (4.41%) Linux
2 17 (2.50%) Unix
3 11 (1.62%) Windows
4 2 (0.29%) Windows Server
5 1 (0.15%) Mac OS
5 1 (0.15%) VMS
5 1 (0.15%) Windows 7
5 1 (0.15%) Windows Server 2003
5 1 (0.15%) Windows Server 2008
5 1 (0.15%) Windows Server 2012
Processes & Methodologies
1 204 (30.00%) Agile
2 154 (22.65%) Stakeholder Management
3 131 (19.26%) Problem-Solving
4 127 (18.68%) Project Management
5 123 (18.09%) Stakeholder Engagement
6 80 (11.76%) Cybersecurity
7 77 (11.32%) Scrum
8 76 (11.18%) Analytics
9 73 (10.74%) Project Delivery
10 72 (10.59%) Decision-Making
11 69 (10.15%) Migration
12 68 (10.00%) Change Management
13 65 (9.56%) Information Security
14 64 (9.41%) Continuous Improvement
15 61 (8.97%) Computer Science
16 56 (8.24%) AI
17 50 (7.35%) Roadmaps
18 49 (7.21%) DevOps
19 48 (7.06%) Data Governance
20 46 (6.76%) Asset Management
Programming Languages
1 100 (14.71%) Python
2 89 (13.09%) SQL
3 64 (9.41%) Java
4 42 (6.18%) TypeScript
5 38 (5.59%) JavaScript
6 32 (4.71%) C#
7 26 (3.82%) C++
8 5 (0.74%) Haskell
8 5 (0.74%) PowerShell
8 5 (0.74%) VBA
9 4 (0.59%) R
10 3 (0.44%) OCaml
10 3 (0.44%) PL/SQL
10 3 (0.44%) Shell Script
11 2 (0.29%) Bash
11 2 (0.29%) Bicep
11 2 (0.29%) Korn
11 2 (0.29%) VB
12 1 (0.15%) Rust
12 1 (0.15%) Scala
Qualifications
1 113 (16.62%) Degree
2 67 (9.85%) Security Cleared
3 59 (8.68%) SC Cleared
4 53 (7.79%) CISSP
5 38 (5.59%) PMI Certification
5 38 (5.59%) PMP
6 32 (4.71%) Master's Degree
7 30 (4.41%) CISM
8 21 (3.09%) Computer Science Degree
9 18 (2.65%) CISA
10 17 (2.50%) DV Cleared
11 12 (1.76%) CRISC
12 8 (1.18%) PhD
13 7 (1.03%) CESG Certified Professional
13 7 (1.03%) Microsoft Certification
13 7 (1.03%) Numerate Degree
14 6 (0.88%) (ISC)2 CCSP
14 6 (0.88%) CBAP
14 6 (0.88%) Cisco Certification
14 6 (0.88%) FFIEC
Quality Assurance & Compliance
1 67 (9.85%) ISO/IEC 27001
2 63 (9.26%) NIST
3 51 (7.50%) GDPR
4 34 (5.00%) GRC
5 33 (4.85%) QA
6 24 (3.53%) PMO
6 24 (3.53%) Sarbanes-Oxley
7 23 (3.38%) Data Quality
8 18 (2.65%) EU AI Act
8 18 (2.65%) PCI DSS
9 12 (1.76%) MiFID
10 11 (1.62%) EMIR
10 11 (1.62%) SLA
11 9 (1.32%) Basel III
12 8 (1.18%) ISO/IEC 27005
12 8 (1.18%) NCSC
13 7 (1.03%) COBIT
13 7 (1.03%) Cyber Essentials
14 5 (0.74%) ISO 31000
14 5 (0.74%) NIST 800
System Software
1 20 (2.94%) Docker
2 13 (1.91%) Active Directory
3 4 (0.59%) Virtual Desktop
4 1 (0.15%) Postfix
4 1 (0.15%) VMware Infrastructure
Systems Management
1 12 (1.76%) Kubernetes
2 10 (1.47%) Terraform
3 5 (0.74%) Ansible
3 5 (0.74%) Grafana
3 5 (0.74%) Prometheus
4 3 (0.44%) ITRS Geneos
4 3 (0.44%) RSA Archer
4 3 (0.44%) Single Sign-On
5 2 (0.29%) Microsoft Intune
5 2 (0.29%) QRadar
6 1 (0.15%) Jamf Pro
6 1 (0.15%) Kubeflow
6 1 (0.15%) Rundeck
Vendors
1 58 (8.53%) Microsoft
2 30 (4.41%) ServiceNow
3 24 (3.53%) SAP
4 18 (2.65%) Salesforce
5 15 (2.21%) Oracle
6 10 (1.47%) Solace
7 9 (1.32%) Google
8 7 (1.03%) Murex
8 7 (1.03%) OpenLink
9 6 (0.88%) Cisco
9 6 (0.88%) Splunk
10 5 (0.74%) Bloomberg
10 5 (0.74%) Databricks
11 4 (0.59%) Atlassian
11 4 (0.59%) Citrix
11 4 (0.59%) ION Trading
12 3 (0.44%) Civica
12 3 (0.44%) Hitachi
12 3 (0.44%) Northgate
12 3 (0.44%) Qualys