Hybrid/Remote Electronics Job Trends

Electronics
UK > Work from Home

The table below looks at the prevalence of the term Electronics in remote or hybrid work. Included is a benchmarking guide to the salaries offered in vacancies that cited Electronics over the 6 months leading up to 27 October 2025, comparing them to the same period in the previous two years.

6 months to
27 Oct 2025
Same period 2024 Same period 2023
Rank 202 271 231
Rank change year-on-year +69 -40 +18
Permanent jobs citing Electronics 241 209 305
As % of all permanent jobs with remote/hybrid work options 1.50% 1.05% 1.35%
As % of the General category 2.13% 1.68% 2.04%
Number of salaries quoted 207 129 221
10th Percentile £45,608 £43,170 £35,000
25th Percentile £47,500 £45,000 £43,750
Median annual salary (50th Percentile) £55,000 £65,000 £57,500
Median % change year-on-year -15.38% +13.04% -
75th Percentile £67,500 £71,000 £66,250
90th Percentile £75,900 £80,000 £80,000
UK median annual salary £52,500 £55,000 £55,000
% change year-on-year -4.55% - -

All General Skills
Work from Home

Electronics falls under the General Skills category. For comparison with the information above, the following table provides summary statistics for all permanent job vacancies with remote or hybrid options requiring common skills.

Permanent vacancies with a requirement for common skills 11,290 12,451 14,987
As % of all permanent jobs with a WFH option 70.06% 62.32% 66.14%
Number of salaries quoted 6,175 7,123 11,773
10th Percentile £28,500 £35,000 £36,250
25th Percentile £38,750 £46,250 £46,306
Median annual salary (50th Percentile) £55,000 £62,500 £62,500
Median % change year-on-year -12.00% - +3.81%
75th Percentile £77,500 £85,000 £82,500
90th Percentile £100,000 £110,000 £100,000
UK median annual salary £51,625 £60,000 £60,000
% change year-on-year -13.96% - -

Electronics
Job Vacancy Trend for Remote/Hybrid Jobs

Historical trend showing the proportion of permanent IT job postings citing Electronics and offering remote or hybrid work options relative to all permanent IT jobs advertised.
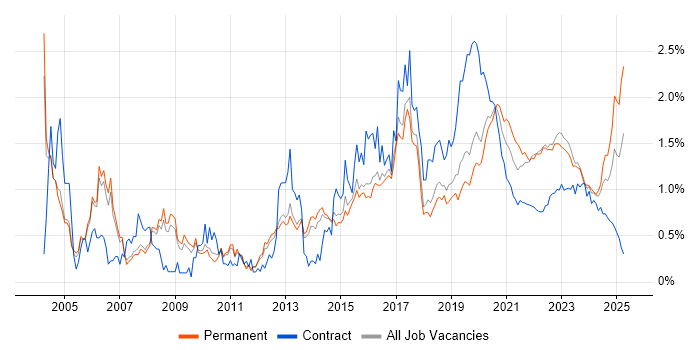
Electronics job vacancy trend for remote/hybrid jobs

Electronics
Salary Trend for Remote/Hybrid Jobs

Salary distribution trend for jobs with remote/hybrid work options citing Electronics.

Salary distribution trend for jobs with remote/hybrid work options citing Electronics

Electronics
Salary Histogram for Remote/Hybrid Jobs

Salary distribution for jobs with remote/hybrid work options citing Electronics over the 6 months to 27 October 2025.

Electronics salary histogram for jobs with remote/hybrid work options

Electronics
Co-Occurring Skills & Capabilities in Remote/Hybrid Jobs by Category

The following tables expand on the one above by listing co-occurrences grouped by category. They cover the same employment type, locality and period, with up to 20 co-occurrences shown in each category:

Application Platforms
1 2 (0.83%) Tomcat
1 2 (0.83%) WebLogic
1 2 (0.83%) WebLogic Portal
2 1 (0.41%) Apache
2 1 (0.41%) Microsoft Exchange
Applications
1 2 (0.83%) Microsoft Office
1 2 (0.83%) OrCAD
1 2 (0.83%) Simulink
2 1 (0.41%) AutoCAD
2 1 (0.41%) EPLAN
2 1 (0.41%) Microsoft Excel
2 1 (0.41%) Microsoft PowerPoint
Business Applications
1 2 (0.83%) Oracle EBS
1 2 (0.83%) Primavera
Cloud Services
1 9 (3.73%) Azure
2 5 (2.07%) AWS
2 5 (2.07%) Microsoft 365
3 3 (1.24%) Amazon Ads
3 3 (1.24%) Google Workspace
3 3 (1.24%) SaaS
4 2 (0.83%) Facebook Ads
4 2 (0.83%) GCP
4 2 (0.83%) Google Ads
4 2 (0.83%) OCI
4 2 (0.83%) Snowflake
5 1 (0.41%) AWS CloudFormation
5 1 (0.41%) Azure DevOps
5 1 (0.41%) Azure Monitor
5 1 (0.41%) Entra ID
5 1 (0.41%) Serverless
Communications & Networking
1 25 (10.37%) Network Security
2 19 (7.88%) RS-232
3 15 (6.22%) Wireless
4 13 (5.39%) Ethernet
5 11 (4.56%) Bluetooth
6 5 (2.07%) Wireshark
7 4 (1.66%) Wi-Fi
8 3 (1.24%) Firewall
9 2 (0.83%) TCP/IP
10 1 (0.41%) BGP
10 1 (0.41%) DHCP
10 1 (0.41%) DNS
10 1 (0.41%) HTTP
10 1 (0.41%) LAN
10 1 (0.41%) OSPF
10 1 (0.41%) RS-485
10 1 (0.41%) Software-Defined Networking
10 1 (0.41%) VLAN
10 1 (0.41%) VPN
10 1 (0.41%) WAN
Database & Business Intelligence
1 5 (2.07%) Big Data
2 3 (1.24%) Oracle Database
3 2 (0.83%) Data Warehouse
3 2 (0.83%) NoSQL
3 2 (0.83%) Oracle Discoverer
3 2 (0.83%) Oracle Reports
3 2 (0.83%) SQL Server
3 2 (0.83%) Tableau
4 1 (0.41%) Elasticsearch
4 1 (0.41%) Metadata
4 1 (0.41%) MongoDB
4 1 (0.41%) Relational Database
Development Applications
1 35 (14.52%) Rational DOORS
2 3 (1.24%) Oracle APEX
2 3 (1.24%) Xcode
3 2 (0.83%) Android Studio
3 2 (0.83%) Git
3 2 (0.83%) Oracle Forms
3 2 (0.83%) webpack
4 1 (0.41%) Fiddler
4 1 (0.41%) Gatling
4 1 (0.41%) GitLab
4 1 (0.41%) JMeter
4 1 (0.41%) JUnit
4 1 (0.41%) LoadRunner
4 1 (0.41%) Octopus Deploy
4 1 (0.41%) TeamCity
General
1 78 (32.37%) Manufacturing
2 64 (26.56%) Telecoms
3 62 (25.73%) Marketing
4 60 (24.90%) Finance
5 57 (23.65%) Public Sector
6 54 (22.41%) Social Skills
7 33 (13.69%) Analytical Skills
8 13 (5.39%) Automotive
9 12 (4.98%) Presentation Skills
10 6 (2.49%) Aerospace
11 5 (2.07%) Inclusion and Diversity
12 4 (1.66%) French Language
12 4 (1.66%) German Language
12 4 (1.66%) Italian Language
13 3 (1.24%) Advertising
13 3 (1.24%) Avionics
13 3 (1.24%) Banking
13 3 (1.24%) Games
13 3 (1.24%) Organisational Skills
13 3 (1.24%) Spanish Language
Job Titles
1 70 (29.05%) Systems Engineer
2 67 (27.80%) Electronics Engineer
3 39 (16.18%) Consultant
3 39 (16.18%) Security Consultant
4 35 (14.52%) Principal Engineer
5 34 (14.11%) Principal Systems Engineer
6 32 (13.28%) Embedded Engineer
7 26 (10.79%) Senior
8 25 (10.37%) Cybersecurity Consultant
9 19 (7.88%) Senior Electronics Engineer
10 17 (7.05%) Software Engineer
11 16 (6.64%) Embedded Software Engineer
12 13 (5.39%) Developer
12 13 (5.39%) Lead
13 10 (4.15%) Embedded Firmware Engineer
13 10 (4.15%) Firmware Engineer
14 9 (3.73%) FPGA Engineer
14 9 (3.73%) Senior FPGA Engineer
15 5 (2.07%) Sales Engineer
15 5 (2.07%) Trainer
Libraries, Frameworks & Software Standards
1 14 (5.81%) SAP CAF
2 9 (3.73%) Flash
3 3 (1.24%) iOS SDK
3 3 (1.24%) ModSecurity
3 3 (1.24%) React
3 3 (1.24%) SwiftUI
3 3 (1.24%) UIKit
4 2 (0.83%) .NET
4 2 (0.83%) Android SDK
4 2 (0.83%) Electron
4 2 (0.83%) Oracle ADF
4 2 (0.83%) WebCenter
5 1 (0.41%) ASP.NET
5 1 (0.41%) Entity Framework
5 1 (0.41%) Hibernate
5 1 (0.41%) OAuth
5 1 (0.41%) OpenID
5 1 (0.41%) REST
5 1 (0.41%) SAML
5 1 (0.41%) XML
Miscellaneous
1 41 (17.01%) Algorithms
2 29 (12.03%) Analytical Mindset
3 22 (9.13%) FPGA
4 14 (5.81%) Embedded Systems
5 10 (4.15%) VHDL
6 8 (3.32%) Analogue Electronics
7 5 (2.07%) IoT
8 4 (1.66%) Cloud Native
8 4 (1.66%) Cyber Defence
9 3 (1.24%) 3D Printing
9 3 (1.24%) Public Cloud
10 2 (0.83%) Onboarding
10 2 (0.83%) Renewable Energy
10 2 (0.83%) Self-Motivation
10 2 (0.83%) Smartphone
10 2 (0.83%) Verilog
10 2 (0.83%) Virtual Team
11 1 (0.41%) Life Science
11 1 (0.41%) PKI
11 1 (0.41%) Robotics
Operating Systems
1 8 (3.32%) Linux
2 7 (2.90%) Windows
3 4 (1.66%) Apple iOS
3 4 (1.66%) Windows Server
4 3 (1.24%) Android
4 3 (1.24%) Unix
5 2 (0.83%) Embedded Linux
6 1 (0.41%) Solaris
6 1 (0.41%) Windows 10
6 1 (0.41%) Windows Server 2016
Processes & Methodologies
1 60 (24.90%) Digital Marketing
2 59 (24.48%) Business Intelligence
3 58 (24.07%) Programme Management
4 51 (21.16%) Cybersecurity
5 42 (17.43%) Systems Engineering
5 42 (17.43%) Technical Leadership
6 39 (16.18%) Signal Processing
7 34 (14.11%) Test Planning
8 33 (13.69%) Mentoring
9 29 (12.03%) Software Engineering
10 26 (10.79%) Problem-Solving
10 26 (10.79%) Vulnerability Management
11 23 (9.54%) Collaborative Culture
12 17 (7.05%) Risk Management
13 14 (5.81%) Agile
13 14 (5.81%) ISMS
14 9 (3.73%) Analytics
14 9 (3.73%) FPGA Design
15 8 (3.32%) Embedded Software Development
15 8 (3.32%) Schematic Capture
Programming Languages
1 45 (18.67%) C
2 28 (11.62%) C++
3 23 (9.54%) Python
4 22 (9.13%) Embedded C
5 9 (3.73%) SQL
6 8 (3.32%) JavaScript
7 6 (2.49%) Embedded C++
8 5 (2.07%) Java
8 5 (2.07%) MATLAB
9 4 (1.66%) Tcl
9 4 (1.66%) TypeScript
10 3 (1.24%) C#
10 3 (1.24%) Google Apps Script
10 3 (1.24%) PL/SQL
10 3 (1.24%) PowerShell
10 3 (1.24%) Swift
11 2 (0.83%) Kotlin
11 2 (0.83%) Rust
12 1 (0.41%) Bash
12 1 (0.41%) Bicep
Qualifications
1 72 (29.88%) Security Cleared
2 41 (17.01%) CISSP
3 40 (16.60%) BPSS Clearance
4 37 (15.35%) Degree
5 33 (13.69%) SC Cleared
6 26 (10.79%) CompTIA Security+
7 25 (10.37%) CEH
8 24 (9.96%) DV Cleared
9 15 (6.22%) CISM
10 14 (5.81%) ISO 27001 Lead Implementer
11 5 (2.07%) City & Guilds
11 5 (2.07%) NVQ Level 3
12 3 (1.24%) Cisco Certification
13 2 (0.83%) Azure Certification
13 2 (0.83%) CCNP
13 2 (0.83%) Master's Degree
13 2 (0.83%) PhD
14 1 (0.41%) (ISC)2 CCSP
14 1 (0.41%) CCNA
14 1 (0.41%) Computer Science Degree
Quality Assurance & Compliance
1 40 (16.60%) ISO/IEC 27001
1 40 (16.60%) NIST
2 38 (15.77%) ISO/IEC 15288
3 25 (10.37%) PCI DSS
4 14 (5.81%) GRC
5 2 (0.83%) QA
6 1 (0.41%) Data Quality
6 1 (0.41%) IEC 61131
6 1 (0.41%) IEC 61508
6 1 (0.41%) ISO 14001
System Software
1 48 (19.92%) Firmware
2 22 (9.13%) Embedded Firmware
3 3 (1.24%) Active Directory
4 2 (0.83%) VMware Infrastructure
5 1 (0.41%) Docker
5 1 (0.41%) Hyper-V
5 1 (0.41%) Virtual Desktop
5 1 (0.41%) vSphere
Systems Management
1 2 (0.83%) Oracle Enterprise Manager
1 2 (0.83%) Terraform
2 1 (0.41%) Active Directory Federation Services
2 1 (0.41%) Ansible
2 1 (0.41%) Data Guard
2 1 (0.41%) FortiGate
2 1 (0.41%) Kibana
2 1 (0.41%) Kubernetes
2 1 (0.41%) Microsoft Intune
2 1 (0.41%) Oracle ZFS
2 1 (0.41%) Single Sign-On
2 1 (0.41%) ZABBIX
Vendors
1 57 (23.65%) SAP
2 34 (14.11%) IBM
3 27 (11.20%) EMC
4 6 (2.49%) Google
4 6 (2.49%) Microsoft
5 4 (1.66%) Oracle
6 3 (1.24%) VMware
7 2 (0.83%) Cadence
7 2 (0.83%) Cisco
7 2 (0.83%) Facebook
7 2 (0.83%) Fortinet
7 2 (0.83%) HP
7 2 (0.83%) IFS
8 1 (0.41%) Allen-Bradley
8 1 (0.41%) Freescale
8 1 (0.41%) Nexthink
8 1 (0.41%) Palantir
8 1 (0.41%) Rockwell
8 1 (0.41%) Samsung
8 1 (0.41%) Xamarin