Configuration Management Contracts with Work from Home Options

Configuration Management
UK > Work from Home

The table below provides summary statistics for contract job vacancies with an option to work from home (WFH) and a requirement for Configuration Management skills. Included is a benchmarking guide to the contractor rates offered in vacancies that have cited Configuration Management over the 6 months to 26 April 2024 with a comparison to the same period in the previous 2 years.

6 months to
26 Apr 2024
Same period 2023 Same period 2022
Rank 139 141 173
Rank change year-on-year +2 +32 -39
Contract jobs citing Configuration Management 242 455 722
As % of all contract jobs with a WFH option 1.57% 1.75% 1.62%
As % of the Processes & Methodologies category 1.79% 1.95% 1.78%
Number of daily rates quoted 178 332 529
10th Percentile £375 £400 £424
25th Percentile £500 £463 £475
Median daily rate (50th Percentile) £550 £540 £550
Median % change year-on-year +1.85% -1.82% +15.79%
75th Percentile £619 £653 £638
90th Percentile £691 £745 £700
UK median daily rate £550 £540 £550
% change year-on-year +1.85% -1.82% +14.23%
Number of hourly rates quoted 14 7 10
10th Percentile £11.00 £38.73 £23.93
25th Percentile £18.33 £39.55 £32.19
Median hourly rate £53.28 £41.80 £42.50
Median % change year-on-year +27.46% -1.65% -5.56%
75th Percentile £60.00 £53.13 £60.19
90th Percentile - £66.76 £65.38
UK median hourly rate £50.00 £50.42 £45.14
% change year-on-year -0.83% +11.70% +8.77%

All Process and Methodology Skills
Work from Home

Configuration Management is in the Processes and Methodologies category. The following table is for comparison with the above and provides summary statistics for all contract job vacancies with a WFH option and a requirement for process or methodology skills.

Contract vacancies with a requirement for process or methodology skills 13,515 23,376 40,505
As % of all contract jobs with a WFH option 87.88% 89.86% 91.08%
Number of daily rates quoted 9,014 16,510 29,383
10th Percentile £325 £363 £360
25th Percentile £425 £450 £431
Median daily rate (50th Percentile) £525 £540 £525
Median % change year-on-year -2.78% +2.86% +8.47%
75th Percentile £638 £650 £625
90th Percentile £750 £750 £713
UK median daily rate £525 £550 £525
% change year-on-year -4.55% +4.76% +8.25%
Number of hourly rates quoted 563 541 540
10th Percentile £15.03 £19.00 £13.50
25th Percentile £24.13 £30.75 £20.00
Median hourly rate £40.00 £55.00 £35.00
Median % change year-on-year -27.27% +57.14% +35.92%
75th Percentile £60.00 £68.75 £55.00
90th Percentile £75.25 £80.25 £66.78
UK median hourly rate £35.00 £37.00 £25.00
% change year-on-year -5.41% +48.00% -

Configuration Management
Trend for Jobs with a WFH Option

Job vacancies with a work from home option citing Configuration Management as a proportion of all IT jobs advertised.
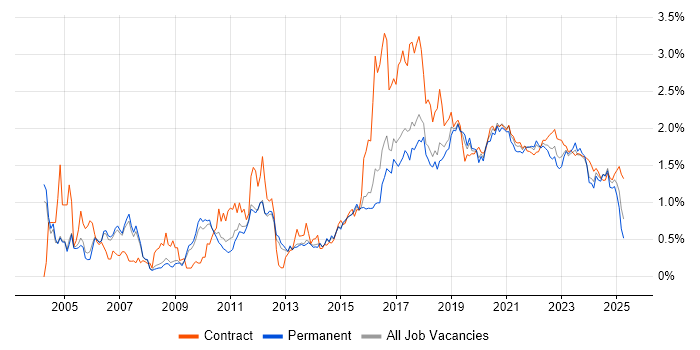
Configuration Management trend for jobs with a WFH option

Configuration Management
Daily Rate Trend for Jobs with a WFH Option

3-month moving average daily rate quoted in job vacancies with a work from home option citing Configuration Management.

Configuration Management daily rate for jobs with a WFH option

Configuration Management
Daily Rate Histogram for Jobs with a WFH Option

Daily rate distribution for jobs with a work from home option citing Configuration Management over the 6 months to 26 April 2024.

Configuration Management daily rate histogram for jobs with a WFH option

Configuration Management
Hourly Rate Trend for Jobs with a WFH Option

3-month moving average hourly rate quoted in job vacancies with a work from home option citing Configuration Management.

Configuration Management hourly rate for jobs with a WFH option

Configuration Management
Hourly Rate Histogram for Jobs with a WFH Option

Hourly rate distribution for jobs with a work from home option citing Configuration Management over the 6 months to 26 April 2024.

Configuration Management hourly rate histogram for jobs with a WFH option

Configuration Management
Co-occurring Skills and Capabilities with WFH Options by Category

The follow tables expand on the table above by listing co-occurrences grouped by category. The same employment type, locality and period is covered with up to 20 co-occurrences shown in each of the following categories:

Application Platforms
1 11 (4.55%) Confluence
2 8 (3.31%) nginx
3 4 (1.65%) Apache
3 4 (1.65%) Apache Solr
3 4 (1.65%) SharePoint
4 2 (0.83%) CMS
4 2 (0.83%) OpenStack
5 1 (0.41%) Anypoint
5 1 (0.41%) Apache Spark
5 1 (0.41%) CICS
5 1 (0.41%) IIS
5 1 (0.41%) SAS
Applications
1 9 (3.72%) Chatbot
2 5 (2.07%) Microsoft Excel
2 5 (2.07%) Microsoft PowerPoint
3 2 (0.83%) Microsoft Office
3 2 (0.83%) Microsoft Project
4 1 (0.41%) Spreadsheet
4 1 (0.41%) Windchill
Business Applications
1 9 (3.72%) Remedy ITSM
Cloud Services
1 64 (26.45%) AWS
2 32 (13.22%) Azure
3 23 (9.50%) GCP
4 12 (4.96%) Serverless
5 11 (4.55%) GitHub
6 9 (3.72%) Amazon EKS
6 9 (3.72%) AWS Lambda
6 9 (3.72%) IaaS
7 8 (3.31%) Amazon EC2
8 7 (2.89%) Apigee
8 7 (2.89%) Virtual Private Cloud
9 6 (2.48%) AWS CloudFormation
9 6 (2.48%) Slack
10 5 (2.07%) Power Platform
11 4 (1.65%) Amazon CloudWatch
11 4 (1.65%) Amazon S3
11 4 (1.65%) Datadog
11 4 (1.65%) OpenShift
11 4 (1.65%) Route 53
12 3 (1.24%) PaaS
Communications & Networking
1 21 (8.68%) TCP/IP
2 16 (6.61%) Firewall
3 15 (6.20%) SAN
4 12 (4.96%) DNS
5 5 (2.07%) DHCP
6 4 (1.65%) HTTPS
6 4 (1.65%) Internet
6 4 (1.65%) Intrusion Detection
6 4 (1.65%) IPsec
6 4 (1.65%) Network Security
7 3 (1.24%) HTTP
7 3 (1.24%) SSL
7 3 (1.24%) WAN
8 2 (0.83%) BGP
8 2 (0.83%) VPN
8 2 (0.83%) Wireless
9 1 (0.41%) IPv4
9 1 (0.41%) IPv6
9 1 (0.41%) MPLS
9 1 (0.41%) tcpdump
Database & Business Intelligence
1 12 (4.96%) NoSQL
1 12 (4.96%) SQL Server
2 9 (3.72%) MySQL
3 6 (2.48%) Amazon RDS
3 6 (2.48%) Amazon Redshift
3 6 (2.48%) Couchbase
4 5 (2.07%) Power BI
5 4 (1.65%) Elasticsearch
5 4 (1.65%) PostgreSQL
5 4 (1.65%) Relational Database
6 3 (1.24%) Big Data
6 3 (1.24%) DB2
7 2 (0.83%) Apache Cassandra
7 2 (0.83%) BigQuery
7 2 (0.83%) Data Lake
7 2 (0.83%) MariaDB
7 2 (0.83%) Sybase ASE
8 1 (0.41%) IDMS
8 1 (0.41%) MongoDB
8 1 (0.41%) Oracle Reports
Development Applications
1 47 (19.42%) Jenkins
2 27 (11.16%) JIRA
3 19 (7.85%) GitLab
4 14 (5.79%) Git
5 13 (5.37%) Visual Studio
6 11 (4.55%) SonarQube
7 9 (3.72%) Selenium
8 8 (3.31%) Artifactory
8 8 (3.31%) Bitbucket
8 8 (3.31%) Cucumber
8 8 (3.31%) PVCS
8 8 (3.31%) REST Assured
9 5 (2.07%) LoadRunner
9 5 (2.07%) Maven
9 5 (2.07%) MSI
9 5 (2.07%) WiX
10 4 (1.65%) Atlassian Bamboo
10 4 (1.65%) Sonatype Nexus
10 4 (1.65%) Subversion
10 4 (1.65%) TeamCity
General
1 71 (29.34%) Social Skills
2 38 (15.70%) Public Sector
3 26 (10.74%) Finance
4 20 (8.26%) Analytical Skills
5 13 (5.37%) Telecoms
6 10 (4.13%) Law
7 9 (3.72%) Banking
8 8 (3.31%) Electronics
9 7 (2.89%) Aerospace
9 7 (2.89%) Police
10 6 (2.48%) Pharmaceutical
11 5 (2.07%) Legal
11 5 (2.07%) Marketing
11 5 (2.07%) Organisational Skills
12 3 (1.24%) Documentation Skills
12 3 (1.24%) Inclusion and Diversity
12 3 (1.24%) Investment Banking
13 2 (0.83%) Advertising
13 2 (0.83%) Influencing Skills
13 2 (0.83%) Manufacturing
Job Titles
1 31 (12.81%) Developer
1 31 (12.81%) DevOps Engineer
2 28 (11.57%) Senior
3 18 (7.44%) Lead
4 15 (6.20%) Consultant
4 15 (6.20%) Python Developer
5 13 (5.37%) Configuration Manager
6 11 (4.55%) Project Manager
7 10 (4.13%) Software Engineer
8 9 (3.72%) Architect
9 8 (3.31%) C Programmer
9 8 (3.31%) Infrastructure Engineer
9 8 (3.31%) Programmer
9 8 (3.31%) Senior Software Engineer
10 7 (2.89%) Asset and Configuration Manager
10 7 (2.89%) AWS Engineer
10 7 (2.89%) Genesys Consultant
10 7 (2.89%) Platform Engineer
11 6 (2.48%) Senior DevOps
11 6 (2.48%) Vulnerability Specialist
Libraries, Frameworks & Software Standards
1 22 (9.09%) REST
2 17 (7.02%) .NET
3 14 (5.79%) JSON
4 13 (5.37%) RESTful
5 11 (4.55%) XML
6 9 (3.72%) Elastic Stack
6 9 (3.72%) YAML
7 8 (3.31%) ARM Templates
7 8 (3.31%) Java EE
7 8 (3.31%) Node.js
7 8 (3.31%) RabbitMQ
8 7 (2.89%) SOAP
9 6 (2.48%) Middleware
10 5 (2.07%) ASP.NET
10 5 (2.07%) ASP.NET Web API
10 5 (2.07%) Entity Framework
10 5 (2.07%) LINQ
10 5 (2.07%) NHibernate
10 5 (2.07%) OAuth
10 5 (2.07%) XSLT
Miscellaneous
1 35 (14.46%) CMDB
2 29 (11.98%) Management Information System
3 10 (4.13%) Public Cloud
4 9 (3.72%) Data Centre
5 8 (3.31%) IVR
6 7 (2.89%) Private Cloud
7 6 (2.48%) Cloud Native
7 6 (2.48%) Virtual Team
8 5 (2.07%) Client/Server
8 5 (2.07%) Web 2.0
9 4 (1.65%) Greenfield Project
10 3 (1.24%) Foreign Exchange (FX)
10 3 (1.24%) Linux Command Line
10 3 (1.24%) Onboarding
11 2 (0.83%) Distributed Systems
11 2 (0.83%) Enterprise Software
11 2 (0.83%) Hybrid Cloud
11 2 (0.83%) Mobile App
11 2 (0.83%) Security Posture
12 1 (0.41%) Product Ownership
Operating Systems
1 48 (19.83%) Linux
2 28 (11.57%) Windows
3 20 (8.26%) Unix
4 18 (7.44%) Ubuntu
5 15 (6.20%) Debian
6 10 (4.13%) Windows Server
7 7 (2.89%) CentOS
8 4 (1.65%) Red Hat Enterprise Linux
8 4 (1.65%) VMS
8 4 (1.65%) Windows Server 2016
9 3 (1.24%) Windows 10
9 3 (1.24%) Windows 7
9 3 (1.24%) Windows Server 2012
9 3 (1.24%) Windows Server 2019
10 2 (0.83%) Android
10 2 (0.83%) Apple iOS
11 1 (0.41%) zOS
Processes & Methodologies
1 57 (23.55%) DevOps
2 56 (23.14%) Problem-Solving
3 55 (22.73%) ITIL
4 49 (20.25%) CI/CD
5 44 (18.18%) Agile
6 43 (17.77%) Service Management
7 40 (16.53%) Infrastructure as Code
8 33 (13.64%) ITSM
9 30 (12.40%) Software Engineering
10 29 (11.98%) Continuous Integration
11 26 (10.74%) Service Asset and Configuration Management
12 25 (10.33%) Analytics
13 23 (9.50%) Asset Management
13 23 (9.50%) Customer Service
14 20 (8.26%) Computer Science
14 20 (8.26%) SDLC
15 19 (7.85%) Business Analysis
15 19 (7.85%) Stakeholder Management
15 19 (7.85%) Strategic Thinking
16 17 (7.02%) Change Management
Programming Languages
1 61 (25.21%) Python
2 24 (9.92%) PowerShell
3 23 (9.50%) SQL
4 22 (9.09%) Java
5 17 (7.02%) Bash
6 13 (5.37%) C#
6 13 (5.37%) Go
7 11 (4.55%) C
7 11 (4.55%) JavaScript
8 9 (3.72%) Ruby
9 8 (3.31%) Perl
9 8 (3.31%) PL/SQL
10 7 (2.89%) C++
11 5 (2.07%) T-SQL
12 4 (1.65%) PHP
13 3 (1.24%) COBOL
13 3 (1.24%) REXX
13 3 (1.24%) SELCOPY
14 2 (0.83%) Bicep
14 2 (0.83%) Shell Script
Qualifications
1 105 (43.39%) Security Cleared
2 91 (37.60%) SC Cleared
3 30 (12.40%) Degree
4 19 (7.85%) DV Cleared
5 11 (4.55%) ITIL Certification
6 10 (4.13%) Computer Science Degree
7 9 (3.72%) BPSS Clearance
8 2 (0.83%) AWS Certification
8 2 (0.83%) CISSP
9 1 (0.41%) A+ Certification
9 1 (0.41%) AWS Certified DevOps Engineer
9 1 (0.41%) AWS Certified Solutions Architect
9 1 (0.41%) CEH
9 1 (0.41%) CISA
9 1 (0.41%) CISM
9 1 (0.41%) ITIL Foundation Certificate
9 1 (0.41%) MCSE
9 1 (0.41%) Microsoft Certification
9 1 (0.41%) Network+ Certification
Quality Assurance & Compliance
1 10 (4.13%) QA
2 8 (3.31%) GDPR
2 8 (3.31%) NIST
3 7 (2.89%) Data Quality
3 7 (2.89%) ISO/IEC 27001
4 4 (1.65%) HIPAA
4 4 (1.65%) SLA
5 3 (1.24%) GPG13
5 3 (1.24%) NCSC
6 2 (0.83%) PMO
7 1 (0.41%) Cyber Essentials
7 1 (0.41%) JSP 440
7 1 (0.41%) PCI DSS
7 1 (0.41%) RMADS
System Software
1 29 (11.98%) Docker
2 13 (5.37%) Active Directory
3 10 (4.13%) VMware Infrastructure
4 6 (2.48%) XenApp
4 6 (2.48%) XenDesktop
5 4 (1.65%) VMware NSX
5 4 (1.65%) vSphere
6 3 (1.24%) vCloud
6 3 (1.24%) Virtual Machines
7 2 (0.83%) Time Sharing Option
8 1 (0.41%) Postfix
Systems Management
1 69 (28.51%) Ansible
2 54 (22.31%) Terraform
3 40 (16.53%) Kubernetes
4 29 (11.98%) Puppet
5 23 (9.50%) Progress Chef
6 10 (4.13%) Grafana
7 9 (3.72%) Docker Swarm
7 9 (3.72%) Prometheus
7 9 (3.72%) SCCM
8 8 (3.31%) Podman
9 5 (2.07%) Consul
10 4 (1.65%) BladeLogic
10 4 (1.65%) ITRS Geneos
10 4 (1.65%) Packer
10 4 (1.65%) Salt
11 3 (1.24%) Autotask
11 3 (1.24%) Microsoft Intune
11 3 (1.24%) Nagios
11 3 (1.24%) PowerCLI
12 2 (0.83%) ZABBIX
Vendors
1 34 (14.05%) Microsoft
2 28 (11.57%) VMware
3 19 (7.85%) Red Hat
4 16 (6.61%) ServiceNow
5 13 (5.37%) Oracle
6 12 (4.96%) Google
7 11 (4.55%) Citrix
8 10 (4.13%) Genesys
9 9 (3.72%) Remedy
10 8 (3.31%) SAP
11 6 (2.48%) Avaya
11 6 (2.48%) HP
11 6 (2.48%) Qualys
12 5 (2.07%) Atlassian
12 5 (2.07%) BMC
12 5 (2.07%) Splunk
13 4 (1.65%) Altiris
13 4 (1.65%) Dynatrace
13 4 (1.65%) Salesforce
14 3 (1.24%) New Relic