Remedy Contracts with Work from Home Options

Remedy
UK > Work from Home

The table below provides summary statistics for contract job vacancies with an option to work from home (WFH) and a requirement for knowledge and experience of Remedy products and/or services. Included is a benchmarking guide to the contractor rates offered in vacancies that have cited Remedy over the 6 months to 13 May 2024 with a comparison to the same period in the previous 2 years.

The figures below represent the IT contractor job market in general and are not representative of contractor rates within BMC Remedy.

6 months to
13 May 2024
Same period 2023 Same period 2022
Rank 315 416 501
Rank change year-on-year +101 +85 -118
Contract jobs citing Remedy 34 50 119
As % of all contract jobs with a WFH option 0.23% 0.20% 0.27%
As % of the Vendors category 0.54% 0.46% 0.69%
Number of daily rates quoted 21 37 82
10th Percentile - £261 £178
25th Percentile £425 £400 £417
Median daily rate (50th Percentile) £450 £450 £500
Median % change year-on-year - -10.00% -
75th Percentile £538 £508 £604
90th Percentile £575 £560 £738
UK median daily rate £450 £500 £450
% change year-on-year -10.00% +11.11% -9.18%
Number of hourly rates quoted 4 0 2
10th Percentile £15.83 - £13.04
25th Percentile £20.84 - £18.37
Median hourly rate £24.51 - £27.25
75th Percentile £26.92 - £36.12
90th Percentile - - £41.45
UK median hourly rate £20.00 £20.50 £16.83
% change year-on-year -2.44% +21.84% +67.66%

All Vendors
Work from Home

Remedy is in the Vendor Products and Services category. The following table is for comparison with the above and provides summary statistics for all contract job vacancies with a WFH option and a requirement for knowledge or experience of vendor products and services.

Contract vacancies with a requirement for knowledge or experience of vendor products and services 6,355 10,874 17,361
As % of all contract jobs with a WFH option 42.55% 43.17% 39.19%
Number of daily rates quoted 3,971 7,318 11,820
10th Percentile £325 £325 £345
25th Percentile £425 £425 £425
Median daily rate (50th Percentile) £525 £525 £525
Median % change year-on-year - - +10.53%
75th Percentile £625 £650 £625
90th Percentile £728 £745 £714
UK median daily rate £515 £525 £525
% change year-on-year -1.90% - +10.53%
Number of hourly rates quoted 213 255 259
10th Percentile £13.44 £17.50 £14.47
25th Percentile £16.70 £27.88 £19.81
Median hourly rate £32.12 £53.35 £40.00
Median % change year-on-year -39.80% +33.38% +41.47%
75th Percentile £57.50 £67.50 £56.81
90th Percentile £70.00 £80.25 £72.50
UK median hourly rate £22.00 £42.50 £21.50
% change year-on-year -48.24% +97.67% -4.10%

Remedy
Trend for Jobs with a WFH Option

Job vacancies with a work from home option citing Remedy as a proportion of all IT jobs advertised.
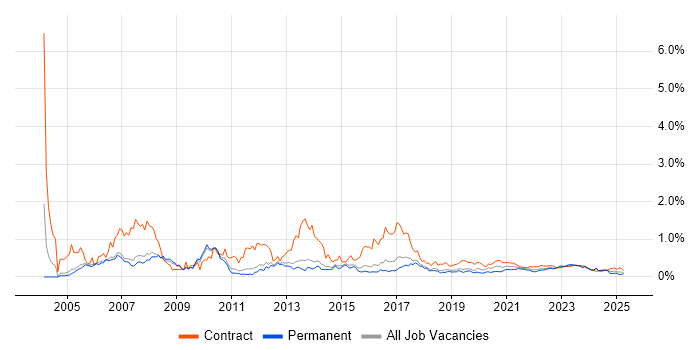
Remedy trend for jobs with a WFH option

Remedy
Daily Rate Trend for Jobs with a WFH Option

3-month moving average daily rate quoted in job vacancies with a work from home option citing Remedy.

Remedy daily rate for jobs with a WFH option

Remedy
Daily Rate Histogram for Jobs with a WFH Option

Daily rate distribution for jobs with a work from home option citing Remedy over the 6 months to 13 May 2024.

Remedy daily rate histogram for jobs with a WFH option

Remedy
Hourly Rate Trend for Jobs with a WFH Option

3-month moving average hourly rate quoted in job vacancies with a work from home option citing Remedy.

Remedy hourly rate for jobs with a WFH option

Remedy
Hourly Rate Histogram for Jobs with a WFH Option

Hourly rate distribution for jobs with a work from home option citing Remedy over the 6 months to 13 May 2024.

Remedy hourly rate histogram for jobs with a WFH option

Remedy
Co-occurring Skills and Capabilities with WFH Options by Category

The follow tables expand on the table above by listing co-occurrences grouped by category. The same employment type, locality and period is covered with up to 20 co-occurrences shown in each of the following categories:

Application Platforms
1 1 (2.94%) Confluence
1 1 (2.94%) Exchange Server 2007
1 1 (2.94%) Exchange Server 2013
1 1 (2.94%) Microsoft Exchange
1 1 (2.94%) SAS
Applications
1 2 (5.88%) Microsoft Excel
2 1 (2.94%) Microsoft Office
2 1 (2.94%) Spreadsheet
Business Applications
1 20 (58.82%) Remedy ITSM
2 1 (2.94%) SAP EWM
Cloud Services
1 13 (38.24%) Power Platform
2 1 (2.94%) Azure
2 1 (2.94%) Azure API Management
2 1 (2.94%) Azure Data Factory
2 1 (2.94%) Azure DevOps
2 1 (2.94%) Azure Key Vault
2 1 (2.94%) Azure Logic Apps
2 1 (2.94%) Azure Monitor
2 1 (2.94%) Azure Sentinel
2 1 (2.94%) Azure Service Bus
2 1 (2.94%) Cloud Computing
2 1 (2.94%) Entra ID
2 1 (2.94%) IaaS
2 1 (2.94%) PaaS
2 1 (2.94%) SaaS
Communications & Networking
1 2 (5.88%) Firewall
1 2 (5.88%) Radio Access Network
1 2 (5.88%) Remote Desktop
1 2 (5.88%) SAN
1 2 (5.88%) TCP/IP
1 2 (5.88%) XCAP
2 1 (2.94%) Cisco IOS
2 1 (2.94%) DNS
2 1 (2.94%) FTP
2 1 (2.94%) NaaS
2 1 (2.94%) SD-WAN
2 1 (2.94%) WAN
Database & Business Intelligence
1 13 (38.24%) Power BI
2 2 (5.88%) GIS
2 2 (5.88%) Tableau
3 1 (2.94%) Data Warehouse
3 1 (2.94%) Pentaho
Development Applications
1 5 (14.71%) Git
2 4 (11.76%) JIRA
3 3 (8.82%) GitLab
3 3 (8.82%) Jenkins
General
1 19 (55.88%) Social Skills
2 6 (17.65%) Public Sector
3 4 (11.76%) Analytical Skills
4 3 (8.82%) Finance
5 2 (5.88%) Legal
6 1 (2.94%) Banking
6 1 (2.94%) Inclusion and Diversity
6 1 (2.94%) Local Government
6 1 (2.94%) Publishing
6 1 (2.94%) Telecoms
Job Titles
1 10 (29.41%) Service Manager
2 5 (14.71%) Availability Manager
3 4 (11.76%) IT Manager
4 3 (8.82%) Service Level Manager
5 2 (5.88%) Architect
5 2 (5.88%) Capacity Manager
5 2 (5.88%) Developer
5 2 (5.88%) DevOps Engineer
5 2 (5.88%) IT Project Manager
5 2 (5.88%) IT Services Manager
5 2 (5.88%) Optimisation Engineer
5 2 (5.88%) Performance Engineer
5 2 (5.88%) Project Manager
5 2 (5.88%) Python Developer
5 2 (5.88%) RAN Engineer
5 2 (5.88%) RAN Performance Engineer
5 2 (5.88%) Service Continuity Manager
6 1 (2.94%) Audio Visual Engineer
6 1 (2.94%) HR Executive
6 1 (2.94%) Platform Engineer
Libraries, Frameworks & Software Standards
1 4 (11.76%) XML
1 4 (11.76%) YAML
2 3 (8.82%) JSON
2 3 (8.82%) Node.js
2 3 (8.82%) REST
2 3 (8.82%) RESTful
2 3 (8.82%) SOAP
3 1 (2.94%) ARM Templates
Miscellaneous
1 7 (20.59%) CMDB
1 7 (20.59%) Management Information System
2 1 (2.94%) Blackberry
2 1 (2.94%) Cloud Native
2 1 (2.94%) Digital Signage
2 1 (2.94%) PKI
2 1 (2.94%) Video Conferencing
2 1 (2.94%) Virtual Team
Operating Systems
1 3 (8.82%) Linux
2 2 (5.88%) Debian
2 2 (5.88%) Ubuntu
3 1 (2.94%) CentOS
3 1 (2.94%) Mac OS X
3 1 (2.94%) Windows
3 1 (2.94%) Windows 7
Processes & Methodologies
1 18 (52.94%) ITSM
2 17 (50.00%) ITIL
3 16 (47.06%) Agile
4 15 (44.12%) Service Management
5 12 (35.29%) Business Intelligence
6 9 (26.47%) Configuration Management
7 6 (17.65%) Disaster Recovery
8 5 (14.71%) Availability Management
8 5 (14.71%) BCP
8 5 (14.71%) Business Continuity
8 5 (14.71%) Capacity Management
8 5 (14.71%) Capacity Planning
8 5 (14.71%) Performance Monitoring
8 5 (14.71%) Service Asset and Configuration Management
9 4 (11.76%) Business Continuity Planning
9 4 (11.76%) Infrastructure as Code
10 3 (8.82%) Continuous Deployment
10 3 (8.82%) Continuous Integration
10 3 (8.82%) Data Modelling
10 3 (8.82%) Infrastructure Automation
Programming Languages
1 5 (14.71%) Python
2 3 (8.82%) Go
2 3 (8.82%) Ruby
3 1 (2.94%) Bicep
3 1 (2.94%) PowerShell
Qualifications
1 15 (44.12%) Security Cleared
2 13 (38.24%) SC Cleared
3 8 (23.53%) BPSS Clearance
4 2 (5.88%) DBS Check
5 1 (2.94%) Degree
5 1 (2.94%) ITIL Certification
Quality Assurance & Compliance
1 3 (8.82%) Accessibility
2 2 (5.88%) SLA
3 1 (2.94%) COBIT
3 1 (2.94%) ISO/IEC 27001
3 1 (2.94%) ISO/IEC 27002 (supersedes ISO/IEC 17799)
System Software
1 3 (8.82%) vCloud
1 3 (8.82%) VMware NSX
1 3 (8.82%) vSphere
2 1 (2.94%) Active Directory
Systems Management
1 4 (11.76%) Ansible
1 4 (11.76%) Progress Chef
1 4 (11.76%) Puppet
1 4 (11.76%) Terraform
2 3 (8.82%) Autotask
3 1 (2.94%) AirWatch
3 1 (2.94%) Kubernetes
Vendors
1 6 (17.65%) BMC
2 5 (14.71%) VMware
3 4 (11.76%) ServiceNow
4 3 (8.82%) Arista
4 3 (8.82%) SAP
4 3 (8.82%) TOWER Software
5 2 (5.88%) Microsoft
5 2 (5.88%) Red Hat
6 1 (2.94%) Apple
6 1 (2.94%) Cisco
6 1 (2.94%) Databricks
6 1 (2.94%) HP
6 1 (2.94%) SaltStack