Service Delivery Contracts with Hybrid/Remote/WFH Options

Service Delivery
UK > Work from Home

The table below provides summary statistics for remote or hybrid contract work requiring Service Delivery skills. It includes a benchmarking guide to the contractor rates offered in vacancies that cited Service Delivery over the 6 months leading up to 30 April 2025, comparing them to the same period in the previous two years.

6 months to
30 Apr 2025
Same period 2024 Same period 2023
Rank 157 151 139
Rank change year-on-year -6 -12 +9
Contract jobs citing Service Delivery 155 229 458
As % of all contract jobs with a WFH option 1.56% 1.49% 1.77%
As % of the Processes & Methodologies category 1.72% 1.70% 1.97%
Number of daily rates quoted 103 160 357
10th Percentile £268 £282 £326
25th Percentile £375 £394 £425
Median daily rate (50th Percentile) £450 £519 £540
Median % change year-on-year -13.25% -3.94% +2.86%
75th Percentile £575 £586 £601
90th Percentile £670 £638 £688
UK median daily rate £450 £500 £525
% change year-on-year -10.00% -4.76% +2.94%
Number of hourly rates quoted 8 13 11
10th Percentile £17.53 £13.40 £12.50
25th Percentile £20.38 £14.00 £19.00
Median hourly rate £27.50 £15.85 £33.50
Median % change year-on-year +73.50% -52.69% +28.85%
75th Percentile £42.81 £24.75 £67.50
90th Percentile £70.00 £63.72 £68.75
UK median hourly rate £16.23 £14.80 £25.00
% change year-on-year +9.66% -40.80% +72.41%

All Process and Methodology Skills
Work from Home

Service Delivery falls under the Processes and Methodologies category. For comparison with the information above, the following table provides summary statistics for all contract job vacancies with remote or hybrid options requiring process or methodology skills.

Contract vacancies with a requirement for process or methodology skills 9,023 13,505 23,232
As % of all contract jobs with a WFH option 91.03% 87.83% 89.84%
Number of daily rates quoted 6,195 9,015 16,421
10th Percentile £340 £325 £363
25th Percentile £419 £425 £450
Median daily rate (50th Percentile) £525 £525 £540
Median % change year-on-year - -2.78% +2.86%
75th Percentile £638 £638 £650
90th Percentile £763 £750 £750
UK median daily rate £521 £525 £550
% change year-on-year -0.86% -4.55% +4.76%
Number of hourly rates quoted 225 573 532
10th Percentile £14.20 £15.17 £19.00
25th Percentile £19.75 £24.25 £30.54
Median hourly rate £40.00 £42.50 £55.00
Median % change year-on-year -5.88% -22.73% +57.14%
75th Percentile £67.50 £60.00 £68.75
90th Percentile £75.00 £75.25 £80.23
UK median hourly rate £29.00 £35.50 £37.30
% change year-on-year -18.31% -4.83% +49.20%

Service Delivery
Trend for Jobs with a WFH Option

Job vacancies with remote working options citing Service Delivery as a proportion of all IT jobs advertised.
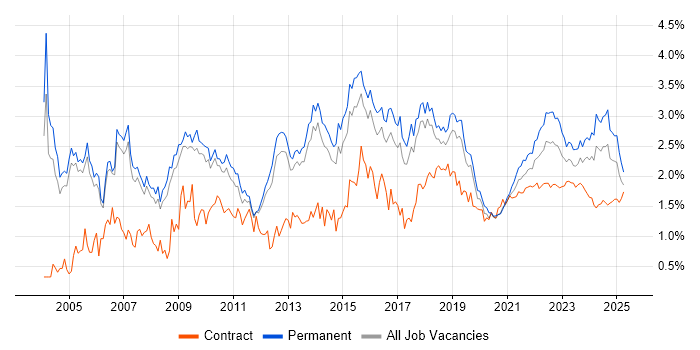
Service Delivery trend for jobs with Hybrid/Remote/WFH options

Service Delivery
Daily Rate Trend for Jobs with a WFH Option

3-month moving average daily rate quoted in job vacancies with remote working options citing Service Delivery.

Service Delivery daily rate for jobs with a WFH option

Service Delivery
Daily Rate Histogram for Jobs with a WFH Option

Daily rate distribution for jobs with remote working options citing Service Delivery over the 6 months to 30 April 2025.

Service Delivery daily rate histogram for jobs with a WFH option

Service Delivery
Hourly Rate Trend for Jobs with a WFH Option

3-month moving average hourly rate quoted in job vacancies with remote working options citing Service Delivery.

Service Delivery hourly rate for jobs with a WFH option

Service Delivery
Hourly Rate Histogram for Jobs with a WFH Option

Hourly rate distribution for jobs with remote working options citing Service Delivery over the 6 months to 30 April 2025.

Service Delivery hourly rate histogram for jobs with a WFH option

Service Delivery
Co-occurring Skills and Capabilities with WFH Options by Category

The follow tables expand on the table above by listing co-occurrences grouped by category. The same employment type, locality and period is covered with up to 20 co-occurrences shown in each of the following categories:

Application Platforms
1 5 (3.23%) Microsoft Exchange
2 4 (2.58%) SharePoint
3 3 (1.94%) Confluence
4 1 (0.65%) CICS
4 1 (0.65%) IIS
Applications
1 6 (3.87%) Microsoft Office
2 3 (1.94%) Microsoft Excel
3 1 (0.65%) Adobe XD
3 1 (0.65%) Sketch
3 1 (0.65%) Spreadsheet
3 1 (0.65%) Trello
Business Applications
1 6 (3.87%) iTrent
2 3 (1.94%) Remedy ITSM
3 2 (1.29%) Dynamics CRM
3 2 (1.29%) SAP S/4HANA
4 1 (0.65%) Kondor
4 1 (0.65%) SAP Oil and Gas
Cloud Services
1 15 (9.68%) Azure
2 14 (9.03%) AWS
3 11 (7.10%) Microsoft 365
4 9 (5.81%) SaaS
5 8 (5.16%) Entra ID
6 6 (3.87%) Amazon CloudWatch
6 6 (3.87%) Power Platform
7 4 (2.58%) Amazon Glacier
7 4 (2.58%) Amazon Kinesis
7 4 (2.58%) Amazon S3
7 4 (2.58%) AWS Lambda
7 4 (2.58%) Serverless
8 3 (1.94%) Dynamics 365
9 2 (1.29%) Amazon ECS
9 2 (1.29%) AWS Fargate
9 2 (1.29%) GCP
9 2 (1.29%) IaaS
9 2 (1.29%) Miro
9 2 (1.29%) OCI
9 2 (1.29%) Yammer
Communications & Networking
1 9 (5.81%) Firewall
2 8 (5.16%) DNS
3 7 (4.52%) WAN
4 6 (3.87%) BGP
4 6 (3.87%) Internet
5 5 (3.23%) VPN
6 4 (2.58%) LAN
6 4 (2.58%) MPLS
6 4 (2.58%) OSPF
7 3 (1.94%) EIGRP
7 3 (1.94%) iSCSI
7 3 (1.94%) Network Security
7 3 (1.94%) Remote Desktop
7 3 (1.94%) TCP/IP
7 3 (1.94%) Wi-Fi
7 3 (1.94%) Wireless
8 2 (1.29%) Cisco IOS
8 2 (1.29%) NetScaler
8 2 (1.29%) SNMP
8 2 (1.29%) Unified Communications
Database & Business Intelligence
1 5 (3.23%) SQL Server
2 4 (2.58%) DynamoDB
2 4 (2.58%) Power BI
3 3 (1.94%) Data Lake
3 3 (1.94%) Data Mining
4 2 (1.29%) MongoDB
5 1 (0.65%) Data Warehouse
5 1 (0.65%) Easytrieve
5 1 (0.65%) Enterprise Data Warehouse
Development Applications
1 9 (5.81%) JIRA
2 8 (5.16%) Jenkins
3 3 (1.94%) GitLab
4 1 (0.65%) GCC
4 1 (0.65%) Git
4 1 (0.65%) Maven
4 1 (0.65%) Selenium
4 1 (0.65%) SpecFlow
4 1 (0.65%) Subversion
General
1 48 (30.97%) Social Skills
2 30 (19.35%) Public Sector
3 29 (18.71%) Finance
4 19 (12.26%) Telecoms
5 12 (7.74%) Analytical Skills
6 10 (6.45%) Banking
7 7 (4.52%) Billing
8 6 (3.87%) Local Government
9 5 (3.23%) Legal
9 5 (3.23%) Presentation Skills
10 4 (2.58%) Investment Banking
10 4 (2.58%) Manufacturing
10 4 (2.58%) Organisational Skills
11 3 (1.94%) Back Office
11 3 (1.94%) Retail
12 2 (1.29%) Influencing Skills
12 2 (1.29%) Welsh Language
13 1 (0.65%) Documentation Skills
13 1 (0.65%) Inclusion and Diversity
13 1 (0.65%) Police
Job Titles
1 26 (16.77%) Service Manager
2 23 (14.84%) Delivery Manager
3 20 (12.90%) Service Delivery Manager
4 18 (11.61%) Lead
5 16 (10.32%) Architect
6 12 (7.74%) IT Manager
7 11 (7.10%) Analyst
8 10 (6.45%) IT Services Manager
8 10 (6.45%) Senior
9 9 (5.81%) Consultant
10 8 (5.16%) IT Services Delivery Manager
11 7 (4.52%) Designer
11 7 (4.52%) Support Engineer
12 6 (3.87%) Project Manager
12 6 (3.87%) Solutions Architect
13 5 (3.23%) Developer
13 5 (3.23%) IT Support
13 5 (3.23%) Service Analyst
13 5 (3.23%) Technical Architect
14 4 (2.58%) ServiceNow Developer
Libraries, Frameworks & Software Standards
1 8 (5.16%) JSON
2 6 (3.87%) Kafka
3 5 (3.23%) CSS
3 5 (3.23%) HTML
3 5 (3.23%) REST
3 5 (3.23%) Web Services
4 4 (2.58%) ActiveMQ
4 4 (2.58%) RESTful
4 4 (2.58%) XML
5 2 (1.29%) cloud-init
5 2 (1.29%) Keycloak
5 2 (1.29%) SAP Basis
6 1 (0.65%) Apache Camel
6 1 (0.65%) FHIR
6 1 (0.65%) Quarkus
6 1 (0.65%) RabbitMQ
6 1 (0.65%) Spring
6 1 (0.65%) Spring Boot
Miscellaneous
1 8 (5.16%) Management Information System
2 5 (3.23%) Onboarding
2 5 (3.23%) Product Ownership
3 4 (2.58%) Frameworx
3 4 (2.58%) Public Cloud
3 4 (2.58%) TM Forum
4 3 (1.94%) Analytical Mindset
4 3 (1.94%) IVR
4 3 (1.94%) Mainframe
4 3 (1.94%) Market Risk
4 3 (1.94%) NHS
5 2 (1.29%) CMDB
5 2 (1.29%) Data Protection Act
5 2 (1.29%) Legacy Systems
5 2 (1.29%) PACS
5 2 (1.29%) PKI
5 2 (1.29%) Virtual Team
6 1 (0.65%) Cloud Native
6 1 (0.65%) Data Centre
6 1 (0.65%) Enterprise Cloud
Operating Systems
1 18 (11.61%) Windows
2 6 (3.87%) Linux
2 6 (3.87%) Windows 10
2 6 (3.87%) Windows Server
3 4 (2.58%) Unix
4 3 (1.94%) Android
4 3 (1.94%) Windows Server 2016
5 2 (1.29%) CentOS
5 2 (1.29%) Red Hat Enterprise Linux
5 2 (1.29%) zOS
6 1 (0.65%) Mac OS
6 1 (0.65%) MVS
6 1 (0.65%) Windows Server 2019
Processes & Methodologies
1 49 (31.61%) ITIL
2 39 (25.16%) Agile
3 32 (20.65%) Problem-Solving
4 30 (19.35%) Customer Service
5 28 (18.06%) Continuous Improvement
5 28 (18.06%) Service Management
6 18 (11.61%) ITSM
7 17 (10.97%) Stakeholder Management
8 13 (8.39%) Change Management
8 13 (8.39%) Stakeholder Engagement
9 12 (7.74%) Decision-Making
10 11 (7.10%) Roadmaps
11 10 (6.45%) Analytics
11 10 (6.45%) Contract Management
11 10 (6.45%) DevOps
11 10 (6.45%) Incident Management
11 10 (6.45%) Project Management
11 10 (6.45%) Risk Management
11 10 (6.45%) Service Design
12 9 (5.81%) SDLC
Programming Languages
1 10 (6.45%) SQL
2 9 (5.81%) Python
3 5 (3.23%) Java
3 5 (3.23%) JavaScript
3 5 (3.23%) PowerShell
4 4 (2.58%) Bash
5 2 (1.29%) C#
5 2 (1.29%) Go
5 2 (1.29%) JCL
5 2 (1.29%) T-SQL
6 1 (0.65%) Assembly Language
6 1 (0.65%) COBOL
6 1 (0.65%) Perl
6 1 (0.65%) REXX
6 1 (0.65%) Smalltalk
6 1 (0.65%) VB
Qualifications
1 15 (9.68%) Security Cleared
2 14 (9.03%) SC Cleared
3 9 (5.81%) ITIL Certification
4 5 (3.23%) Cisco Certification
5 4 (2.58%) CCNP
6 3 (1.94%) AWS Certification
6 3 (1.94%) CCNA
6 3 (1.94%) Degree
6 3 (1.94%) Master's Degree
7 2 (1.29%) BPSS Clearance
7 2 (1.29%) DV Cleared
7 2 (1.29%) ITIL Foundation Certificate
8 1 (0.65%) ACSP
8 1 (0.65%) APMP
8 1 (0.65%) BC Cleared
8 1 (0.65%) CCDP
8 1 (0.65%) CCIP
8 1 (0.65%) CITP
8 1 (0.65%) PMP
8 1 (0.65%) PRINCE2 Practitioner
Quality Assurance & Compliance
1 17 (10.97%) SLA
2 7 (4.52%) QA
3 4 (2.58%) Accessibility
4 3 (1.94%) Data Quality
4 3 (1.94%) Disclosure Scotland
5 2 (1.29%) Basel II
5 2 (1.29%) ISO/IEC 27001
5 2 (1.29%) NCSC
6 1 (0.65%) Cyber Essentials
6 1 (0.65%) GDPR
6 1 (0.65%) GRC
6 1 (0.65%) HL7
6 1 (0.65%) ISO 22301
6 1 (0.65%) ISO 31000
6 1 (0.65%) PMO
6 1 (0.65%) WCAG
System Software
1 11 (7.10%) Active Directory
2 7 (4.52%) Docker
3 3 (1.94%) Microsoft Virtual Server
3 3 (1.94%) Virtual Servers
4 2 (1.29%) VMware Infrastructure
5 1 (0.65%) ACF2
5 1 (0.65%) Hyper-V
5 1 (0.65%) RACF
Systems Management
1 3 (1.94%) Jamf Pro
1 3 (1.94%) Kubernetes
1 3 (1.94%) Rancher
1 3 (1.94%) ZABBIX
2 2 (1.29%) Ansible
2 2 (1.29%) Consul
2 2 (1.29%) Grafana
2 2 (1.29%) Istio
2 2 (1.29%) linkerd
2 2 (1.29%) Opsgenie
2 2 (1.29%) Packer
2 2 (1.29%) Prometheus
2 2 (1.29%) Terraform
3 1 (0.65%) Microsoft Intune
3 1 (0.65%) PaperCut
3 1 (0.65%) SCCM
3 1 (0.65%) SolarWinds Orion
Vendors
1 22 (14.19%) Microsoft
2 16 (10.32%) ServiceNow
3 11 (7.10%) Cisco
4 6 (3.87%) SAP
5 4 (2.58%) Apple
5 4 (2.58%) BMC
5 4 (2.58%) Salesforce
5 4 (2.58%) SolarWinds
5 4 (2.58%) VMware
6 3 (1.94%) Oracle
6 3 (1.94%) Remedy
7 2 (1.29%) Atlassian
7 2 (1.29%) Citrix
7 2 (1.29%) Google
7 2 (1.29%) Huawei
7 2 (1.29%) Okta
7 2 (1.29%) Palo Alto
7 2 (1.29%) Splunk
8 1 (0.65%) Databricks
8 1 (0.65%) Workday