Service Management Contracts with Work from Home Options

Service Management
UK > Work from Home

The table below provides summary statistics for contract job vacancies with an option to work from home (WFH) and a requirement for Service Management skills. Included is a benchmarking guide to the contractor rates offered in vacancies that have cited Service Management over the 6 months to 4 May 2024 with a comparison to the same period in the previous 2 years.

6 months to
4 May 2024
Same period 2023 Same period 2022
Rank 68 88 121
Rank change year-on-year +20 +33 -4
Contract jobs citing Service Management 444 659 965
As % of all contract jobs with a WFH option 2.93% 2.58% 2.16%
As % of the Processes & Methodologies category 3.33% 2.87% 2.38%
Number of daily rates quoted 290 470 714
10th Percentile £325 £250 £315
25th Percentile £444 £420 £419
Median daily rate (50th Percentile) £525 £525 £525
Median % change year-on-year - - +5.53%
75th Percentile £600 £650 £619
90th Percentile £688 £743 £675
UK median daily rate £525 £500 £518
% change year-on-year +5.00% -3.47% +9.05%
Number of hourly rates quoted 5 6 33
10th Percentile - £17.65 £11.44
25th Percentile £19.00 £29.35 £11.75
Median hourly rate £20.74 £55.00 £17.00
Median % change year-on-year -62.29% +223.53% -8.11%
75th Percentile £26.50 £58.19 £19.50
90th Percentile £26.80 £74.38 £29.50
UK median hourly rate £17.72 £51.75 £18.12
% change year-on-year -65.76% +185.67% -21.78%

All Process and Methodology Skills
Work from Home

Service Management is in the Processes and Methodologies category. The following table is for comparison with the above and provides summary statistics for all contract job vacancies with a WFH option and a requirement for process or methodology skills.

Contract vacancies with a requirement for process or methodology skills 13,316 22,957 40,627
As % of all contract jobs with a WFH option 87.90% 89.76% 91.11%
Number of daily rates quoted 8,913 16,228 29,490
10th Percentile £325 £363 £363
25th Percentile £425 £450 £431
Median daily rate (50th Percentile) £525 £540 £525
Median % change year-on-year -2.78% +2.86% +8.25%
75th Percentile £638 £650 £626
90th Percentile £750 £750 £725
UK median daily rate £525 £550 £530
% change year-on-year -4.55% +3.77% +8.72%
Number of hourly rates quoted 575 528 539
10th Percentile £15.17 £18.93 £13.70
25th Percentile £24.63 £30.00 £19.96
Median hourly rate £42.50 £55.00 £35.00
Median % change year-on-year -22.73% +57.14% +40.00%
75th Percentile £60.00 £68.75 £55.13
90th Percentile £75.15 £80.25 £67.56
UK median hourly rate £35.95 £36.00 £25.00
% change year-on-year -0.14% +44.00% +2.04%

Service Management
Trend for Jobs with a WFH Option

Job vacancies with a work from home option citing Service Management as a proportion of all IT jobs advertised.
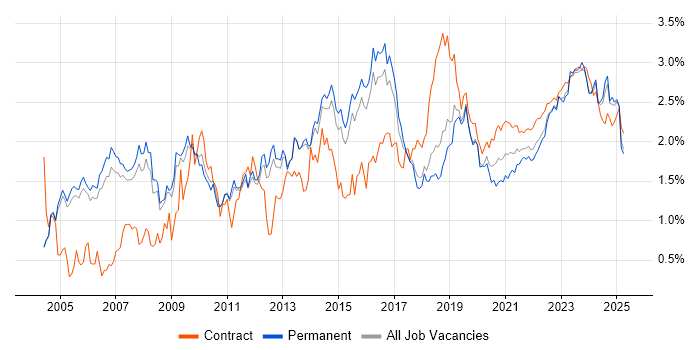
Service Management trend for jobs with a WFH option

Service Management
Daily Rate Trend for Jobs with a WFH Option

3-month moving average daily rate quoted in job vacancies with a work from home option citing Service Management.

Service Management daily rate for jobs with a WFH option

Service Management
Daily Rate Histogram for Jobs with a WFH Option

Daily rate distribution for jobs with a work from home option citing Service Management over the 6 months to 4 May 2024.

Service Management daily rate histogram for jobs with a WFH option

Service Management
Hourly Rate Trend for Jobs with a WFH Option

3-month moving average hourly rate quoted in job vacancies with a work from home option citing Service Management.

Service Management hourly rate for jobs with a WFH option

Service Management
Co-occurring Skills and Capabilities with WFH Options by Category

The follow tables expand on the table above by listing co-occurrences grouped by category. The same employment type, locality and period is covered with up to 20 co-occurrences shown in each of the following categories:

Application Platforms
1 37 (8.33%) Confluence
2 24 (5.41%) SharePoint
3 18 (4.05%) Microsoft Exchange
4 17 (3.83%) SharePoint Server
5 6 (1.35%) IBM HTTP Server
5 6 (1.35%) WebSphere
5 6 (1.35%) WebSphere Application Server
5 6 (1.35%) WebSphere Portal
6 2 (0.45%) Adobe Experience Manager
6 2 (0.45%) CMS
Applications
1 15 (3.38%) Microsoft Office
2 13 (2.93%) Microsoft Excel
3 5 (1.13%) Microsoft PowerPoint
3 5 (1.13%) Microsoft Project
4 1 (0.23%) Chatbot
4 1 (0.23%) Gliffy
4 1 (0.23%) MS Visio
Business Applications
1 15 (3.38%) Remedy ITSM
2 6 (1.35%) SAP S/4HANA
3 2 (0.45%) Shopify
4 1 (0.23%) Oracle Procure-to-Pay
4 1 (0.23%) SAP HCM
4 1 (0.23%) SAP IS-U
4 1 (0.23%) SAP MM
4 1 (0.23%) SAP PM
4 1 (0.23%) SAP Retail
4 1 (0.23%) Sparx Enterprise Architect
Cloud Services
1 75 (16.89%) Azure
2 30 (6.76%) Microsoft 365
3 27 (6.08%) AWS
4 24 (5.41%) Power Platform
5 22 (4.95%) Entra ID
6 19 (4.28%) Azure Monitor
7 17 (3.83%) Azure Stack
7 17 (3.83%) Azure Storage
8 16 (3.60%) IaaS
9 9 (2.03%) PaaS
9 9 (2.03%) SaaS
10 7 (1.58%) Azure DevOps
10 7 (1.58%) GCP
11 6 (1.35%) Amazon EC2
11 6 (1.35%) Virtual Private Cloud
12 5 (1.13%) Google Sheets
13 4 (0.90%) Power Automate
14 3 (0.68%) Azure Logic Apps
14 3 (0.68%) Azure Service Bus
14 3 (0.68%) Dynamics 365
Communications & Networking
1 40 (9.01%) Firewall
2 21 (4.73%) DNS
3 20 (4.50%) DHCP
4 18 (4.05%) BGP
5 7 (1.58%) LAN
6 6 (1.35%) HTTP
6 6 (1.35%) Network Security
6 6 (1.35%) WAN
7 5 (1.13%) Wireless
8 4 (0.90%) Cisco ASA
8 4 (0.90%) VPN
9 3 (0.68%) Cisco ISE
9 3 (0.68%) HTTPS
10 2 (0.45%) SNA
11 1 (0.23%) GSM
11 1 (0.23%) IP Telephony
11 1 (0.23%) NetScreen
11 1 (0.23%) OSPF
11 1 (0.23%) TCP/IP
11 1 (0.23%) WLAN
Database & Business Intelligence
1 21 (4.73%) Power BI
2 7 (1.58%) Amazon RDS
3 6 (1.35%) SQL Server
4 5 (1.13%) GIS
4 5 (1.13%) MySQL
5 3 (0.68%) MariaDB
6 2 (0.45%) Azure SQL Database
6 2 (0.45%) Data Mining
6 2 (0.45%) Pentaho
7 1 (0.23%) Amazon Aurora
7 1 (0.23%) RDBMS
7 1 (0.23%) Relational Database
Development Applications
1 46 (10.36%) JIRA
2 9 (2.03%) Jenkins
3 4 (0.90%) IBM UrbanCode
4 2 (0.45%) Cucumber
4 2 (0.45%) Git
4 2 (0.45%) Maven
4 2 (0.45%) Selenium
4 2 (0.45%) WebDriver
5 1 (0.23%) Axure RP
5 1 (0.23%) webpack
General
1 169 (38.06%) Social Skills
2 109 (24.55%) Finance
3 79 (17.79%) Public Sector
4 69 (15.54%) Banking
5 61 (13.74%) Analytical Skills
6 19 (4.28%) Telecoms
7 17 (3.83%) Marketing
8 13 (2.93%) Presentation Skills
9 11 (2.48%) Inclusion and Diversity
10 10 (2.25%) Retail
11 9 (2.03%) Manufacturing
12 8 (1.80%) Back Office
12 8 (1.80%) Influencing Skills
13 7 (1.58%) Electronics
14 4 (0.90%) Law
14 4 (0.90%) Organisational Skills
15 3 (0.68%) Documentation Skills
15 3 (0.68%) Publishing
16 2 (0.45%) Aerospace
16 2 (0.45%) Local Government
Job Titles
1 94 (21.17%) Analyst
2 56 (12.61%) Service Manager
3 44 (9.91%) Architect
4 41 (9.23%) Banking Analyst
5 33 (7.43%) Business Analyst
5 33 (7.43%) Consultant
5 33 (7.43%) Lead
5 33 (7.43%) Service Analyst
6 31 (6.98%) IT Analyst
7 26 (5.86%) Senior
8 25 (5.63%) Data Analyst
9 23 (5.18%) Banking Business Analyst
9 23 (5.18%) Developer
10 20 (4.50%) Service Architect
11 18 (4.05%) Microsoft Engineer
12 17 (3.83%) Service Transition Manager
12 17 (3.83%) ServiceNow Developer
12 17 (3.83%) Transition Manager
13 16 (3.60%) Active Directory Support
14 15 (3.38%) Azure Specialist
Libraries, Frameworks & Software Standards
1 27 (6.08%) Web Services
2 17 (3.83%) ARM Templates
3 8 (1.80%) J2EE
3 8 (1.80%) Middleware
3 8 (1.80%) REST
4 6 (1.35%) CSS
5 4 (0.90%) HTML
6 3 (0.68%) AngularJS
6 3 (0.68%) React Native
6 3 (0.68%) SOAP
7 2 (0.45%) .NET
7 2 (0.45%) Gherkin
7 2 (0.45%) jQuery
7 2 (0.45%) RESTful
7 2 (0.45%) Sass
7 2 (0.45%) Spring MVC
7 2 (0.45%) Twitter Bootstrap
7 2 (0.45%) VML
7 2 (0.45%) XML
7 2 (0.45%) YAML
Miscellaneous
1 39 (8.78%) Management Information System
2 29 (6.53%) CMDB
3 23 (5.18%) Self-Motivation
4 18 (4.05%) PKI
5 17 (3.83%) Private Cloud
6 14 (3.15%) Virtual Team
7 9 (2.03%) Data Centre
8 7 (1.58%) Operational Technology
9 5 (1.13%) Clustering
9 5 (1.13%) LIMS
10 3 (0.68%) Linux Command Line
10 3 (0.68%) Onboarding
10 3 (0.68%) Product Ownership
11 2 (0.45%) BYOD
11 2 (0.45%) Cyber Threat
11 2 (0.45%) Public Cloud
12 1 (0.23%) FMCG
12 1 (0.23%) Media Streaming
12 1 (0.23%) Mobile App
12 1 (0.23%) NHS
Operating Systems
1 52 (11.71%) Windows
2 26 (5.86%) Linux
3 23 (5.18%) Windows Server
4 17 (3.83%) Windows Server 2016
5 16 (3.60%) Windows Server 2019
6 8 (1.80%) Windows 10
7 2 (0.45%) Unix
8 1 (0.23%) Android
8 1 (0.23%) Apple iOS
8 1 (0.23%) Mac OS
8 1 (0.23%) Windows Server 2012
Processes & Methodologies
1 244 (54.95%) ITIL
2 187 (42.12%) ITSM
3 91 (20.50%) Change Management
4 82 (18.47%) Agile
5 69 (15.54%) Problem-Solving
6 67 (15.09%) Service Delivery
7 49 (11.04%) Asset Management
8 48 (10.81%) DevOps
9 47 (10.59%) Customer Service
10 45 (10.14%) Configuration Management
11 42 (9.46%) Continuous Improvement
11 42 (9.46%) Service Design
12 40 (9.01%) Stakeholder Management
13 38 (8.56%) Incident Management
13 38 (8.56%) Problem Management
14 37 (8.33%) Analytics
15 31 (6.98%) Business Analysis
16 30 (6.76%) Project Management
17 29 (6.53%) Capacity Management
18 28 (6.31%) User Stories
Programming Languages
1 25 (5.63%) PowerShell
2 19 (4.28%) C#
3 17 (3.83%) Bicep
3 17 (3.83%) SQL
3 17 (3.83%) VB
3 17 (3.83%) VBScript
4 10 (2.25%) Java
5 8 (1.80%) JavaScript
6 4 (0.90%) Python
7 2 (0.45%) Bash
8 1 (0.23%) Apex Code
8 1 (0.23%) Shell Script
8 1 (0.23%) TypeScript
Qualifications
1 170 (38.29%) Security Cleared
2 137 (30.86%) SC Cleared
3 51 (11.49%) DV Cleared
4 29 (6.53%) Degree
5 20 (4.50%) ITIL Foundation Certificate
6 17 (3.83%) ITIL Certification
7 13 (2.93%) BPSS Clearance
8 8 (1.80%) Microsoft Certification
9 7 (1.58%) AWS Certification
9 7 (1.58%) Cisco Certification
10 6 (1.35%) MCSE
11 4 (0.90%) CCNP
12 3 (0.68%) CCSA
12 3 (0.68%) JNCIA
13 2 (0.45%) CCNA
13 2 (0.45%) HNC
13 2 (0.45%) ISEB
13 2 (0.45%) NVQ Level 3
13 2 (0.45%) PMI Certification
13 2 (0.45%) PMP
Quality Assurance & Compliance
1 24 (5.41%) SLA
2 18 (4.05%) Government Security Classifications
3 13 (2.93%) ISO/IEC 20000
4 11 (2.48%) QA
5 7 (1.58%) Data Quality
6 6 (1.35%) ISO/IEC 27001
7 4 (0.90%) Accessibility
7 4 (0.90%) COBIT
7 4 (0.90%) Disclosure Scotland
8 2 (0.45%) NCSC
9 1 (0.23%) Cyber Essentials
9 1 (0.23%) ISO 22301
9 1 (0.23%) PCI DSS
9 1 (0.23%) PMO
9 1 (0.23%) Sarbanes-Oxley
9 1 (0.23%) WCAG
System Software
1 26 (5.86%) Active Directory
2 20 (4.50%) Virtual Desktop
3 18 (4.05%) Virtual Machines
4 3 (0.68%) VMware NSX
5 1 (0.23%) Docker
5 1 (0.23%) VMware ESXi
5 1 (0.23%) VMware Infrastructure
Systems Management
1 34 (7.66%) SCOM
2 21 (4.73%) Microsoft Intune
3 19 (4.28%) Kubernetes
4 18 (4.05%) SCCM
5 17 (3.83%) Active Directory Federation Services
5 17 (3.83%) WSUS
6 10 (2.25%) Terraform
7 3 (0.68%) Ansible
8 2 (0.45%) Jamf Pro
8 2 (0.45%) Progress Chef
8 2 (0.45%) Puppet
8 2 (0.45%) vRealize
8 2 (0.45%) VxRail
9 1 (0.23%) Check_MK
9 1 (0.23%) vCenter Server
Vendors
1 82 (18.47%) ServiceNow
2 77 (17.34%) Microsoft
3 21 (4.73%) Atlassian
4 17 (3.83%) SAP
5 16 (3.60%) Remedy
6 9 (2.03%) Cisco
7 8 (1.80%) Google
8 6 (1.35%) Dell
8 6 (1.35%) IBM
9 5 (1.13%) InterSystems
9 5 (1.13%) Juniper
10 4 (0.90%) Freshdesk
10 4 (0.90%) Salesforce
11 3 (0.68%) Blue Coat
11 3 (0.68%) BMC
11 3 (0.68%) CheckPoint
11 3 (0.68%) Databricks
11 3 (0.68%) Oracle
11 3 (0.68%) Palo Alto
11 3 (0.68%) VMware