Def Stans Job Trends in England

UK Defence Standards (Def Stans)
UK > England

The table below provides summary statistics and salary benchmarking for jobs advertised in England requiring Def Stans skills. It covers permanent job vacancies from the 6 months leading up to 11 October 2026, with comparisons to the same periods in the previous two years.

6 months to
11 Oct 2026
Same period 2025 Same period 2024
Rank 715 577 710
Rank change year-on-year -138 +133 -20
Permanent jobs citing Def Stans 57 58 31
As % of all permanent jobs in England 0.055% 0.13% 0.048%
As % of the Quality Assurance & Compliance category 0.53% 0.88% 0.34%
Number of salaries quoted 32 19 10
10th Percentile £55,000 £56,500 £45,600
25th Percentile £67,500 £63,750 £51,750
Median annual salary (50th Percentile) £75,000 £67,500 £70,000
Median % change year-on-year +11.11% -3.57% +3.70%
75th Percentile £83,125 £82,500 £74,688
90th Percentile £87,250 £85,000 £78,750
UK median annual salary £75,000 £67,500 £70,000
% change year-on-year +11.11% -3.57% +27.27%

All Quality Assurance and Compliance Skills
England

Def Stans falls under the Quality Assurance and Compliance category. For comparison with the information above, the following table provides summary statistics for all permanent job vacancies requiring quality assurance or compliance skills in England.

Permanent vacancies with a requirement for quality assurance or compliance skills 10,847 6,617 9,161
As % of all permanent jobs advertised in England 10.43% 15.38% 14.15%
Number of salaries quoted 6,984 3,854 4,294
10th Percentile £31,113 £29,750 £30,000
25th Percentile £41,250 £39,750 £41,250
Median annual salary (50th Percentile) £55,000 £56,000 £58,500
Median % change year-on-year -1.79% -4.27% -2.50%
75th Percentile £75,250 £76,250 £78,750
90th Percentile £95,000 £93,750 £97,500
UK median annual salary £55,000 £57,500 £57,500
% change year-on-year -4.35% - -4.17%

Def Stans
Job Vacancy Trend in England

Historical trend showing the proportion of permanent IT job postings citing Def Stans relative to all permanent IT jobs advertised in England.

Def Stans job vacancy trend in England

Def Stans
Salary Trend in England

Salary distribution trend for jobs in England citing Def Stans.
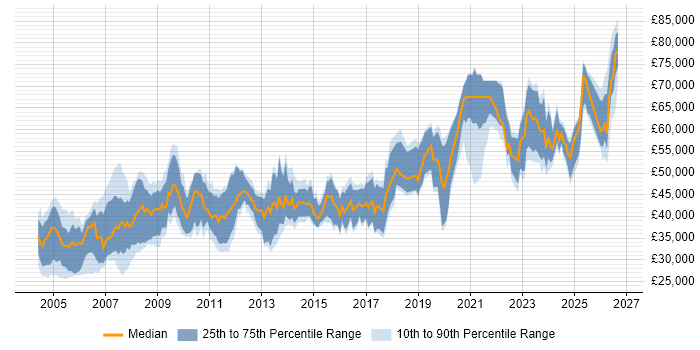
Salary distribution trend for jobs in England citing Def Stans

Def Stans
Salary Histogram in England

Salary distribution for jobs citing Def Stans in England over the 6 months to 11 October 2026.

Salary histogram for Def Stans in England

Def Stans
Job Locations in England

The table below looks at the demand and provides a guide to the median salaries quoted in IT jobs citing Def Stans within the England region over the 6 months to 11 October 2026. The 'Rank Change' column provides an indication of the change in demand within each location based on the same 6 month period last year.

Location Rank Change
on Same Period
Last Year
Matching
Permanent
IT Job Ads
Median Salary
Past 6 Months
Median Salary
% Change
on Same Period
Last Year
Live
Jobs
South West -64 22 £80,000 - 15
South East -66 20 £71,250 +5.56% 12
Midlands -40 10 £70,000 -6.67% 5
East Midlands - 10 £70,000 -
London - 3 £92,500 - 18
North of England -69 2 - - 8
North West -25 1 - - 4
North East -67 1 - -
Def Stans
UK

Def Stans
Co-Occurring Skills & Capabilities in England by Category

The following tables expand on the one above by listing co-occurrences grouped by category. They cover the same employment type, locality and period, with up to 20 co-occurrences shown in each category:

Application Platforms
1 4 (7.02%) SharePoint
Applications
1 4 (7.02%) Microsoft Excel
1 4 (7.02%) Microsoft PowerPoint
1 4 (7.02%) Windchill
2 2 (3.51%) Simulink
3 1 (1.75%) Microsoft Office
Cloud Services
1 7 (12.28%) AWS
1 7 (12.28%) Azure
2 4 (7.02%) GCP
2 4 (7.02%) GitHub
Communications & Networking
1 3 (5.26%) Intrusion Detection
2 2 (3.51%) Ethernet
2 2 (3.51%) RS-422
2 2 (3.51%) RS-485
3 1 (1.75%) Cisco IOS
3 1 (1.75%) VoIP
Database & Business Intelligence
1 4 (7.02%) GIS
Development Applications
1 2 (3.51%) LabVIEW
2 1 (1.75%) Rational DOORS
General
1 24 (42.11%) Social Skills
2 18 (31.58%) Electronics
3 16 (28.07%) Military
4 15 (26.32%) Aerospace
5 14 (24.56%) Analytical Skills
6 12 (21.05%) Finance
7 10 (17.54%) Legal
8 5 (8.77%) Organisational Skills
9 4 (7.02%) Environmental Health
9 4 (7.02%) Public Sector
10 3 (5.26%) Automotive
10 3 (5.26%) Aviation
10 3 (5.26%) Law
11 2 (3.51%) Avionics
11 2 (3.51%) Inclusion and Diversity
11 2 (3.51%) Influencing Skills
11 2 (3.51%) Manufacturing
12 1 (1.75%) Italian Language
12 1 (1.75%) Japanese Language
Job Titles
1 12 (21.05%) Systems Engineer
2 10 (17.54%) Lead
3 5 (8.77%) Safety Engineer
4 4 (7.02%) Architect
4 4 (7.02%) Configuration and Release Manager
4 4 (7.02%) Configuration Manager
4 4 (7.02%) Consultant
4 4 (7.02%) Release and Configuration Manager
4 4 (7.02%) Release Manager
4 4 (7.02%) Safety Consultant
4 4 (7.02%) Security Architect
5 3 (5.26%) Cybersecurity Manager
5 3 (5.26%) EMC Engineer
5 3 (5.26%) Security Manager
5 3 (5.26%) Systems Safety Engineer
6 2 (3.51%) Chief Systems Engineer
6 2 (3.51%) Hardware Engineer
6 2 (3.51%) IT Security Specialist
6 2 (3.51%) Security Specialist
7 1 (1.75%) Support Manager
Libraries, Frameworks & Software Standards
1 2 (3.51%) Elastic Stack
Miscellaneous
1 10 (17.54%) Management Information System
2 4 (7.02%) Analytical Mindset
2 4 (7.02%) CMDB
2 4 (7.02%) Embedded Systems
3 3 (5.26%) Analogue Electronics
3 3 (5.26%) Cyber Defence
3 3 (5.26%) Cyber Threat
3 3 (5.26%) Cyber Warfare
3 3 (5.26%) Robotics
3 3 (5.26%) Security Posture
4 2 (3.51%) ARM Cortex
4 2 (3.51%) Driving Licence
4 2 (3.51%) FPGA
5 1 (1.75%) CESG
5 1 (1.75%) Linux Command Line
Operating Systems
1 3 (5.26%) Linux
2 2 (3.51%) Windows
Processes & Methodologies
1 21 (36.84%) Software Engineering
2 15 (26.32%) Systems Engineering
3 14 (24.56%) FMEA
4 13 (22.81%) Problem-Solving
4 13 (22.81%) Stakeholder Engagement
5 12 (21.05%) Programme Management
6 10 (17.54%) Contract Management
6 10 (17.54%) Contract Negotiation
6 10 (17.54%) Cost Management
6 10 (17.54%) Hardware Maintenance
6 10 (17.54%) Incident Response
6 10 (17.54%) Performance Metrics
7 9 (15.79%) Configuration Management
7 9 (15.79%) Matrix Organization
7 9 (15.79%) Vulnerability Management
8 8 (14.04%) Computer Science
8 8 (14.04%) Continuous Improvement
8 8 (14.04%) Release Management
8 8 (14.04%) Risk Assessment
8 8 (14.04%) Technical Leadership
Programming Languages
1 6 (10.53%) MATLAB
1 6 (10.53%) Python
2 4 (7.02%) C
2 4 (7.02%) C#
2 4 (7.02%) C++
2 4 (7.02%) Embedded C
2 4 (7.02%) Embedded C++
Qualifications
1 38 (66.67%) Security Cleared
2 34 (59.65%) SC Cleared
3 33 (57.89%) Degree
4 11 (19.30%) DV Cleared
5 6 (10.53%) Chartered Engineer
6 4 (7.02%) CISM
6 4 (7.02%) CISSP
6 4 (7.02%) CITP
6 4 (7.02%) Computer Science Degree
6 4 (7.02%) PMI Certification
6 4 (7.02%) PMP
7 3 (5.26%) BPSS Clearance
7 3 (5.26%) CEH
7 3 (5.26%) CISA
8 2 (3.51%) EMC Certification
8 2 (3.51%) HNC
8 2 (3.51%) HND
9 1 (1.75%) APMP
9 1 (1.75%) Master's Degree
9 1 (1.75%) PRINCE2 Practitioner
Quality Assurance & Compliance
1 10 (17.54%) ISO/IEC 27001
1 10 (17.54%) SLA
2 9 (15.79%) NIST
3 8 (14.04%) IEC 61508
3 8 (14.04%) NIST 800
4 6 (10.53%) QA
5 5 (8.77%) ARP4761
6 4 (7.02%) Accessibility
6 4 (7.02%) DO-254
6 4 (7.02%) HAZOP
6 4 (7.02%) ISO 26262
6 4 (7.02%) ISO 9000
6 4 (7.02%) ISO/IEC 15288
7 3 (5.26%) Cyber Essentials
7 3 (5.26%) DO-160
7 3 (5.26%) GDPR
7 3 (5.26%) GRC
7 3 (5.26%) ISO 9001
8 2 (3.51%) JSP 440
9 1 (1.75%) ARP4754
System Software
1 1 (1.75%) Firmware
Systems Management
1 3 (5.26%) Functional Safety
Vendors
1 10 (17.54%) EMC
2 7 (12.28%) Microsoft
3 4 (7.02%) Facebook
3 4 (7.02%) Instagram
4 2 (3.51%) Altera
4 2 (3.51%) Xilinx
5 1 (1.75%) Cisco