Principal Engineer
UK > England
The median Principal Engineer salary in England is £70,000 per year, according to job vacancies posted during the 6 months leading to 22 May 2025.
The table below provides salary benchmarking and summary statistics, comparing them to the same period in the previous two years.
| 6 months to 22 May 2025 |
Same period 2024 | Same period 2023 | |
|---|---|---|---|
| Rank | 50 | 274 | 476 |
| Rank change year-on-year | +224 | +202 | -92 |
| Permanent jobs requiring a Principal Engineer | 2,397 | 893 | 526 |
| As % of all permanent jobs advertised in England | 4.93% | 1.03% | 0.60% |
| As % of the Job Titles category | 5.43% | 1.09% | 0.65% |
| Number of salaries quoted | 478 | 392 | 376 |
| 10th Percentile | £48,596 | £60,000 | £61,625 |
| 25th Percentile | £58,000 | £65,000 | £70,000 |
| Median annual salary (50th Percentile) | £70,000 | £80,000 | £85,000 |
| Median % change year-on-year | -12.50% | -5.88% | - |
| 75th Percentile | £70,600 | £93,750 | £115,000 |
| 90th Percentile | £77,500 | £115,000 | £152,500 |
| UK median annual salary | £70,000 | £80,000 | £85,000 |
| % change year-on-year | -12.50% | -5.88% | - |
All Permanent IT Job Vacancies
England
For comparison with the information above, the following table provides summary statistics for all permanent IT job vacancies in England. Most job vacancies include a discernible job title that can be normalized. As such, the figures in the second row provide an indication of the number of permanent jobs in our overall sample.
| Permanent vacancies in England with a recognized job title | 44,182 | 81,825 | 80,489 |
| % of permanent jobs with a recognized job title | 90.87% | 94.55% | 91.53% |
| Number of salaries quoted | 23,287 | 60,848 | 51,240 |
| 10th Percentile | £29,750 | £28,500 | £32,500 |
| 25th Percentile | £41,250 | £38,250 | £45,000 |
| Median annual salary (50th Percentile) | £56,800 | £53,000 | £60,800 |
| Median % change year-on-year | +7.17% | -12.83% | +1.33% |
| 75th Percentile | £75,000 | £71,250 | £82,250 |
| 90th Percentile | £97,500 | £90,000 | £100,000 |
| UK median annual salary | £56,000 | £52,500 | £60,000 |
| % change year-on-year | +6.67% | -12.50% | - |
Principal Engineer
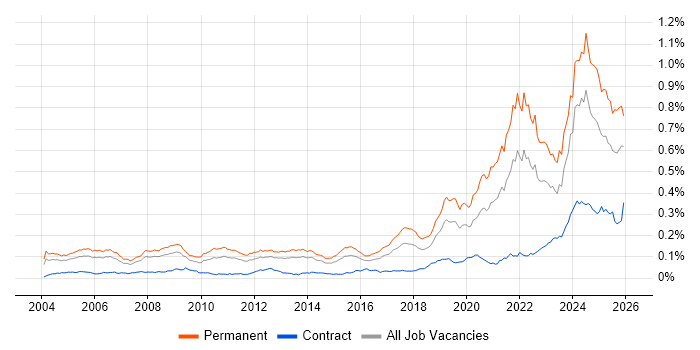
Job Vacancy Trend in England
Job postings that featured Principal Engineer in the job title as a proportion of all IT jobs advertised in England.

Principal Engineer
Salary Trend in England
3-month moving average salary quoted in jobs citing Principal Engineer in England.
Principal Engineer
Salary Histogram in England
Salary distribution for jobs citing Principal Engineer in England over the 6 months to 22 May 2025.
Principal Engineer
Job Locations in England
The table below looks at the demand and provides a guide to the median salaries quoted in IT jobs citing Principal Engineer within the England region over the 6 months to 22 May 2025. The 'Rank Change' column provides an indication of the change in demand within each location based on the same 6 month period last year.
| Location | Rank Change on Same Period Last Year |
Matching Permanent IT Job Ads |
Median Salary Past 6 Months |
Median Salary % Change on Same Period Last Year |
Live Jobs |
|---|---|---|---|---|---|
| Midlands | +194 | 1,265 | £67,500 | -10.00% | 68 |
| West Midlands | +190 | 824 | £61,625 | -17.83% | 51 |
| East Midlands | +126 | 441 | £71,250 | -5.00% | 16 |
| North of England | +145 | 411 | £51,564 | -20.67% | 113 |
| South East | +186 | 405 | £70,600 | -2.62% | 157 |
| North West | +134 | 360 | £51,564 | -20.67% | 70 |
| South West | +105 | 219 | £58,000 | -17.14% | 77 |
| London | -11 | 51 | £100,000 | +8.11% | 201 |
| Yorkshire | +56 | 47 | £65,000 | - | 36 |
| East of England | -2 | 43 | £67,000 | -13.55% | 66 |
| North East | +28 | 4 | £60,000 | - | 8 |
| Principal Engineer UK |
|||||
Principal Engineer Skill Set
Top 30 Co-occurring Skills and Capabilities in England
For the 6 months to 22 May 2025, Principal Engineer job roles required the following skills and capabilities in order of popularity. The figures indicate the absolute number co-occurrences and as a proportion of all permanent job ads across the England region featuring Principal Engineer in the job title.
|
|
Principal Engineer Skill Set
Co-occurring Skills and Capabilities in England by Category
The follow tables expand on the table above by listing co-occurrences grouped by category. The same employment type, locality and period is covered with up to 20 co-occurrences shown in each of the following categories:
|
|
||||||||||||||||||||||||||||||||||||||||||||||||||||||||||||||||||||||||||||||||||||||||||||||||||||||||||||||||||||||||||||||
|
|
||||||||||||||||||||||||||||||||||||||||||||||||||||||||||||||||||||||||||||||||||||||||||||||||||||||||||||||||||||||||||||||
|
|
||||||||||||||||||||||||||||||||||||||||||||||||||||||||||||||||||||||||||||||||||||||||||||||||||||||||||||||||||||||||||||||
|
|
||||||||||||||||||||||||||||||||||||||||||||||||||||||||||||||||||||||||||||||||||||||||||||||||||||||||||||||||||||||||||||||
|
|
||||||||||||||||||||||||||||||||||||||||||||||||||||||||||||||||||||||||||||||||||||||||||||||||||||||||||||||||||||||||||||||
|
|
||||||||||||||||||||||||||||||||||||||||||||||||||||||||||||||||||||||||||||||||||||||||||||||||||||||||||||||||||||||||||||||
|
|
||||||||||||||||||||||||||||||||||||||||||||||||||||||||||||||||||||||||||||||||||||||||||||||||||||||||||||||||||||||||||||||
|
|
||||||||||||||||||||||||||||||||||||||||||||||||||||||||||||||||||||||||||||||||||||||||||||||||||||||||||||||||||||||||||||||
|
|
||||||||||||||||||||||||||||||||||||||||||||||||||||||||||||||||||||||||||||||||||||||||||||||||||||||||||||||||||||||||||||||
