Technical Leadership Jobs in England

Technical Leadership
UK > England

The table below provides summary statistics for permanent job vacancies advertised in England requiring Technical Leadership skills. It includes a benchmarking guide to the annual salaries offered in vacancies that cited Technical Leadership over the 6 months leading up to 30 May 2025, comparing them to the same period in the previous two years.

6 months to
30 May 2025
Same period 2024 Same period 2023
Rank 130 173 195
Rank change year-on-year +43 +22 +21
Permanent jobs citing Technical Leadership 1,221 1,455 1,632
As % of all permanent jobs advertised in England 2.49% 1.63% 1.89%
As % of the Processes & Methodologies category 2.65% 1.93% 1.98%
Number of salaries quoted 915 967 1,013
10th Percentile £58,942 £48,000 £51,250
25th Percentile £62,000 £58,250 £62,250
Median annual salary (50th Percentile) £70,600 £72,500 £80,000
Median % change year-on-year -2.62% -9.38% +6.67%
75th Percentile £84,313 £90,000 £95,000
90th Percentile £107,500 £110,500 £115,000
UK median annual salary £70,600 £72,500 £79,632
% change year-on-year -2.62% -8.96% +6.18%

All Process and Methodology Skills
England

Technical Leadership falls under the Processes and Methodologies category. For comparison with the information above, the following table provides summary statistics for all permanent job vacancies requiring process or methodology skills in England.

Permanent vacancies with a requirement for process or methodology skills 46,039 75,199 82,570
As % of all permanent jobs advertised in England 94.03% 84.05% 95.58%
Number of salaries quoted 22,875 54,702 49,146
10th Percentile £29,500 £29,000 £34,452
25th Percentile £41,250 £40,000 £46,000
Median annual salary (50th Percentile) £57,500 £55,000 £62,500
Median % change year-on-year +4.55% -12.00% +4.17%
75th Percentile £75,000 £72,500 £82,500
90th Percentile £97,528 £93,750 £102,500
UK median annual salary £57,443 £55,000 £60,899
% change year-on-year +4.44% -9.69% +1.50%

Technical Leadership
Job Vacancy Trend in England

Job postings citing Technical Leadership as a proportion of all IT jobs advertised in England.
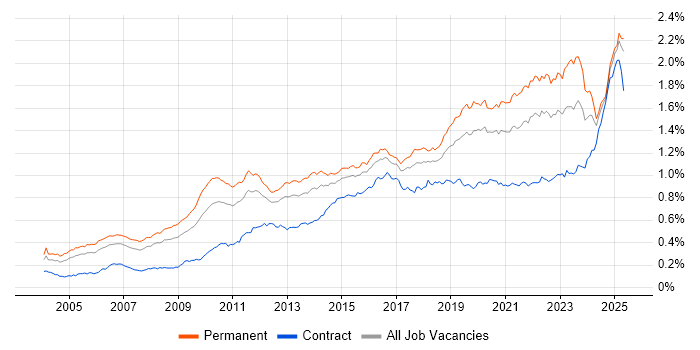
Job vacancy trend for Technical Leadership in England

Technical Leadership
Salary Trend in England

3-month moving average salary quoted in jobs citing Technical Leadership in England.

Salary trend for Technical Leadership in England

Technical Leadership
Salary Histogram in England

Salary distribution for jobs citing Technical Leadership in England over the 6 months to 30 May 2025.

Salary histogram for Technical Leadership in England

Technical Leadership
Job Locations in England

The table below looks at the demand and provides a guide to the median salaries quoted in IT jobs citing Technical Leadership within the England region over the 6 months to 30 May 2025. The 'Rank Change' column provides an indication of the change in demand within each location based on the same 6 month period last year.

Location Rank Change
on Same Period
Last Year
Matching
Permanent
IT Job Ads
Median Salary
Past 6 Months
Median Salary
% Change
on Same Period
Last Year
Live
Jobs
South East +131 629 £70,600 +8.62% 1,188
London +2 269 £100,000 +17.65% 489
North of England -14 175 £71,991 +10.64% 937
North West -20 113 £62,205 -11.50% 451
Yorkshire +25 58 £77,500 +24.00% 378
South West -7 58 £67,500 +3.85% 513
Midlands +10 53 £75,000 - 785
West Midlands +9 43 £75,000 - 425
East of England -15 23 £71,500 +10.00% 627
East Midlands +16 10 £72,500 +3.57% 308
North East +29 4 £72,250 -3.67% 111
Technical Leadership
UK

Technical Leadership
Co-occurring Skills and Capabilities in England by Category

The follow tables expand on the table above by listing co-occurrences grouped by category. The same employment type, locality and period is covered with up to 20 co-occurrences shown in each of the following categories:

Application Platforms
1 25 (2.05%) Apache Spark
2 16 (1.31%) Apache Airflow
3 9 (0.74%) Confluence
4 7 (0.57%) Apache
4 7 (0.57%) CMS
4 7 (0.57%) SharePoint
5 5 (0.41%) Appian
5 5 (0.41%) Headless CMS
5 5 (0.41%) Microsoft Exchange
6 3 (0.25%) IIS
6 3 (0.25%) nginx
6 3 (0.25%) Oracle Workflow
6 3 (0.25%) Tomcat
7 2 (0.16%) WebSphere
7 2 (0.16%) WebSphere Application Server
8 1 (0.082%) CICS
8 1 (0.082%) Drupal
8 1 (0.082%) NetWeaver
8 1 (0.082%) Skype for Business
Applications
1 59 (4.83%) Microsoft Office
2 42 (3.44%) Simulink
3 8 (0.66%) MS Visio
4 4 (0.33%) Microsoft Excel
5 2 (0.16%) Trello
6 1 (0.082%) Adobe XD
6 1 (0.082%) AutoCAD
6 1 (0.082%) Chatbot
Business Applications
1 12 (0.98%) Dynamics AX
2 7 (0.57%) Dynamics CRM
3 4 (0.33%) Orchestrade
3 4 (0.33%) Payment Gateway
4 3 (0.25%) Oracle EBS R12
5 2 (0.16%) Oracle EBS
5 2 (0.16%) Oracle Financials
6 1 (0.082%) BASE24
6 1 (0.082%) Oracle ERP
6 1 (0.082%) Oracle Procure-to-Pay
6 1 (0.082%) Oracle Subledger Accounting
6 1 (0.082%) PeopleSoft HCM
Cloud Services
1 248 (20.31%) Azure
2 209 (17.12%) AWS
3 92 (7.53%) GCP
4 63 (5.16%) Azure DevOps
5 55 (4.50%) Serverless
6 39 (3.19%) AWS Lambda
7 33 (2.70%) GitHub
8 32 (2.62%) Power Platform
9 27 (2.21%) AWS CloudFormation
10 26 (2.13%) Azure Service Bus
10 26 (2.13%) Dynamics 365
11 24 (1.97%) Azure Cosmos DB
12 23 (1.88%) SonarCloud
13 22 (1.80%) Amazon S3
13 22 (1.80%) Cloud Computing
13 22 (1.80%) Salesforce Sales Cloud
13 22 (1.80%) Snowflake
14 20 (1.64%) GitHub Actions
15 18 (1.47%) SaaS
16 17 (1.39%) Microsoft 365
Communications & Networking
1 51 (4.18%) WAN
2 38 (3.11%) Network Security
3 37 (3.03%) LAN
4 32 (2.62%) Firewall
5 30 (2.46%) BGP
5 30 (2.46%) VPN
6 24 (1.97%) Junos
6 24 (1.97%) MPLS
7 21 (1.72%) IPsec
8 19 (1.56%) Cisco IOS
8 19 (1.56%) DNS
9 17 (1.39%) TCP/IP
10 15 (1.23%) SD-WAN
11 11 (0.90%) Multicast
11 11 (0.90%) VLAN
12 9 (0.74%) OSPF
13 8 (0.66%) 5G
13 8 (0.66%) Cisco Nexus
13 8 (0.66%) SAN
14 6 (0.49%) NAS
Database & Business Intelligence
1 53 (4.34%) NoSQL
2 41 (3.36%) SQL Server
3 33 (2.70%) Data Warehouse
4 30 (2.46%) Data Lake
5 27 (2.21%) Big Data
6 26 (2.13%) Elasticsearch
7 24 (1.97%) MongoDB
8 23 (1.88%) Relational Database
9 20 (1.64%) Power BI
10 17 (1.39%) Hadoop
10 17 (1.39%) PostgreSQL
11 16 (1.31%) Amazon Redshift
12 14 (1.15%) Metadata
13 12 (0.98%) Amazon RDS
13 12 (0.98%) BigQuery
14 7 (0.57%) DynamoDB
14 7 (0.57%) MySQL
14 7 (0.57%) RDBMS
15 5 (0.41%) Amazon Athena
15 5 (0.41%) SQL Server Integration Services
Development Applications
1 368 (30.14%) Rational DOORS
2 68 (5.57%) Git
3 43 (3.52%) JIRA
4 35 (2.87%) Jenkins
5 25 (2.05%) GitLab
5 25 (2.05%) Octopus Deploy
5 25 (2.05%) Team Foundation Server
5 25 (2.05%) Visual Studio
6 23 (1.88%) MSBuild
7 8 (0.66%) Selenium
7 8 (0.66%) Sonatype Nexus
8 7 (0.57%) Gradle
8 7 (0.57%) SonarQube
9 6 (0.49%) Robot Framework
10 5 (0.41%) Snyk
10 5 (0.41%) Storybook
11 4 (0.33%) Cypress.io
11 4 (0.33%) Maven
12 3 (0.25%) Oracle Forms
13 2 (0.16%) JUnit
General
1 425 (34.81%) Electronics
2 357 (29.24%) Social Skills
3 191 (15.64%) Finance
4 88 (7.21%) Law
5 86 (7.04%) Analytical Skills
6 66 (5.41%) Banking
7 54 (4.42%) Public Sector
8 48 (3.93%) Aerospace
8 48 (3.93%) Retail
9 38 (3.11%) Inclusion and Diversity
10 31 (2.54%) Marketing
11 18 (1.47%) Games
12 17 (1.39%) Pharmaceutical
12 17 (1.39%) Presentation Skills
13 14 (1.15%) Investment Banking
14 12 (0.98%) Manufacturing
15 11 (0.90%) Retail Banking
16 10 (0.82%) Organisational Skills
17 9 (0.74%) Advertising
17 9 (0.74%) Influencing Skills
Job Titles
1 391 (32.02%) Systems Engineer
2 306 (25.06%) Lead
3 303 (24.82%) Senior
4 238 (19.49%) Architect
5 222 (18.18%) Principal Engineer
6 204 (16.71%) Principal Systems Engineer
7 186 (15.23%) Senior Systems Engineer
8 73 (5.98%) Software Engineer
9 69 (5.65%) Solutions Architect
10 60 (4.91%) Developer
11 52 (4.26%) Team Leader
12 48 (3.93%) Technical Architect
13 43 (3.52%) Technical Leader
14 42 (3.44%) Lead Software Engineer
15 40 (3.28%) Lead Systems Engineer
16 33 (2.70%) Network Architect
16 33 (2.70%) Radar Engineer
17 30 (2.46%) Senior Software Engineer
18 25 (2.05%) Data Engineer
19 23 (1.88%) Enterprise Architect
Libraries, Frameworks & Software Standards
1 75 (6.14%) Kafka
2 72 (5.90%) .NET
3 67 (5.49%) React
4 65 (5.32%) REST
5 49 (4.01%) CSS
6 48 (3.93%) HTML
7 39 (3.19%) Node.js
8 34 (2.78%) AngularJS
9 33 (2.70%) SOAP
10 32 (2.62%) Middleware
11 30 (2.46%) JSON
12 29 (2.38%) XML
13 25 (2.05%) ASP.NET
14 24 (1.97%) gRPC
15 23 (1.88%) Bootstrap
16 22 (1.80%) Lightning Web Components
16 22 (1.80%) RESTful
17 21 (1.72%) Spring
18 20 (1.64%) GraphQL
19 16 (1.31%) Spring Boot
Miscellaneous
1 417 (34.15%) Algorithms
2 87 (7.13%) Cloud Native
3 49 (4.01%) Enterprise Software
3 49 (4.01%) Product Ownership
4 44 (3.60%) Management Information System
5 20 (1.64%) Legacy Systems
6 19 (1.56%) Mobile App
7 17 (1.39%) Virtual Team
8 16 (1.31%) Data Centre
8 16 (1.31%) Data Structures
9 15 (1.23%) Hybrid Cloud
10 12 (0.98%) FMCG
11 11 (0.90%) Greenfield Project
11 11 (0.90%) Self-Motivation
12 10 (0.82%) Clustering
12 10 (0.82%) Derivative
12 10 (0.82%) Distributed Systems
12 10 (0.82%) Foreign Exchange (FX)
13 9 (0.74%) e-Learning
13 9 (0.74%) Fixed Income
Operating Systems
1 34 (2.78%) Linux
1 34 (2.78%) Windows
2 14 (1.15%) Apple iOS
2 14 (1.15%) Windows Server
3 10 (0.82%) Android
4 3 (0.25%) CentOS
4 3 (0.25%) Windows Server 2016
4 3 (0.25%) Windows Server 2019
5 2 (0.16%) Debian
5 2 (0.16%) Red Hat Enterprise Linux
5 2 (0.16%) Solaris
5 2 (0.16%) Unix
6 1 (0.082%) AIX
6 1 (0.082%) Amazon Linux
6 1 (0.082%) Ubuntu
6 1 (0.082%) Windows 10
6 1 (0.082%) Windows Server 2003
6 1 (0.082%) zOS
Processes & Methodologies
1 468 (38.33%) Systems Engineering
2 397 (32.51%) Signal Processing
3 383 (31.37%) Mentoring
4 323 (26.45%) Agile
5 258 (21.13%) DevOps
6 210 (17.20%) Software Engineering
7 203 (16.63%) Test Planning
8 200 (16.38%) CI/CD
9 199 (16.30%) Problem-Solving
10 180 (14.74%) Microservices
11 156 (12.78%) Stakeholder Engagement
12 154 (12.61%) Computer Science
13 123 (10.07%) Continuous Improvement
14 122 (9.99%) Coaching
14 122 (9.99%) Roadmaps
15 115 (9.42%) Analytics
16 106 (8.68%) Stakeholder Management
17 105 (8.60%) Project Management
18 91 (7.45%) Architectural Design
19 85 (6.96%) Data Modelling
Programming Languages
1 147 (12.04%) Java
2 130 (10.65%) SQL
3 127 (10.40%) JavaScript
3 127 (10.40%) Python
4 101 (8.27%) R
5 99 (8.11%) C#
6 53 (4.34%) TypeScript
7 33 (2.70%) C++
8 23 (1.88%) Apex Code
9 14 (1.15%) C
9 14 (1.15%) PowerShell
10 13 (1.06%) PHP
10 13 (1.06%) Scala
11 11 (0.90%) Kotlin
12 8 (0.66%) Bash
12 8 (0.66%) Go
13 7 (0.57%) Objective-C
13 7 (0.57%) Ruby
13 7 (0.57%) Swift
14 5 (0.41%) Rust
Qualifications
1 470 (38.49%) BPSS Clearance
2 221 (18.10%) Degree
3 121 (9.91%) Security Cleared
4 98 (8.03%) SC Cleared
5 93 (7.62%) Computer Science Degree
6 41 (3.36%) Master's Degree
7 40 (3.28%) AWS Certification
8 39 (3.19%) CCNP
8 39 (3.19%) Cisco Certification
9 34 (2.78%) CCNA
10 27 (2.21%) JNCIS
11 25 (2.05%) AWS Certified Solutions Architect
11 25 (2.05%) Chartered Engineer
12 24 (1.97%) Azure Certification
13 19 (1.56%) DV Cleared
14 15 (1.23%) TOGAF Certification
15 10 (0.82%) JNCIA
16 8 (0.66%) PhD
17 6 (0.49%) Microsoft Certification
18 5 (0.41%) PMP
Quality Assurance & Compliance
1 403 (33.01%) ISO/IEC 15288
2 63 (5.16%) QA
3 62 (5.08%) GDPR
4 49 (4.01%) Data Quality
5 25 (2.05%) HIPAA
6 22 (1.80%) GxP
7 20 (1.64%) ISO/IEC 27001
8 18 (1.47%) SLA
9 9 (0.74%) California Consumer Privacy Act
9 9 (0.74%) PMO
9 9 (0.74%) SOC 2
10 8 (0.66%) Accessibility
11 6 (0.49%) PCI DSS
12 4 (0.33%) NIST
12 4 (0.33%) Sarbanes-Oxley
13 3 (0.25%) Cyber Essentials
13 3 (0.25%) NCSC
13 3 (0.25%) PMBOK
14 2 (0.16%) Cyber Essentials PLUS
15 1 (0.082%) NIST 800
System Software
1 92 (7.53%) Docker
2 18 (1.47%) Active Directory
3 14 (1.15%) VMware Infrastructure
4 7 (0.57%) Hyper-V
4 7 (0.57%) Virtual Machines
5 4 (0.33%) VMware ESXi
6 3 (0.25%) Firmware
6 3 (0.25%) KVM
7 2 (0.16%) Embedded Firmware
7 2 (0.16%) NFS
7 2 (0.16%) SRDF
7 2 (0.16%) Veritas Cluster Server
7 2 (0.16%) VMware NSX
7 2 (0.16%) vSphere
7 2 (0.16%) Xen
8 1 (0.082%) Snort
8 1 (0.082%) VMware Server
Systems Management
1 88 (7.21%) Terraform
2 79 (6.47%) Kubernetes
3 42 (3.44%) Ansible
4 29 (2.38%) Prometheus
5 27 (2.21%) Grafana
6 9 (0.74%) Progress Chef
7 8 (0.66%) Microsoft Intune
8 4 (0.33%) Single Sign-On
9 3 (0.25%) Active Directory Federation Services
9 3 (0.25%) Puppet
10 2 (0.16%) WMI
11 1 (0.082%) FortiGate
11 1 (0.082%) SCCM
11 1 (0.082%) SCOM
11 1 (0.082%) SCOrch
11 1 (0.082%) SCSM
11 1 (0.082%) Tivoli Storage Manager
11 1 (0.082%) vCenter Server
11 1 (0.082%) ZABBIX
Vendors
1 399 (32.68%) IBM
2 147 (12.04%) Microsoft
3 46 (3.77%) Cisco
4 41 (3.36%) Google
5 40 (3.28%) MathWorks
6 38 (3.11%) Databricks
7 30 (2.46%) Salesforce
8 27 (2.21%) Juniper
9 24 (1.97%) SAP
10 23 (1.88%) VMware
11 22 (1.80%) Salesforce Marketing Cloud
12 16 (1.31%) Oracle
13 9 (0.74%) ServiceNow
14 7 (0.57%) Arista
14 7 (0.57%) New Relic
15 6 (0.49%) EMC
15 6 (0.49%) Rockwell
15 6 (0.49%) Siemens
16 5 (0.41%) Autodesk
16 5 (0.41%) Black Duck