Cybersecurity Job Trends in England

Cybersecurity
UK > England

The table below provides summary statistics and salary benchmarking for jobs advertised in England requiring Cybersecurity skills. It covers permanent job vacancies from the 6 months leading up to 20 November 2025, with comparisons to the same periods in the previous two years.

6 months to
20 Nov 2025
Same period 2024 Same period 2023
Rank 11 39 44
Rank change year-on-year +28 +5 +11
Permanent jobs citing Cybersecurity 4,429 3,054 2,623
As % of all permanent jobs in England 9.60% 5.07% 5.67%
As % of the Processes & Methodologies category 11.19% 6.04% 6.05%
Number of salaries quoted 1,882 1,547 2,043
10th Percentile £28,250 £38,750 £36,250
25th Percentile £31,500 £48,750 £47,500
Median annual salary (50th Percentile) £50,000 £62,500 £62,500
Median % change year-on-year -20.00% - -3.85%
75th Percentile £73,750 £78,750 £80,000
90th Percentile £95,000 £97,500 £95,000
UK median annual salary £50,000 £62,500 £62,500
% change year-on-year -20.00% - -3.85%

All Process and Methodology Skills
England

Cybersecurity falls under the Processes and Methodologies category. For comparison with the information above, the following table provides summary statistics for all permanent job vacancies requiring process or methodology skills in England.

Permanent vacancies with a requirement for process or methodology skills 39,563 50,539 43,368
As % of all permanent jobs advertised in England 85.75% 83.95% 93.70%
Number of salaries quoted 24,533 26,190 33,176
10th Percentile £28,250 £35,000 £32,500
25th Percentile £36,250 £45,000 £45,000
Median annual salary (50th Percentile) £55,000 £60,000 £60,000
Median % change year-on-year -8.33% - -1.64%
75th Percentile £75,000 £80,000 £81,138
90th Percentile £95,000 £100,000 £100,000
UK median annual salary £55,000 £60,000 £60,000
% change year-on-year -8.33% - -

Cybersecurity
Job Vacancy Trend in England

Historical trend showing the proportion of permanent IT job postings citing Cybersecurity relative to all permanent IT jobs advertised in England.
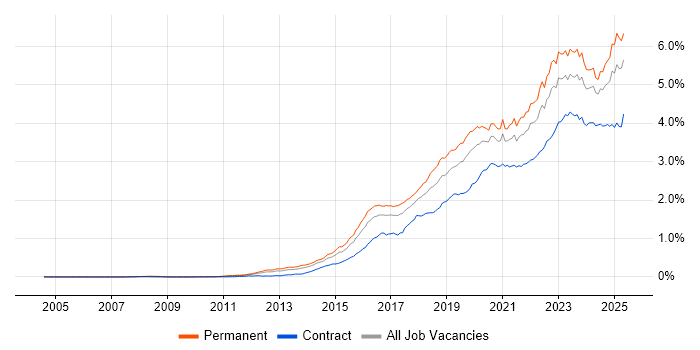
Cybersecurity job vacancy trend in England

Cybersecurity
Salary Trend in England

Salary distribution trend for jobs in England citing Cybersecurity.

Salary distribution trend for jobs in England citing Cybersecurity

Cybersecurity
Salary Histogram in England

Salary distribution for jobs citing Cybersecurity in England over the 6 months to 20 November 2025.

Salary histogram for Cybersecurity in England

Cybersecurity
Job Locations in England

The table below looks at the demand and provides a guide to the median salaries quoted in IT jobs citing Cybersecurity within the England region over the 6 months to 20 November 2025. The 'Rank Change' column provides an indication of the change in demand within each location based on the same 6 month period last year.

Location Rank Change
on Same Period
Last Year
Matching
Permanent
IT Job Ads
Median Salary
Past 6 Months
Median Salary
% Change
on Same Period
Last Year
Live
Jobs
North of England +36 1,222 £37,000 -32.73% 351
London +16 1,110 £69,692 -3.87% 831
South East +23 899 £49,000 -14.78% 517
North West +30 802 £42,750 -22.27% 213
Midlands +19 419 £48,250 -19.58% 254
East of England +47 405 £36,875 -26.25% 139
Yorkshire +28 366 £30,500 -49.17% 104
South West +32 345 £50,000 -23.08% 205
West Midlands +11 255 £52,193 -13.01% 175
East Midlands +41 161 £37,500 -21.05% 79
North East +26 54 £30,500 -36.00% 36
South Coast - 1 £59,000 -
Cybersecurity
UK

Cybersecurity
Co-Occurring Skills & Capabilities in England by Category

The following tables expand on the one above by listing co-occurrences grouped by category. They cover the same employment type, locality and period, with up to 20 co-occurrences shown in each category:

Application Platforms
1 125 (2.82%) SharePoint
2 78 (1.76%) Microsoft Exchange
3 20 (0.45%) CMS
3 20 (0.45%) Confluence
4 16 (0.36%) IIS
5 11 (0.25%) WordPress
6 10 (0.23%) Apache
7 8 (0.18%) nginx
8 6 (0.14%) Apache Solr
8 6 (0.14%) Apache Spark
9 5 (0.11%) Oracle Workflow
10 4 (0.090%) FactoryTalk
10 4 (0.090%) Traefik
10 4 (0.090%) WinCC
11 3 (0.068%) Apache Airflow
11 3 (0.068%) Drupal
11 3 (0.068%) Oracle Coherence
12 2 (0.045%) ArchestrA
13 1 (0.023%) FileNet
Applications
1 117 (2.64%) Microsoft Office
2 50 (1.13%) Maya
3 38 (0.86%) Microsoft Excel
4 30 (0.68%) Chatbot
5 12 (0.27%) Microsoft PowerPoint
6 10 (0.23%) MS Visio
7 8 (0.18%) AutoCAD
8 5 (0.11%) Microsoft Project
9 4 (0.090%) Adobe XD
9 4 (0.090%) Sketch
10 3 (0.068%) Adobe Creative Suite
10 3 (0.068%) CINEMA 4D
10 3 (0.068%) Spreadsheet
11 1 (0.023%) Civil 3D
11 1 (0.023%) GNU Octave
11 1 (0.023%) Revit
Business Applications
1 32 (0.72%) Dynamics CRM
2 22 (0.50%) SAP S/4HANA
3 19 (0.43%) SAP IBP
4 13 (0.29%) SAP CO
4 13 (0.29%) SAP FI
4 13 (0.29%) SAP FI/CO
4 13 (0.29%) SAP FSCM
5 11 (0.25%) SAP IS-U
6 8 (0.18%) SAP FS
7 7 (0.16%) Shopify
8 6 (0.14%) Exchequer
8 6 (0.14%) Sage 200
9 5 (0.11%) NetSuite
10 4 (0.090%) Magento
10 4 (0.090%) NEC Housing
10 4 (0.090%) Salesforce CRM
11 3 (0.068%) SAP ERP
11 3 (0.068%) SAP GRC
11 3 (0.068%) Teamcenter
11 3 (0.068%) Yoast SEO
Cloud Services
1 1,636 (36.94%) Cloud Computing
2 779 (17.59%) Azure
3 430 (9.71%) AWS
4 422 (9.53%) Microsoft 365
5 172 (3.88%) Entra ID
6 143 (3.23%) GitHub
7 93 (2.10%) SaaS
8 84 (1.90%) Power Platform
9 78 (1.76%) GCP
10 68 (1.54%) PaaS
11 52 (1.17%) IaaS
12 49 (1.11%) Azure Sentinel
13 41 (0.93%) Serverless
14 40 (0.90%) Azure DevOps
15 39 (0.88%) Dynamics 365
16 28 (0.63%) OneDrive
17 20 (0.45%) Power Automate
18 18 (0.41%) Amazon S3
19 17 (0.38%) AWS Lambda
19 17 (0.38%) dbt
Communications & Networking
1 1,710 (38.61%) Internet
2 329 (7.43%) Firewall
3 148 (3.34%) Network Security
4 145 (3.27%) VPN
5 127 (2.87%) TCP/IP
6 110 (2.48%) DNS
7 89 (2.01%) DHCP
8 84 (1.90%) WAN
9 79 (1.78%) LAN
10 75 (1.69%) VoIP
11 62 (1.40%) VLAN
12 59 (1.33%) Wi-Fi
13 46 (1.04%) Intrusion Detection
14 36 (0.81%) Modbus
15 30 (0.68%) Wireless
16 29 (0.65%) SD-WAN
17 27 (0.61%) SAN
18 14 (0.32%) NAS
19 13 (0.29%) Unified Communications
19 13 (0.29%) Wireshark
Database & Business Intelligence
1 74 (1.67%) SQL Server
2 55 (1.24%) Power BI
3 34 (0.77%) Tableau
4 31 (0.70%) Data Warehouse
5 30 (0.68%) Relational Database
6 20 (0.45%) Elasticsearch
6 20 (0.45%) SAP BW
7 16 (0.36%) Amazon RDS
8 15 (0.34%) Data Lake
9 14 (0.32%) Metadata
10 13 (0.29%) Big Data
10 13 (0.29%) MySQL
11 12 (0.27%) Amazon Aurora
11 12 (0.27%) PostgreSQL
12 11 (0.25%) Oracle Database
13 9 (0.20%) Neo4j
14 8 (0.18%) Amazon Athena
14 8 (0.18%) DynamoDB
14 8 (0.18%) NoSQL
14 8 (0.18%) SQL Server Integration Services
Development Applications
1 148 (3.34%) Git
2 38 (0.86%) JIRA
3 17 (0.38%) Jenkins
4 11 (0.25%) GitLab
5 6 (0.14%) Cucumber
5 6 (0.14%) Rational DOORS
6 4 (0.090%) Burp Suite
6 4 (0.090%) git-flow
6 4 (0.090%) IntelliJ
6 4 (0.090%) JMeter
6 4 (0.090%) Locust
6 4 (0.090%) Spinnaker
6 4 (0.090%) Toad
7 3 (0.068%) Metasploit
7 3 (0.068%) Snyk
8 2 (0.045%) Bitbucket
8 2 (0.045%) Cypress.io
8 2 (0.045%) Oracle APEX
9 1 (0.023%) Artifactory
9 1 (0.023%) JUnit
General
1 2,709 (61.17%) Social Skills
2 1,740 (39.29%) Inclusion and Diversity
3 1,725 (38.95%) Banking
4 562 (12.69%) Finance
5 431 (9.73%) Analytical Skills
6 230 (5.19%) Marketing
7 220 (4.97%) Telecoms
8 209 (4.72%) Multimedia
9 203 (4.58%) Law
10 193 (4.36%) Public Sector
11 153 (3.45%) Legal
12 144 (3.25%) Manufacturing
13 102 (2.30%) Organisational Skills
14 83 (1.87%) Retail
15 82 (1.85%) Electronics
16 79 (1.78%) Games
17 71 (1.60%) Presentation Skills
18 50 (1.13%) Documentation Skills
19 46 (1.04%) Influencing Skills
20 30 (0.68%) Back Office
Job Titles
1 1,282 (28.95%) Lecturer
2 310 (7.00%) Analyst
3 295 (6.66%) Senior
4 233 (5.26%) Lead
5 212 (4.79%) IT Support
6 211 (4.76%) Trainee
7 192 (4.34%) Consultant
8 167 (3.77%) Architect
9 164 (3.70%) Security Analyst
10 148 (3.34%) Support Engineer
11 132 (2.98%) Security Engineer
12 131 (2.96%) IT Manager
13 120 (2.71%) IT Engineer
14 117 (2.64%) Security Consultant
15 106 (2.39%) Cybersecurity Analyst
16 97 (2.19%) Developer
17 84 (1.90%) Security Manager
18 74 (1.67%) Cybersecurity Consultant
19 73 (1.65%) Cybersecurity Engineer
19 73 (1.65%) Junior
Libraries, Frameworks & Software Standards
1 149 (3.36%) HTML
2 146 (3.30%) CSS
3 38 (0.86%) React
4 28 (0.63%) .NET
4 28 (0.63%) REST
5 25 (0.56%) AngularJS
5 25 (0.56%) YAML
6 20 (0.45%) SAP CAF
7 17 (0.38%) Kafka
8 16 (0.36%) RESTful
8 16 (0.36%) Vue
9 14 (0.32%) Web Services
10 11 (0.25%) EDI
11 10 (0.23%) Middleware
11 10 (0.23%) Pandas
12 9 (0.20%) MERN Stack
12 9 (0.20%) PyTorch
12 9 (0.20%) TensorFlow
12 9 (0.20%) XML
13 8 (0.18%) OAuth
Miscellaneous
1 1,643 (37.10%) IoT
2 203 (4.58%) Management Information System
3 169 (3.82%) Security Posture
4 148 (3.34%) Operational Technology
5 133 (3.00%) Enterprise Software
6 112 (2.53%) Cyber Threat
6 112 (2.53%) Driving Licence
7 105 (2.37%) Self-Motivation
8 93 (2.10%) Data Centre
9 92 (2.08%) Onboarding
10 74 (1.67%) Cloud Native
11 71 (1.60%) Security Operations Centre
12 70 (1.58%) Cyberattack
12 70 (1.58%) Renewable Energy
13 64 (1.45%) Analytical Mindset
14 40 (0.90%) Hybrid Cloud
15 39 (0.88%) Cyber Defence
16 37 (0.84%) SCADA
17 33 (0.75%) CCTV
17 33 (0.75%) Product Ownership
Operating Systems
1 484 (10.93%) Windows
2 172 (3.88%) Windows Server
3 152 (3.43%) Linux
4 78 (1.76%) Windows 10
5 75 (1.69%) Mac OS
6 24 (0.54%) Unix
7 22 (0.50%) Apple iOS
8 21 (0.47%) Android
9 14 (0.32%) Red Hat Enterprise Linux
10 11 (0.25%) VMS
11 10 (0.23%) Windows Server 2019
12 8 (0.18%) Windows Server 2016
13 7 (0.16%) Debian
14 5 (0.11%) Mac OS X
14 5 (0.11%) Windows 7
15 3 (0.068%) Ubuntu
16 2 (0.045%) Check Point GAiA
16 2 (0.045%) Kali Linux
16 2 (0.045%) Windows Server 2012
17 1 (0.023%) OpenWrt
Processes & Methodologies
1 1,816 (41.00%) AI
2 1,654 (37.34%) Machine Learning
3 1,616 (36.49%) User Experience
4 1,593 (35.97%) Web Development
5 592 (13.37%) Problem-Solving
6 509 (11.49%) Mentoring
7 362 (8.17%) Risk Management
8 331 (7.47%) Information Security
9 320 (7.23%) Incident Response
10 293 (6.62%) Continuous Improvement
11 270 (6.10%) Agile
12 240 (5.42%) ITIL
13 226 (5.10%) Project Management
14 210 (4.74%) Vulnerability Management
15 208 (4.70%) Computer Science
16 204 (4.61%) SIEM
17 202 (4.56%) Analytics
18 192 (4.34%) Project Delivery
19 188 (4.24%) Security Operations
20 186 (4.20%) Decision-Making
Programming Languages
1 292 (6.59%) Python
2 170 (3.84%) JavaScript
3 139 (3.14%) PowerShell
4 118 (2.66%) SQL
5 67 (1.51%) R
6 47 (1.06%) Java
7 45 (1.02%) Bash
8 33 (0.75%) C#
9 21 (0.47%) Kusto Query Language
10 16 (0.36%) Bicep
11 14 (0.32%) TypeScript
12 12 (0.27%) Go
13 10 (0.23%) C
13 10 (0.23%) Kotlin
14 9 (0.20%) C++
14 9 (0.20%) Scala
15 8 (0.18%) T-SQL
16 6 (0.14%) Shell Script
17 5 (0.11%) Perl
18 4 (0.090%) Uniface
Qualifications
1 2,131 (48.11%) Degree
2 1,649 (37.23%) Master's Degree
3 1,583 (35.74%) PhD
4 1,576 (35.58%) Postgraduate
5 359 (8.11%) CISSP
6 277 (6.25%) Security Cleared
7 235 (5.31%) CISM
8 218 (4.92%) CompTIA Security+
9 215 (4.85%) Azure Certification
10 200 (4.52%) Microsoft Certification
11 184 (4.15%) SC Cleared
12 164 (3.70%) CEH
13 161 (3.64%) AWS Certification
14 126 (2.84%) AWS Certified Cloud Practitioner
15 103 (2.33%) Computer Science Degree
16 100 (2.26%) Network+ Certification
17 95 (2.14%) A+ Certification
17 95 (2.14%) CISA
18 85 (1.92%) DV Cleared
19 82 (1.85%) Cisco Certification
Quality Assurance & Compliance
1 445 (10.05%) ISO/IEC 27001
2 395 (8.92%) NIST
3 247 (5.58%) GDPR
4 200 (4.52%) Cyber Essentials
5 138 (3.12%) GRC
6 91 (2.05%) NCSC
7 86 (1.94%) PCI DSS
8 79 (1.78%) Cyber Essentials PLUS
9 73 (1.65%) QA
10 47 (1.06%) NIST 800
11 45 (1.02%) SLA
12 41 (0.93%) SOC 2
13 37 (0.84%) COBIT
14 34 (0.77%) JSP 440
15 25 (0.56%) PMO
16 22 (0.50%) RMADS
17 21 (0.47%) Data Quality
18 20 (0.45%) ISO 9001
19 19 (0.43%) Accessibility
20 18 (0.41%) Sarbanes-Oxley
System Software
1 325 (7.34%) Active Directory
2 103 (2.33%) VMware Infrastructure
3 68 (1.54%) Hyper-V
4 65 (1.47%) Virtual Servers
5 49 (1.11%) Docker
6 39 (0.88%) Virtual Machines
7 19 (0.43%) VMware ESXi
8 17 (0.38%) vSphere
9 6 (0.14%) BitLocker
10 5 (0.11%) Kamailio
11 4 (0.090%) Firmware
11 4 (0.090%) Virtual Desktop
12 3 (0.068%) Microsoft Virtual Server
12 3 (0.068%) Slurm Workload Manager
13 2 (0.045%) GPFS
13 2 (0.045%) Lustre
14 1 (0.023%) EMC RecoverPoint
14 1 (0.023%) iptables
14 1 (0.023%) Terminal Server
14 1 (0.023%) XenApp
Systems Management
1 165 (3.73%) Microsoft Intune
2 58 (1.31%) Terraform
3 52 (1.17%) Kubernetes
4 31 (0.70%) Ansible
5 24 (0.54%) SCCM
6 18 (0.41%) RSA Archer
7 17 (0.38%) Single Sign-On
8 15 (0.34%) Functional Safety
8 15 (0.34%) Jamf Pro
8 15 (0.34%) QRadar
9 14 (0.32%) Nessus
10 11 (0.25%) CSIRT
10 11 (0.25%) PaperCut
11 10 (0.23%) Grafana
12 9 (0.20%) CASB
13 7 (0.16%) FortiGate
13 7 (0.16%) Nagios
14 6 (0.14%) Autotask
14 6 (0.14%) Computer Incident Response Team
14 6 (0.14%) Systems Management Server (SMS)
Vendors
1 926 (20.91%) Microsoft
2 145 (3.27%) VMware
3 135 (3.05%) SAP
4 96 (2.17%) Cisco
5 85 (1.92%) Palo Alto
6 71 (1.60%) Oracle
7 54 (1.22%) Apple
8 53 (1.20%) CrowdStrike
9 52 (1.17%) Fortinet
9 52 (1.17%) Salesforce
10 49 (1.11%) Adobe
11 47 (1.06%) ForeScout
11 47 (1.06%) Splunk
12 40 (0.90%) ServiceNow
13 32 (0.72%) Sophos
14 26 (0.59%) Siemens
15 25 (0.56%) Qualys
16 24 (0.54%) Dell
17 23 (0.52%) Progress
18 20 (0.45%) Google