Self-Motivation Jobs in England

Self-Motivation
UK > England

The table below looks at the prevalence of the term Self-Motivation in permanent job vacancies in England. Included is a benchmarking guide to the salaries offered in vacancies that cited Self-Motivation over the 6 months leading up to 17 July 2025, comparing them to the same period in the previous two years.

6 months to
17 Jul 2025
Same period 2024 Same period 2023
Rank 102 61 113
Rank change year-on-year -41 +52 -29
Permanent jobs citing Self-Motivation 1,551 3,140 2,257
As % of all permanent jobs advertised in England 2.95% 3.60% 3.02%
As % of the Miscellaneous category 7.82% 10.84% 7.13%
Number of salaries quoted 653 1,733 1,340
10th Percentile £25,500 £24,500 £27,500
25th Percentile £28,500 £28,500 £35,000
Median annual salary (50th Percentile) £42,500 £42,500 £52,500
Median % change year-on-year - -19.05% -4.55%
75th Percentile £62,500 £56,252 £71,250
90th Percentile £80,000 £71,250 £87,500
UK median annual salary £42,500 £42,500 £54,000
% change year-on-year - -21.30% -1.82%

All Generic Skills
England

Self-Motivation falls under the General and Transferable Skills category. For comparison with the information above, the following table provides summary statistics for all permanent job vacancies requiring generic IT skills in England.

Permanent vacancies with a requirement for generic IT skills 19,843 28,979 31,661
As % of all permanent jobs advertised in England 37.76% 33.22% 42.34%
Number of salaries quoted 9,516 18,928 19,339
10th Percentile £29,625 £28,750 £35,487
25th Percentile £40,000 £39,750 £46,570
Median annual salary (50th Percentile) £57,560 £55,000 £65,000
Median % change year-on-year +4.65% -15.38% +4.00%
75th Percentile £78,750 £77,500 £86,250
90th Percentile £107,500 £100,000 £110,000
UK median annual salary £57,500 £55,000 £65,000
% change year-on-year +4.55% -15.38% +4.00%

Self-Motivation
Job Vacancy Trend in England

Job postings citing Self-Motivation as a proportion of all IT jobs advertised in England.
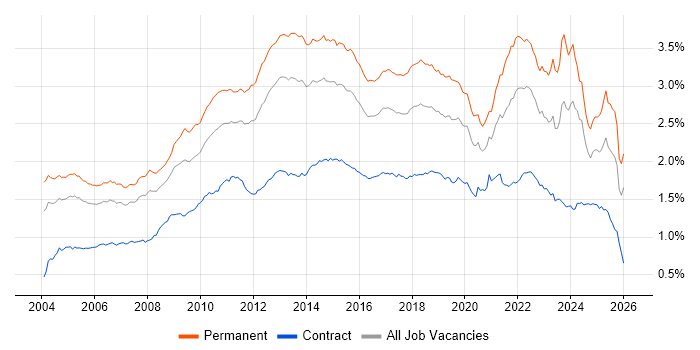
Job vacancy trend for Self-Motivation in England

Self-Motivation
Salary Trend in England

3-month moving average salary quoted in jobs citing Self-Motivation in England.

Salary trend for Self-Motivation in England

Self-Motivation
Salary Histogram in England

Salary distribution for jobs citing Self-Motivation in England over the 6 months to 17 July 2025.

Salary histogram for Self-Motivation in England

Self-Motivation
Job Locations in England

The table below looks at the demand and provides a guide to the median salaries quoted in IT jobs citing Self-Motivation within the England region over the 6 months to 17 July 2025. The 'Rank Change' column provides an indication of the change in demand within each location based on the same 6 month period last year.

Location Rank Change
on Same Period
Last Year
Matching
Permanent
IT Job Ads
Median Salary
Past 6 Months
Median Salary
% Change
on Same Period
Last Year
Live
Jobs
North of England -20 393 £30,500 -18.67% 338
London -14 390 £57,500 +9.52% 889
North West -44 253 £37,500 +15.38% 210
South East -90 241 £42,500 +8.97% 412
East of England -8 183 £42,500 +26.87% 134
Midlands -72 119 £40,000 -4.76% 221
Yorkshire -6 97 £26,500 -41.11% 104
South West -26 95 £40,000 -15.79% 119
West Midlands -40 76 £40,000 -15.79% 142
North East +40 43 £28,188 -14.58% 29
East Midlands -53 42 £35,500 -11.25% 76
Self-Motivation
UK

Self-Motivation
Co-occurring Skills and Capabilities in England by Category

The follow tables expand on the table above by listing co-occurrences grouped by category. The same employment type, locality and period is covered with up to 20 co-occurrences shown in each of the following categories:

Application Platforms
1 79 (5.09%) Confluence
2 61 (3.93%) SharePoint
3 43 (2.77%) Microsoft Exchange
4 15 (0.97%) IIS
5 10 (0.64%) WordPress
6 9 (0.58%) Tomcat
7 4 (0.26%) Liferay
8 3 (0.19%) Apache
9 2 (0.13%) CMS
9 2 (0.13%) Skype for Business
10 1 (0.064%) Drupal
10 1 (0.064%) Joomla!
10 1 (0.064%) OpenEdge
10 1 (0.064%) Oracle SOA Suite
10 1 (0.064%) Oracle Workflow
10 1 (0.064%) SAS
10 1 (0.064%) Umbraco
Applications
1 234 (15.09%) Microsoft Office
2 78 (5.03%) Microsoft Excel
3 31 (2.00%) Microsoft PowerPoint
4 7 (0.45%) Photoshop
5 6 (0.39%) Adobe Creative Suite
5 6 (0.39%) Microsoft Project
5 6 (0.39%) Revit
6 5 (0.32%) Adobe Illustrator
7 4 (0.26%) MS Visio
8 3 (0.19%) Adobe Premiere
8 3 (0.19%) Final Cut Pro
8 3 (0.19%) InDesign
8 3 (0.19%) Simulink
8 3 (0.19%) Spreadsheet
9 2 (0.13%) OrCAD
10 1 (0.064%) Adobe Captivate
10 1 (0.064%) Autodesk Inventor
10 1 (0.064%) SOLIDWORKS
Business Applications
1 23 (1.48%) NetSuite
2 17 (1.10%) Sage 200
3 16 (1.03%) Sage CRM
4 10 (0.64%) Salesforce CRM
5 6 (0.39%) Shopify
6 5 (0.32%) Dynamics CRM
7 4 (0.26%) SAP S/4HANA
8 2 (0.13%) Maximo
8 2 (0.13%) Remedy ITSM
9 1 (0.064%) C-CURE
9 1 (0.064%) Dynamics AX
9 1 (0.064%) Elite 3E
9 1 (0.064%) iTrent
9 1 (0.064%) Magento
9 1 (0.064%) MFGPRO
9 1 (0.064%) Payment Gateway
9 1 (0.064%) Raiser’s Edge
9 1 (0.064%) ResourceLink
9 1 (0.064%) SAP GRC
9 1 (0.064%) Summit
Cloud Services
1 506 (32.62%) Azure
2 467 (30.11%) AWS
3 404 (26.05%) GCP
4 220 (14.18%) Serverless
5 215 (13.86%) AWS Lambda
6 106 (6.83%) Microsoft 365
7 83 (5.35%) SaaS
8 73 (4.71%) Asana
9 72 (4.64%) Miro
10 39 (2.51%) Power Platform
11 36 (2.32%) OneDrive
12 34 (2.19%) Entra ID
13 29 (1.87%) Microsoft Copilot
14 22 (1.42%) Google Analytics
15 16 (1.03%) Power Automate
16 13 (0.84%) GitHub
16 13 (0.84%) Nutanix
17 11 (0.71%) Microsoft Purview
18 9 (0.58%) Canva
18 9 (0.58%) PowerApps
Communications & Networking
1 307 (19.79%) Broadband
2 67 (4.32%) Firewall
3 31 (2.00%) WAN
4 28 (1.81%) Wi-Fi
5 26 (1.68%) LAN
6 23 (1.48%) TCP/IP
7 22 (1.42%) Wireless
8 20 (1.29%) DNS
9 19 (1.23%) VoIP
10 17 (1.10%) DHCP
10 17 (1.10%) Internet
11 13 (0.84%) VPN
12 12 (0.77%) SSL
13 11 (0.71%) 5G
13 11 (0.71%) SD-WAN
13 11 (0.71%) WebEx
14 10 (0.64%) Intrusion Detection
14 10 (0.64%) VLAN
15 9 (0.58%) DMARC
16 8 (0.52%) HTTP
Database & Business Intelligence
1 70 (4.51%) SQL Server
2 31 (2.00%) Power BI
3 19 (1.23%) PostgreSQL
4 16 (1.03%) OLTP
5 10 (0.64%) NoSQL
6 9 (0.58%) MySQL
7 8 (0.52%) Relational Database
7 8 (0.52%) Tableau
8 7 (0.45%) Metadata
9 6 (0.39%) Data Warehouse
10 5 (0.32%) Amazon RDS
10 5 (0.32%) MariaDB
10 5 (0.32%) RDBMS
10 5 (0.32%) SQL Server Reporting Services
11 4 (0.26%) Couchbase
11 4 (0.26%) MongoDB
11 4 (0.26%) MS Access
12 3 (0.19%) Azure SQL Database
12 3 (0.19%) Data Lake
12 3 (0.19%) Data Mining
Development Applications
1 88 (5.67%) JIRA
2 26 (1.68%) Git
3 6 (0.39%) Subversion
4 4 (0.26%) Jenkins
4 4 (0.26%) Selenium
4 4 (0.26%) SoapUI
4 4 (0.26%) Visual Studio
4 4 (0.26%) WebDriver
5 3 (0.19%) GDB
5 3 (0.19%) Team Foundation Server
6 2 (0.13%) Cypress.io
6 2 (0.13%) GitLab
6 2 (0.13%) Octopus Deploy
6 2 (0.13%) Postman
6 2 (0.13%) Rational DOORS
6 2 (0.13%) Spock
6 2 (0.13%) TeamCity
7 1 (0.064%) Bitbucket
7 1 (0.064%) Liquibase
7 1 (0.064%) Oracle Forms
General
1 646 (41.65%) Social Skills
2 424 (27.34%) Analytical Skills
3 341 (21.99%) Finance
4 239 (15.41%) Inclusion and Diversity
5 165 (10.64%) Organisational Skills
6 147 (9.48%) Marketing
7 87 (5.61%) Influencing Skills
8 86 (5.54%) Presentation Skills
9 77 (4.96%) Electronics
10 64 (4.13%) Legal
11 53 (3.42%) Manufacturing
11 53 (3.42%) Retail
12 49 (3.16%) Telecoms
13 45 (2.90%) Public Sector
14 41 (2.64%) Banking
15 32 (2.06%) Law
16 30 (1.93%) Advertising
17 29 (1.87%) Games
18 18 (1.16%) Billing
19 14 (0.90%) Financial Institution
Job Titles
1 494 (31.85%) Senior
2 215 (13.86%) Machine Learning Engineer
3 183 (11.80%) Software Engineer
4 178 (11.48%) Senior Software Engineer
5 167 (10.77%) Analyst
6 84 (5.42%) IT Support
7 77 (4.96%) Developer
8 74 (4.77%) Product Analyst
8 74 (4.77%) Support Engineer
9 59 (3.80%) Technical Support
10 50 (3.22%) Account Executive
11 49 (3.16%) Business Manager
12 48 (3.09%) Consultant
12 48 (3.09%) Lead
13 47 (3.03%) Administrator
13 47 (3.03%) Development Manager
14 46 (2.97%) Business Development Manager
15 42 (2.71%) IT Engineer
16 38 (2.45%) IT Support Engineer
17 33 (2.13%) Technical Engineer
Libraries, Frameworks & Software Standards
1 202 (13.02%) .NET
2 190 (12.25%) Node.js
3 42 (2.71%) HTML
4 33 (2.13%) JSON
5 20 (1.29%) React
5 20 (1.29%) REST
5 20 (1.29%) XML
6 14 (0.90%) SOAP
7 13 (0.84%) CSS
8 10 (0.64%) Web Services
9 6 (0.39%) Blazor
9 6 (0.39%) EDI
9 6 (0.39%) WinForms
10 5 (0.32%) AngularJS
10 5 (0.32%) GraphQL
11 4 (0.26%) FreeSWITCH
11 4 (0.26%) React Native
12 3 (0.19%) FIX Protocol
12 3 (0.19%) RESTful
12 3 (0.19%) Spring
Miscellaneous
1 181 (11.67%) Linux Command Line
2 178 (11.48%) Cyberattack
3 80 (5.16%) Product Ownership
4 79 (5.09%) Social Media
5 72 (4.64%) Over-the-Top Content
5 72 (4.64%) Video\Live Streaming
6 61 (3.93%) Onboarding
7 47 (3.03%) Driving Licence
8 45 (2.90%) Management Information System
9 39 (2.51%) Mobile App
10 37 (2.39%) Data Centre
11 28 (1.81%) Team-Oriented Environment
12 17 (1.10%) Enterprise Software
13 15 (0.97%) Virtual Team
14 13 (0.84%) Algorithms
14 13 (0.84%) Analytical Mindset
15 12 (0.77%) Blog
16 11 (0.71%) Digital Signage
16 11 (0.71%) FMCG
17 10 (0.64%) FPGA
Operating Systems
1 240 (15.47%) Linux
2 178 (11.48%) Windows
3 62 (4.00%) Windows Server
4 29 (1.87%) Android
5 24 (1.55%) Mac OS
6 22 (1.42%) Windows 10
7 19 (1.23%) Windows Vista
8 18 (1.16%) Apple iOS
9 17 (1.10%) Unix
10 13 (0.84%) Windows Server 2019
11 11 (0.71%) Windows 7
12 6 (0.39%) zOS
13 3 (0.19%) Embedded Linux
14 2 (0.13%) Mac OS X
14 2 (0.13%) Red Hat Enterprise Linux
14 2 (0.13%) Windows Server 2003
15 1 (0.064%) Debian
15 1 (0.064%) Windows Server 2012
Processes & Methodologies
1 609 (39.26%) Agile
2 605 (39.01%) Problem-Solving
3 475 (30.63%) Mentoring
4 405 (26.11%) Machine Learning
5 377 (24.31%) Customer Service
6 245 (15.80%) Clean Code
7 243 (15.67%) Creative Thinking
8 239 (15.41%) CI/CD
8 239 (15.41%) Performance Metrics
9 232 (14.96%) Software Engineering
10 224 (14.44%) Data Science
11 217 (13.99%) User Experience
12 215 (13.86%) Personalization
13 202 (13.02%) CRM
14 195 (12.57%) Microservices
15 192 (12.38%) Scrum
16 191 (12.31%) Cloud Security
17 181 (11.67%) Data Engineering
17 181 (11.67%) Site Reliability Engineering
18 175 (11.28%) Business Development
Programming Languages
1 438 (28.24%) Python
2 239 (15.41%) JavaScript
3 229 (14.76%) TypeScript
4 226 (14.57%) Java
5 203 (13.09%) C++
6 180 (11.61%) Rust
7 178 (11.48%) Go
8 153 (9.86%) SQL
9 35 (2.26%) C#
10 26 (1.68%) PL/SQL
11 25 (1.61%) PowerShell
12 23 (1.48%) C
13 15 (0.97%) VBA
14 11 (0.71%) MATLAB
15 10 (0.64%) Bash
15 10 (0.64%) R
16 9 (0.58%) PHP
17 8 (0.52%) T-SQL
18 6 (0.39%) Embedded C
19 5 (0.32%) Kotlin
Qualifications
1 445 (28.69%) Degree
2 228 (14.70%) PhD
2 228 (14.70%) Security Cleared
3 188 (12.12%) DV Cleared
4 182 (11.73%) AWS Certification
5 181 (11.67%) AWS Certified Solutions Architect
6 178 (11.48%) AWS Certified Developer
7 48 (3.09%) Master's Degree
8 43 (2.77%) DBS Check
9 35 (2.26%) Computer Science Degree
10 25 (1.61%) Microsoft Certification
11 24 (1.55%) Cisco Certification
12 21 (1.35%) SC Cleared
13 19 (1.23%) CISSP
14 17 (1.10%) CISM
15 15 (0.97%) MCSA
16 12 (0.77%) CISA
17 11 (0.71%) CCNP
18 10 (0.64%) CRISC
18 10 (0.64%) MCSE
Quality Assurance & Compliance
1 44 (2.84%) ISO/IEC 27001
2 41 (2.64%) SLA
3 29 (1.87%) GDPR
4 25 (1.61%) Accessibility
5 21 (1.35%) QA
6 15 (0.97%) Data Quality
6 15 (0.97%) NIST
6 15 (0.97%) PMO
7 11 (0.71%) Cyber Essentials
8 9 (0.58%) Cyber Essentials PLUS
9 8 (0.52%) Sarbanes-Oxley
10 7 (0.45%) GRC
10 7 (0.45%) ISO/IEC 27002 (supersedes ISO/IEC 17799)
11 4 (0.26%) ISO 9001
11 4 (0.26%) Software Quality Assurance
12 3 (0.19%) COSHH
12 3 (0.19%) IEC 61508
12 3 (0.19%) JTAG
12 3 (0.19%) NCSC
13 2 (0.13%) Actionable Recommendations
System Software
1 73 (4.71%) Active Directory
2 31 (2.00%) Hyper-V
2 31 (2.00%) VMware Infrastructure
3 19 (1.23%) Docker
4 16 (1.03%) Firmware
5 5 (0.32%) Citrix Hypervisor
6 4 (0.26%) Virtual Servers
7 3 (0.19%) VMware ESXi
8 2 (0.13%) Virtual Desktop
8 2 (0.13%) Virtual Machines
8 2 (0.13%) vSphere
9 1 (0.064%) HDFS
9 1 (0.064%) Terminal Server
9 1 (0.064%) Veritas Cluster Server
9 1 (0.064%) VirtualBox
Systems Management
1 41 (2.64%) Microsoft Intune
2 18 (1.16%) Kubernetes
3 14 (0.90%) Terraform
4 10 (0.64%) SCCM
5 9 (0.58%) Single Sign-On
6 7 (0.45%) PaperCut
7 6 (0.39%) Ansible
8 3 (0.19%) Functional Safety
8 3 (0.19%) SCOM
9 2 (0.13%) Grafana
9 2 (0.13%) Prometheus
9 2 (0.13%) RSA Archer
9 2 (0.13%) SCOrch
9 2 (0.13%) SCSM
10 1 (0.064%) Backup Exec
10 1 (0.064%) BMC PATROL
10 1 (0.064%) Computer Incident Response Team
10 1 (0.064%) EMC NetWorker
10 1 (0.064%) Nessus
Vendors
1 354 (22.82%) Microsoft
2 107 (6.90%) Salesforce
3 51 (3.29%) Oracle
4 44 (2.84%) Google
5 37 (2.39%) VMware
6 33 (2.13%) YouTube
7 26 (1.68%) SAP
8 23 (1.48%) Cisco
9 22 (1.42%) HP
10 18 (1.16%) BT
10 18 (1.16%) Zoho
11 17 (1.10%) Sage
12 16 (1.03%) Apple
13 14 (0.90%) Adobe
14 13 (0.84%) IBM
14 13 (0.84%) ServiceNow
15 12 (0.77%) Citrix
15 12 (0.77%) Dell
16 10 (0.64%) Commvault
16 10 (0.64%) Intel